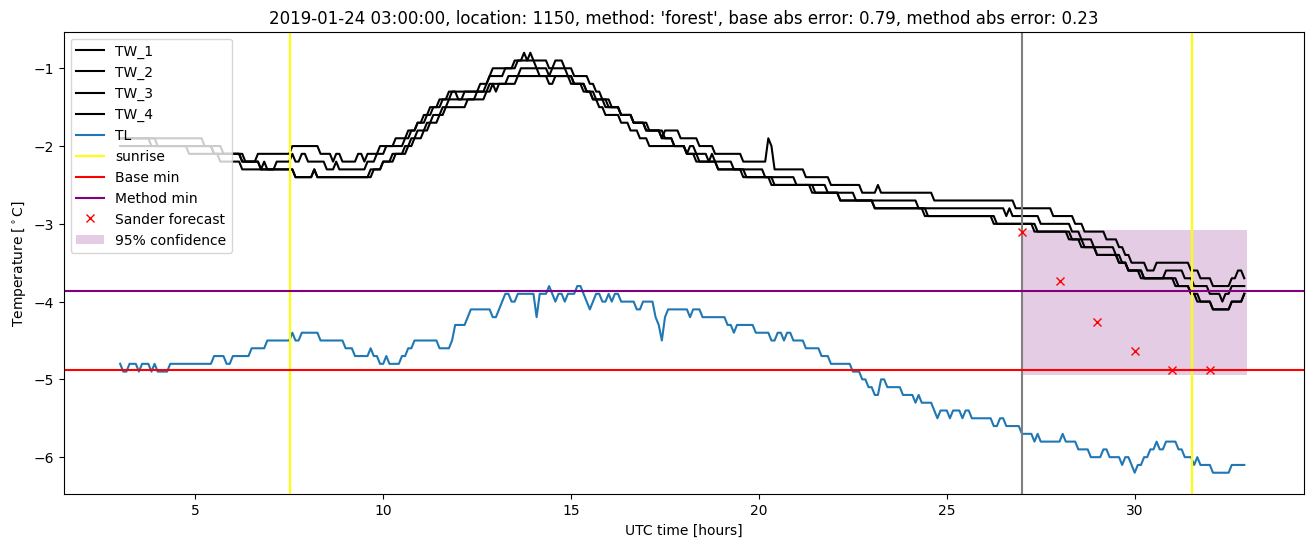
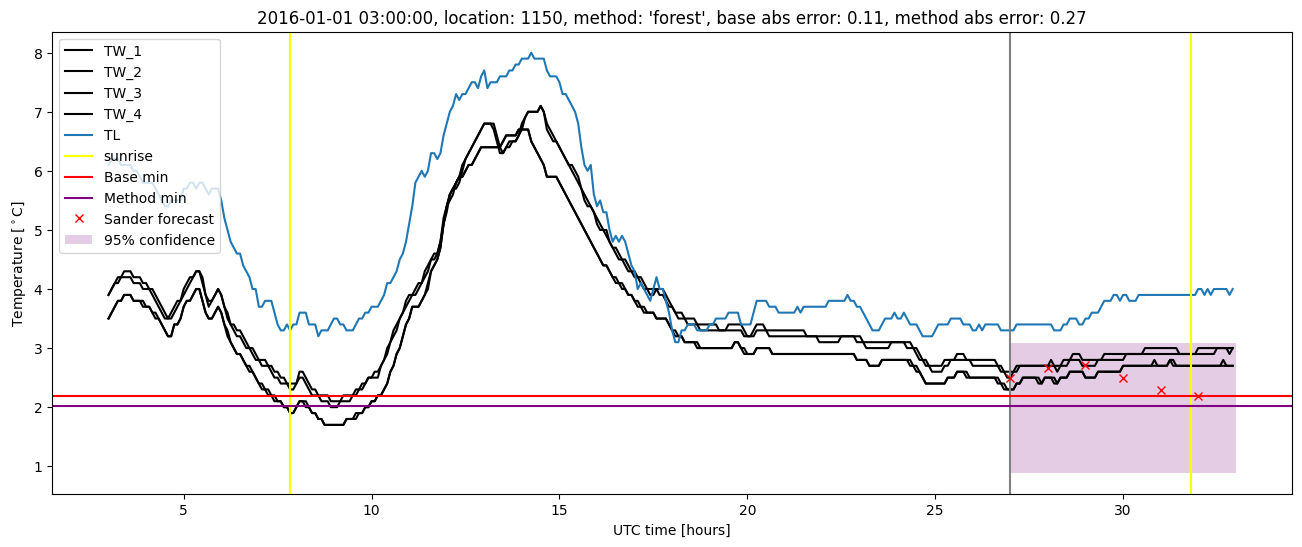
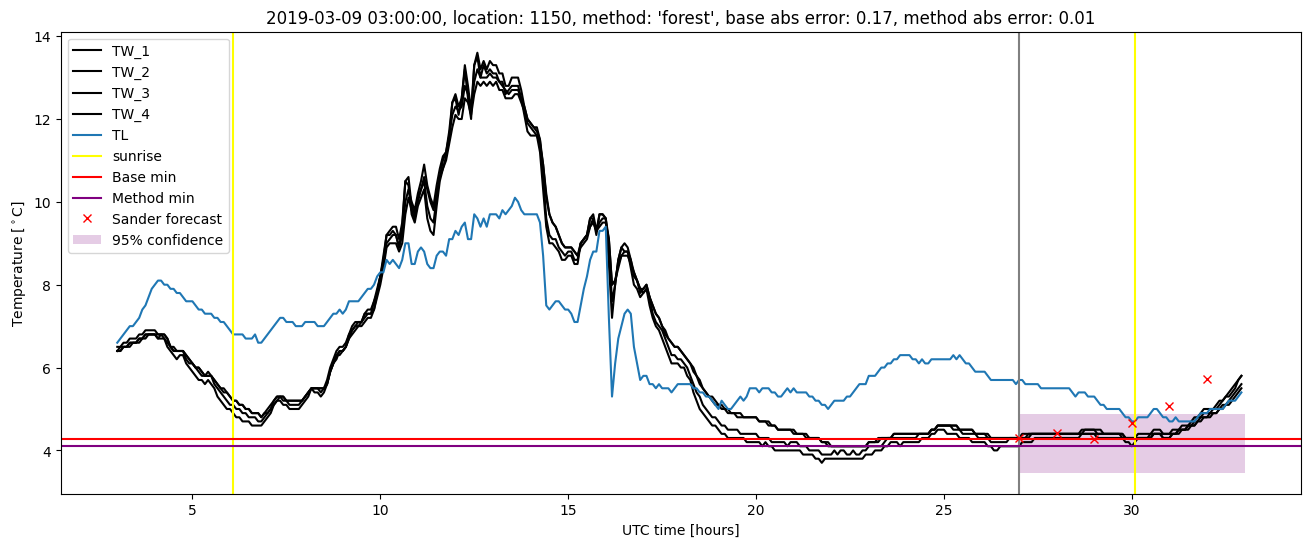
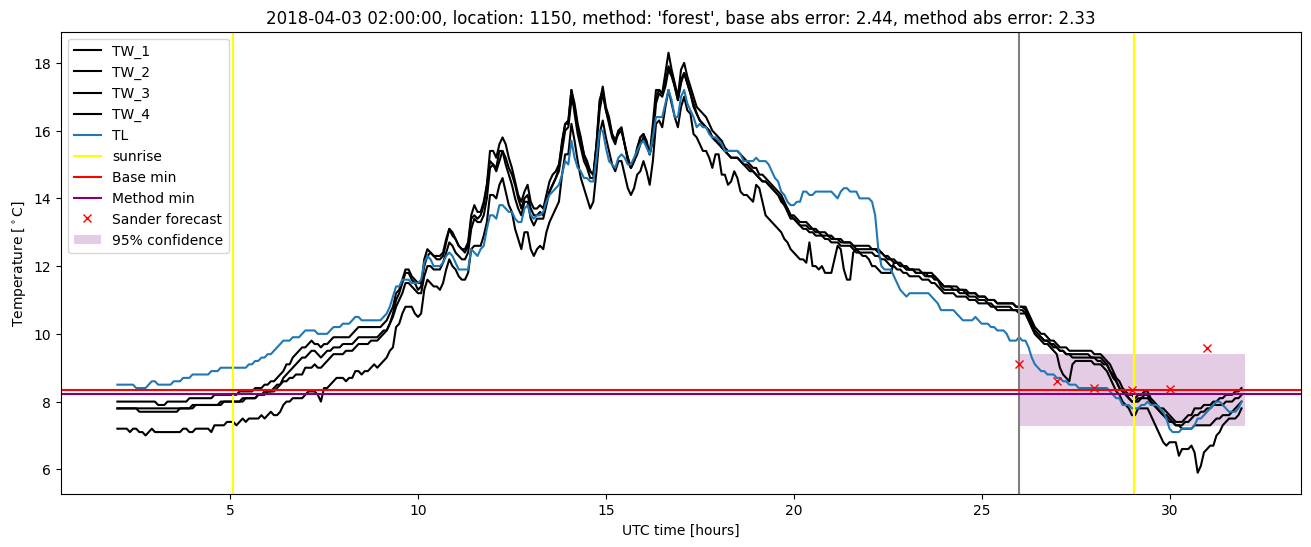
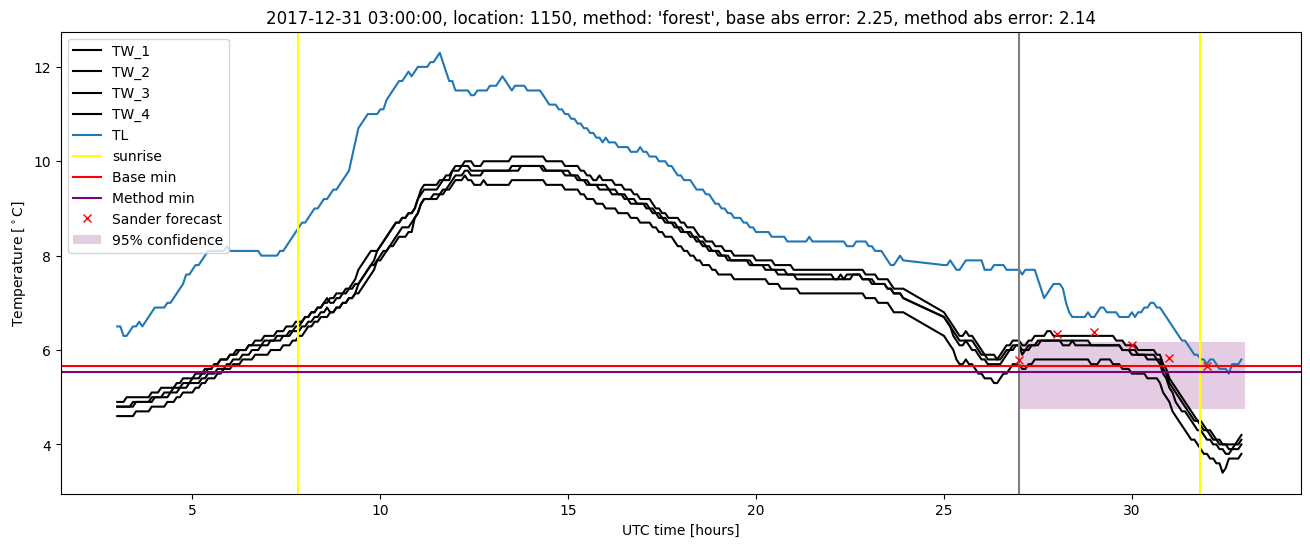
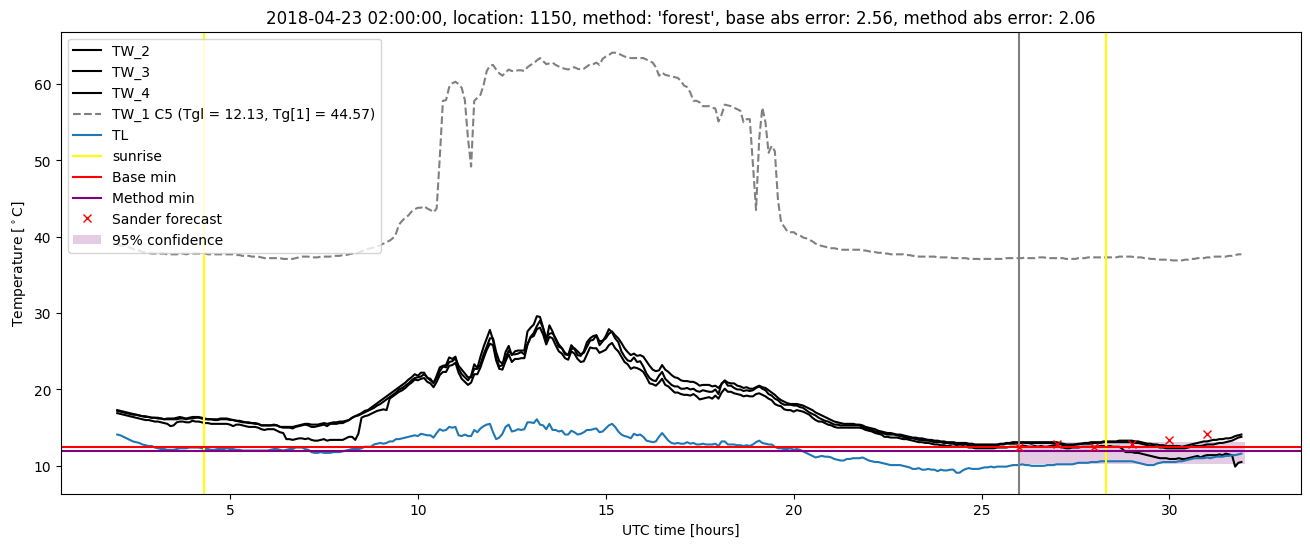
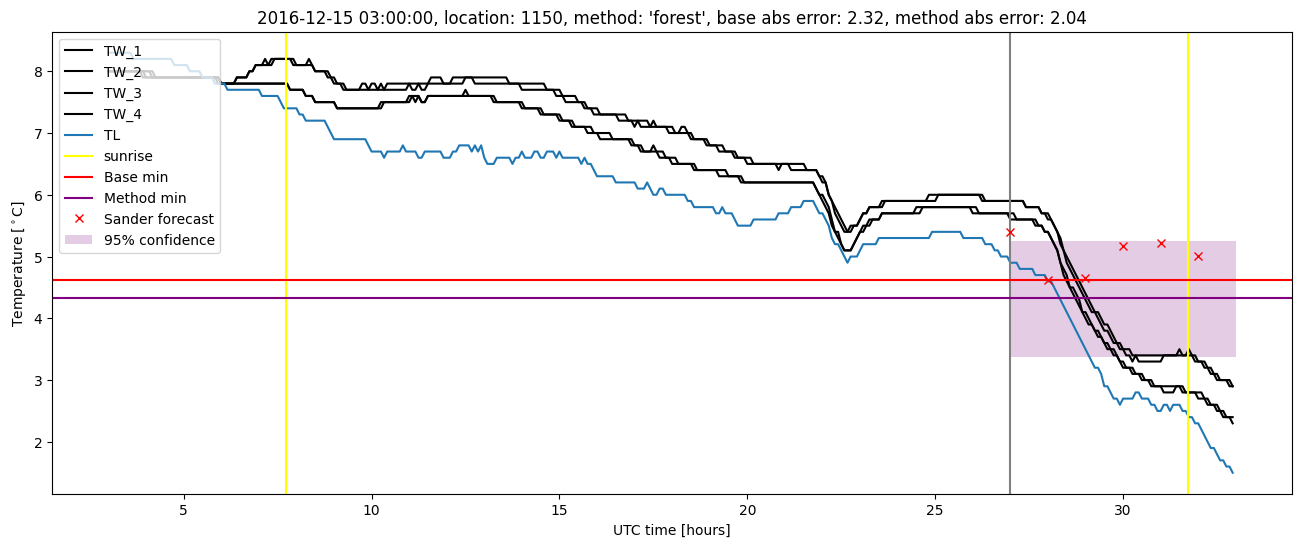
GMS location: 1150
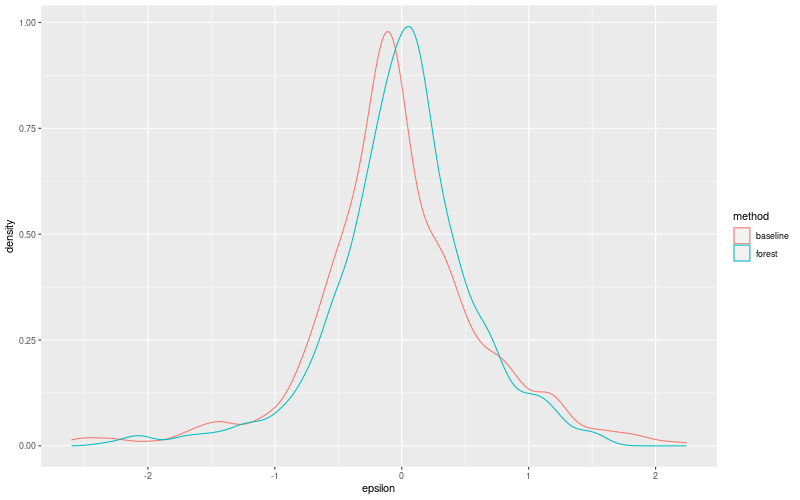
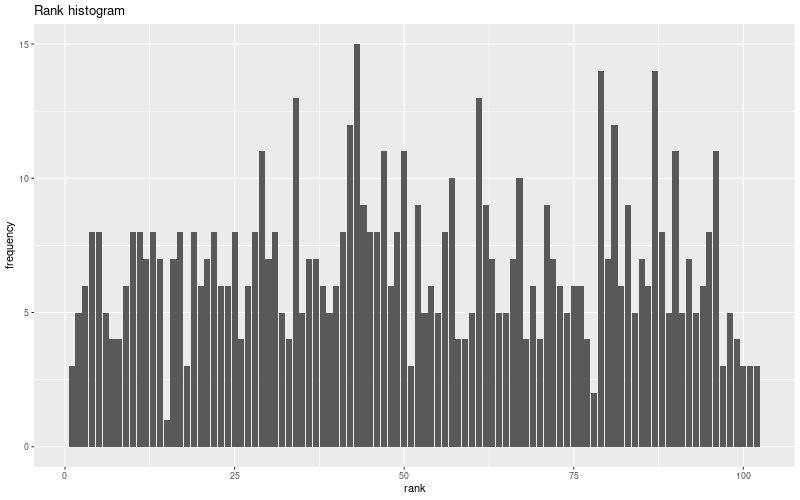
Random forest results
| names |
period |
power |
significance |
meanSquareError |
absError |
maxError |
CRPS |
IGN |
| baseline |
winter 2016 |
0.994 |
0.094 |
0.387 |
0.460 |
2.200 |
NaN |
NaN |
| forest |
winter 2016 |
0.994 |
0.062 |
0.304 |
0.404 |
1.819 |
0.512 |
2.989 |
| baseline |
winter 2017 |
0.983 |
0.057 |
0.544 |
0.528 |
2.599 |
NaN |
NaN |
| forest |
winter 2017 |
0.983 |
0.000e+00 |
0.347 |
0.423 |
2.035 |
0.505 |
3.535 |
| baseline |
winter 2018 |
0.985 |
0.130 |
0.425 |
0.462 |
2.563 |
NaN |
NaN |
| forest |
winter 2018 |
0.978 |
0.109 |
0.353 |
0.425 |
2.329 |
0.513 |
3.067 |
| baseline |
winter 2019 |
0.986 |
0.000e+00 |
0.365 |
0.424 |
2.461 |
NaN |
NaN |
| forest |
winter 2019 |
0.993 |
0.000e+00 |
0.216 |
0.342 |
2.152 |
0.512 |
3.252 |
| baseline |
all |
0.988 |
0.087 |
0.427 |
0.468 |
2.599 |
NaN |
NaN |
| forest |
all |
0.988 |
0.056 |
0.307 |
0.400 |
2.329 |
0.511 |
3.188 |
Random forest plots

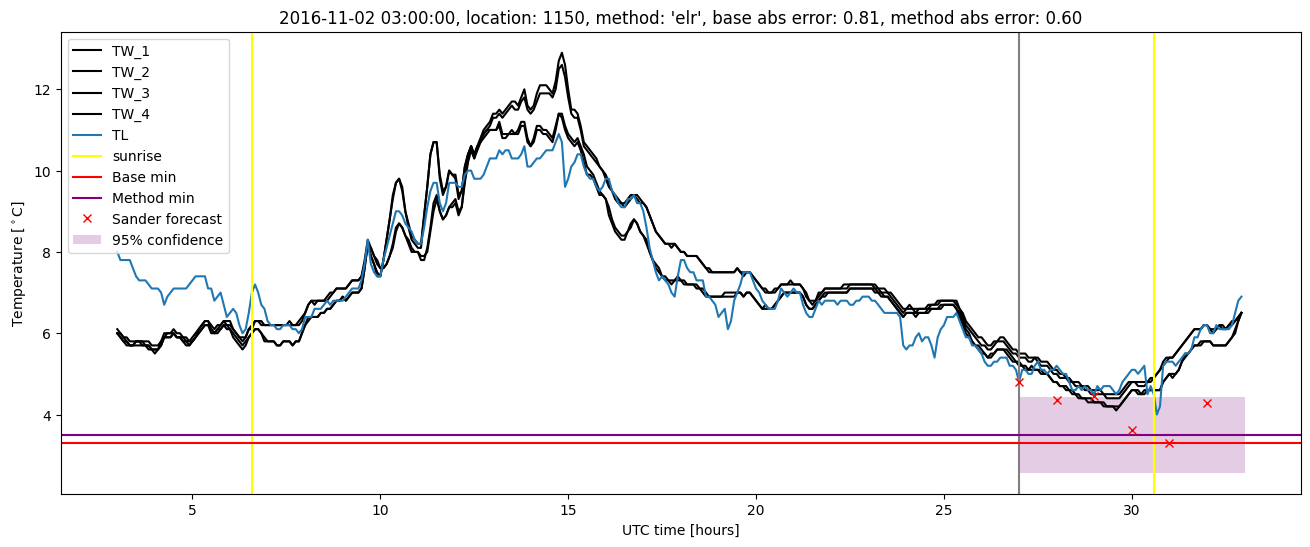
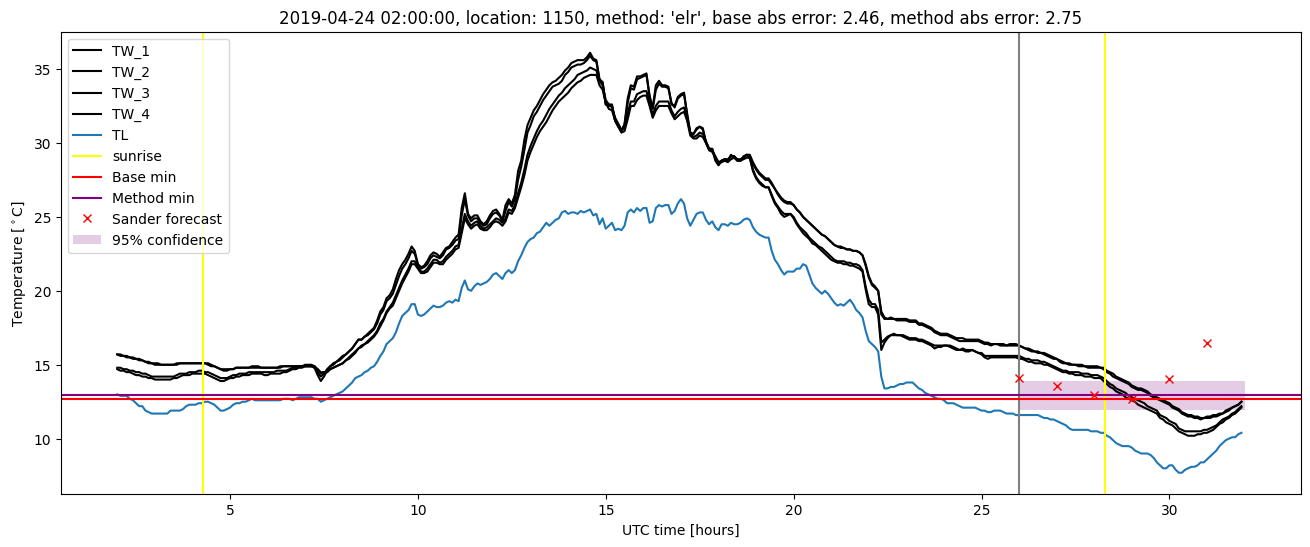
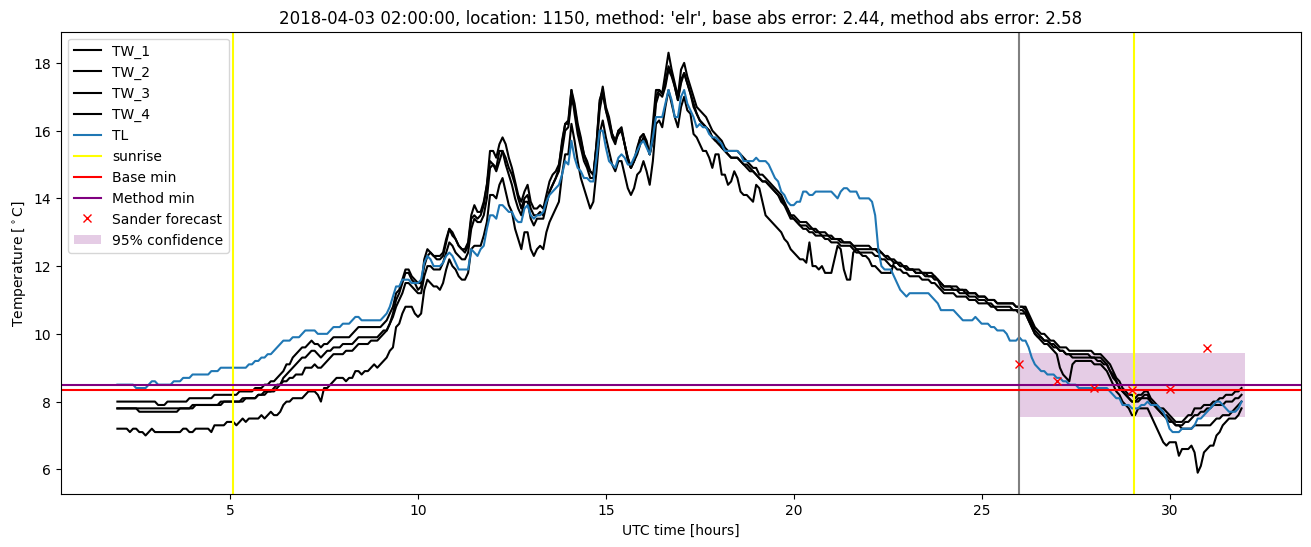
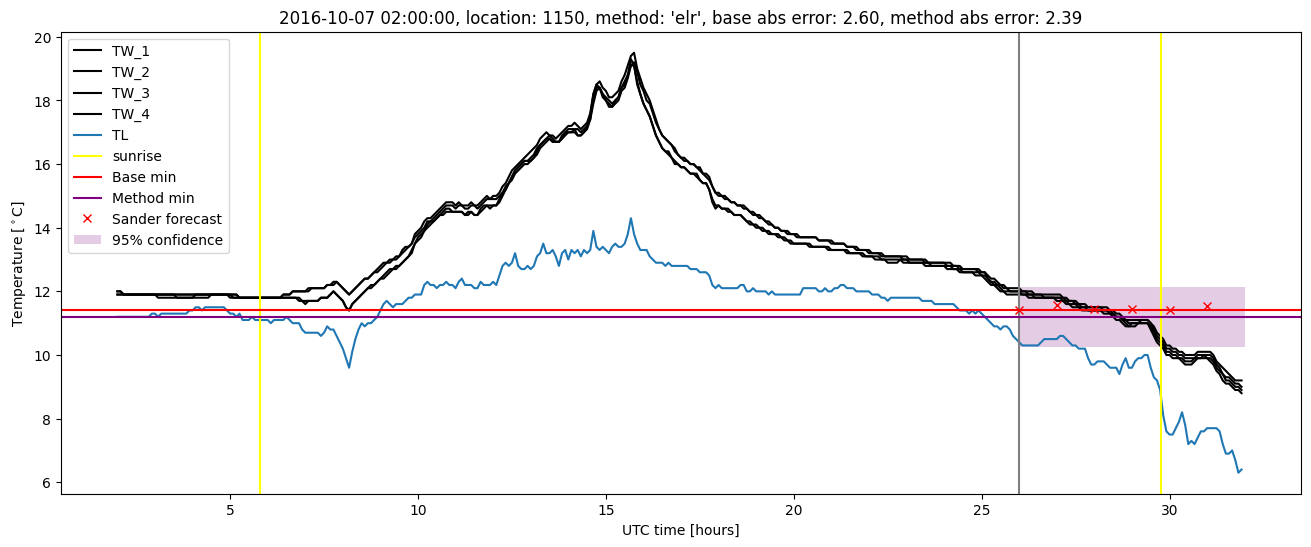
Extended logistic regression results
| names |
period |
power |
significance |
meanSquareError |
absError |
maxError |
CRPS |
IGN |
| baseline |
winter 2016 |
0.994 |
0.094 |
0.387 |
0.460 |
2.200 |
NaN |
NaN |
| elr |
winter 2016 |
0.994 |
0.031 |
0.371 |
0.477 |
1.954 |
0.628 |
4.114 |
| baseline |
winter 2017 |
0.983 |
0.057 |
0.544 |
0.528 |
2.599 |
NaN |
NaN |
| elr |
winter 2017 |
0.983 |
0.000e+00 |
0.440 |
0.496 |
2.393 |
0.548 |
3.635 |
| baseline |
winter 2018 |
0.985 |
0.130 |
0.425 |
0.462 |
2.563 |
NaN |
NaN |
| elr |
winter 2018 |
0.978 |
0.087 |
0.405 |
0.471 |
2.579 |
0.587 |
3.888 |
| baseline |
winter 2019 |
0.986 |
0.000e+00 |
0.365 |
0.424 |
2.461 |
NaN |
NaN |
| elr |
winter 2019 |
0.993 |
0.000e+00 |
0.304 |
0.404 |
2.751 |
0.522 |
2.821 |
| baseline |
all |
0.988 |
0.087 |
0.427 |
0.468 |
2.599 |
NaN |
NaN |
| elr |
all |
0.988 |
0.040 |
0.380 |
0.464 |
2.751 |
0.576 |
3.666 |
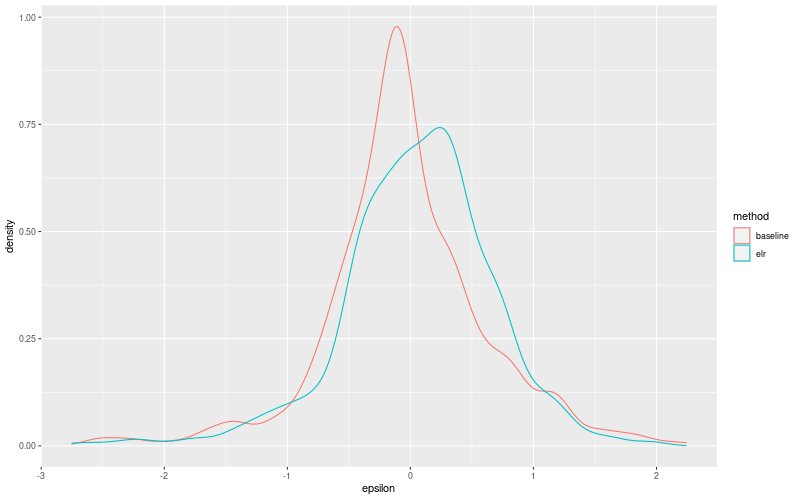
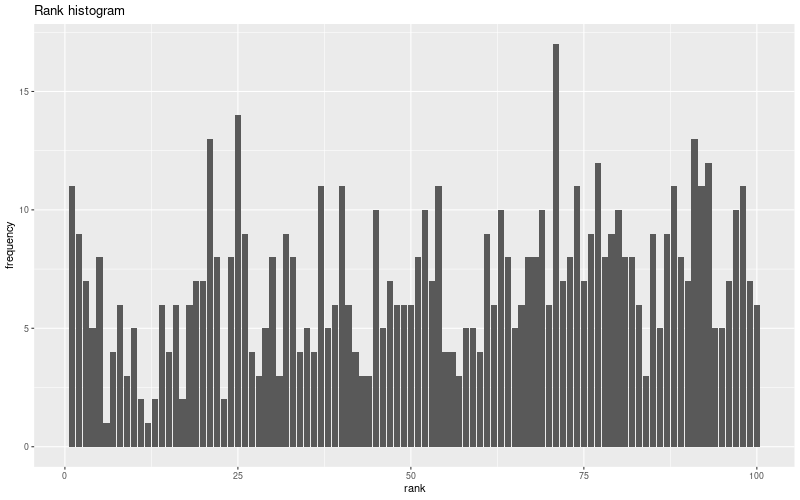
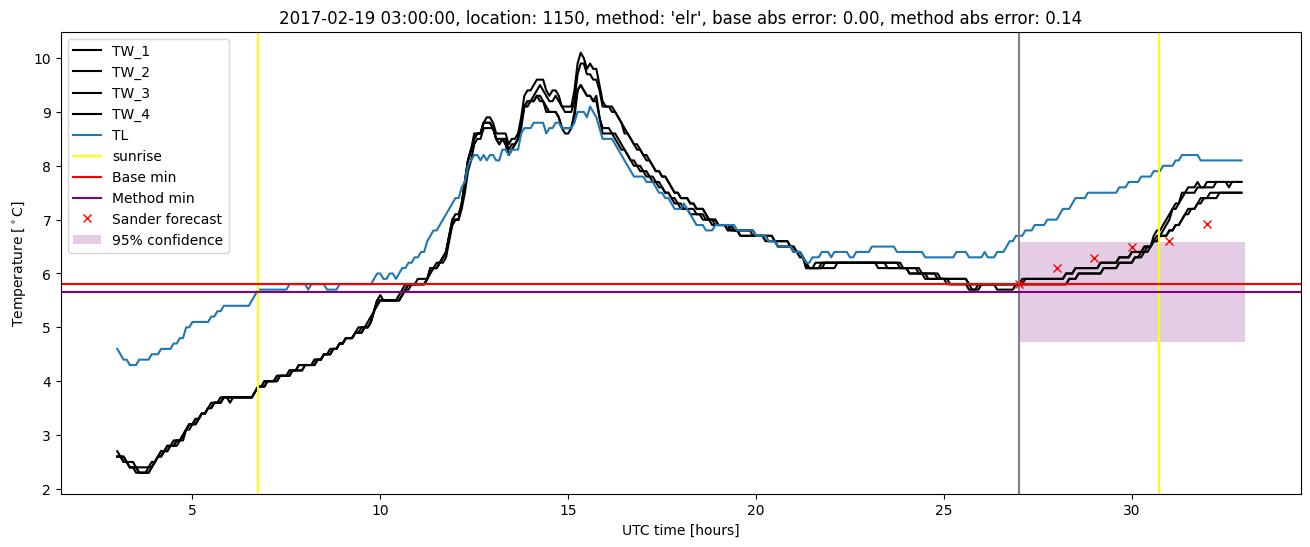
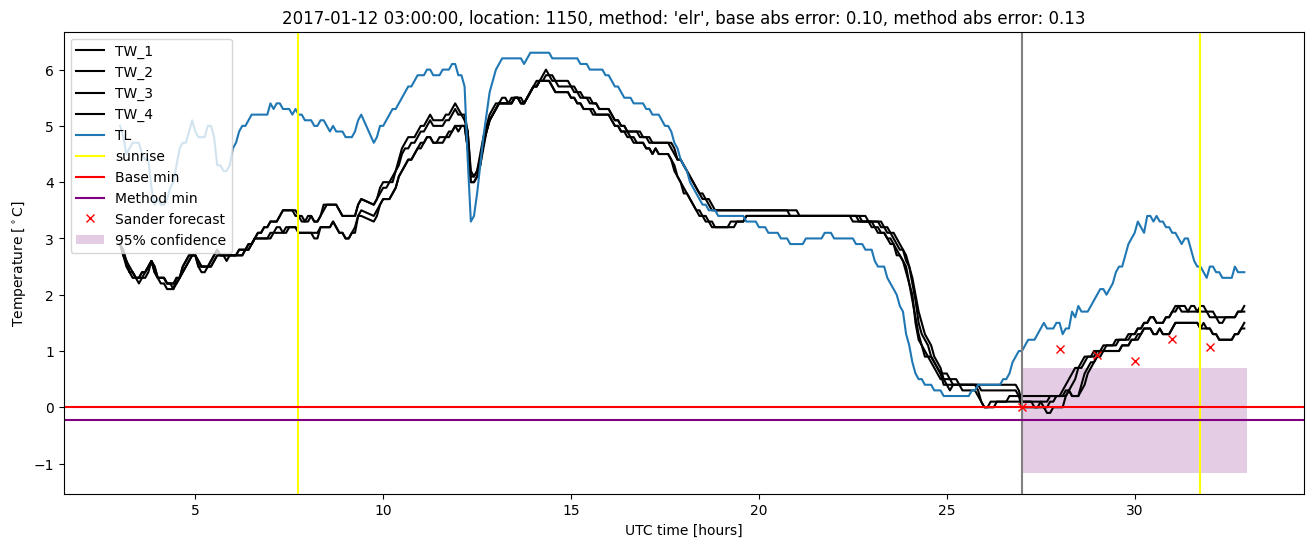
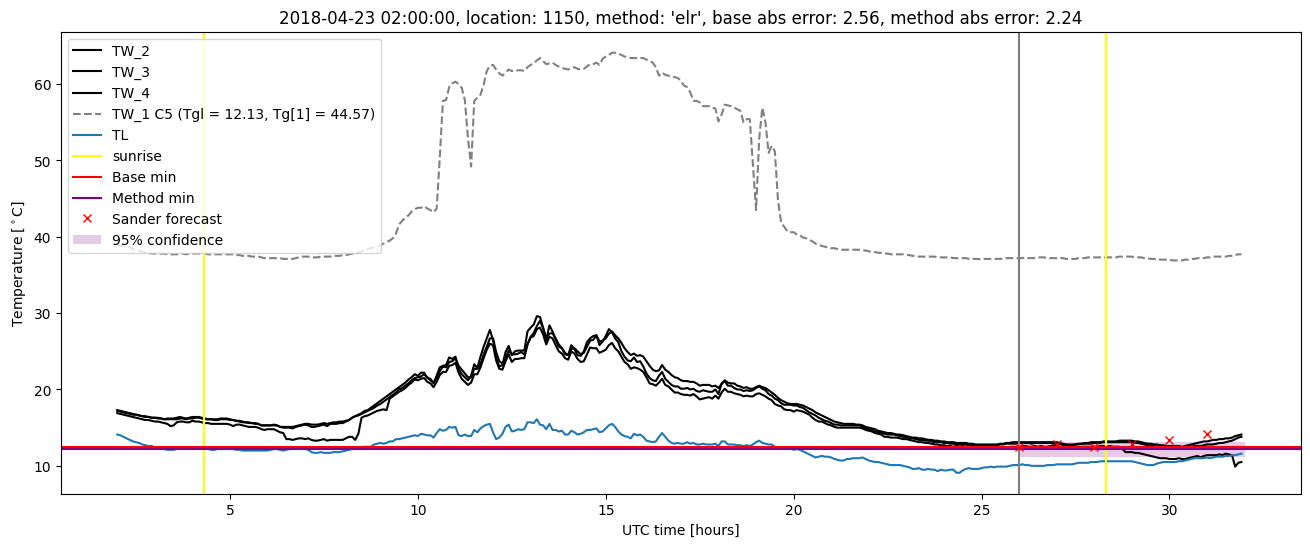
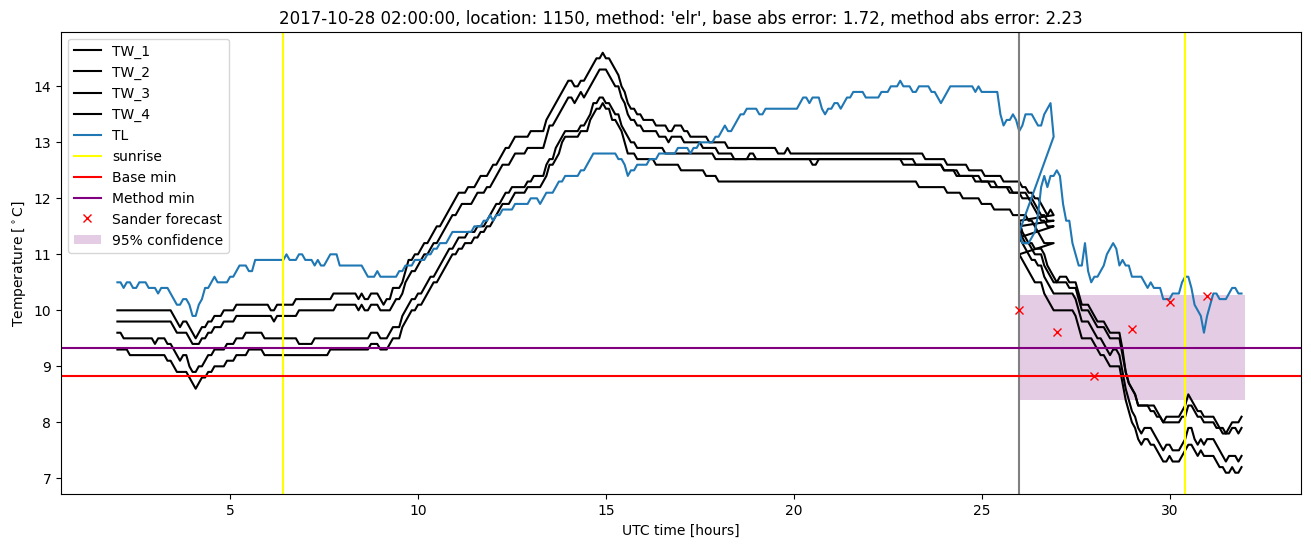
Extended logistic regression plots