GMS location: 113
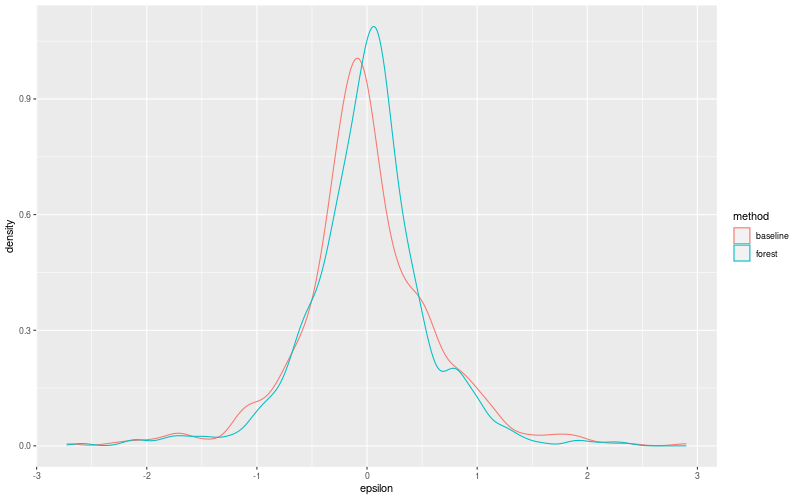
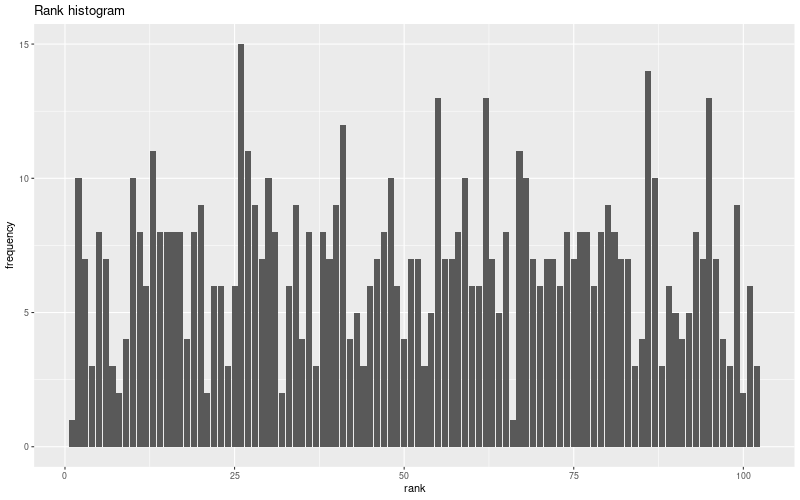
Random forest results
| names |
period |
power |
significance |
meanSquareError |
absError |
maxError |
CRPS |
IGN |
| baseline |
winter 2016 |
0.988 |
0.036 |
0.325 |
0.419 |
1.949 |
NaN |
NaN |
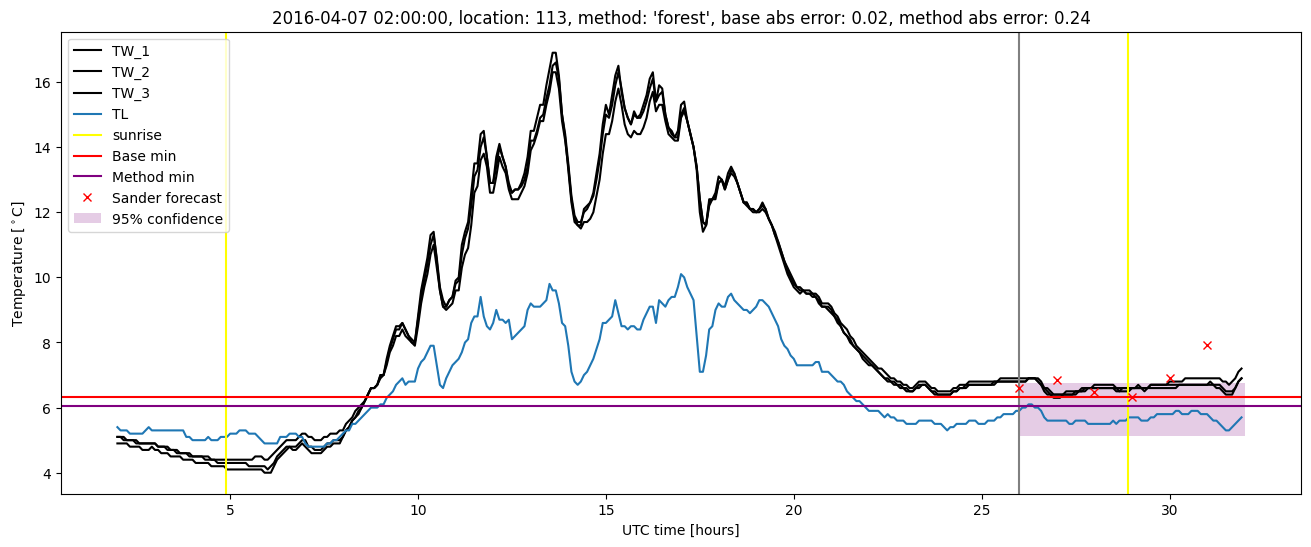
| forest |
winter 2016 |
0.977 |
0.000e+00 |
0.271 |
0.371 |
2.151 |
0.504 |
3.589 |
| baseline |
winter 2017 |
0.974 |
0.125 |
0.495 |
0.466 |
2.896 |
NaN |
NaN |
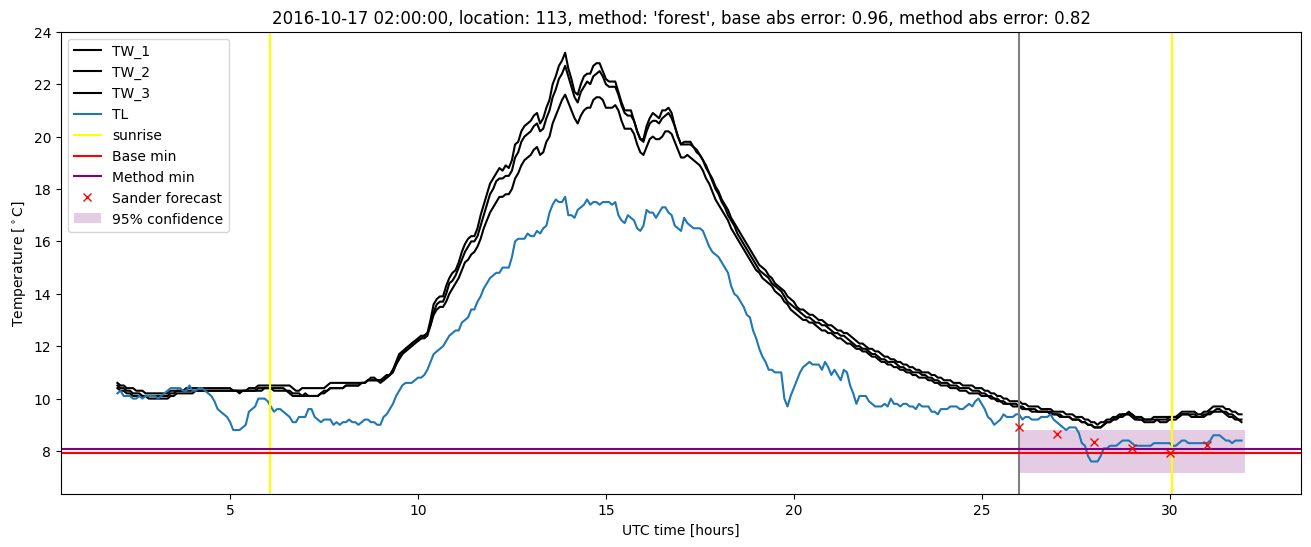
| forest |
winter 2017 |
0.982 |
0.100 |
0.385 |
0.421 |
2.330 |
0.504 |
3.916 |
| baseline |
winter 2018 |
0.973 |
0.062 |
0.399 |
0.442 |
2.724 |
NaN |
NaN |
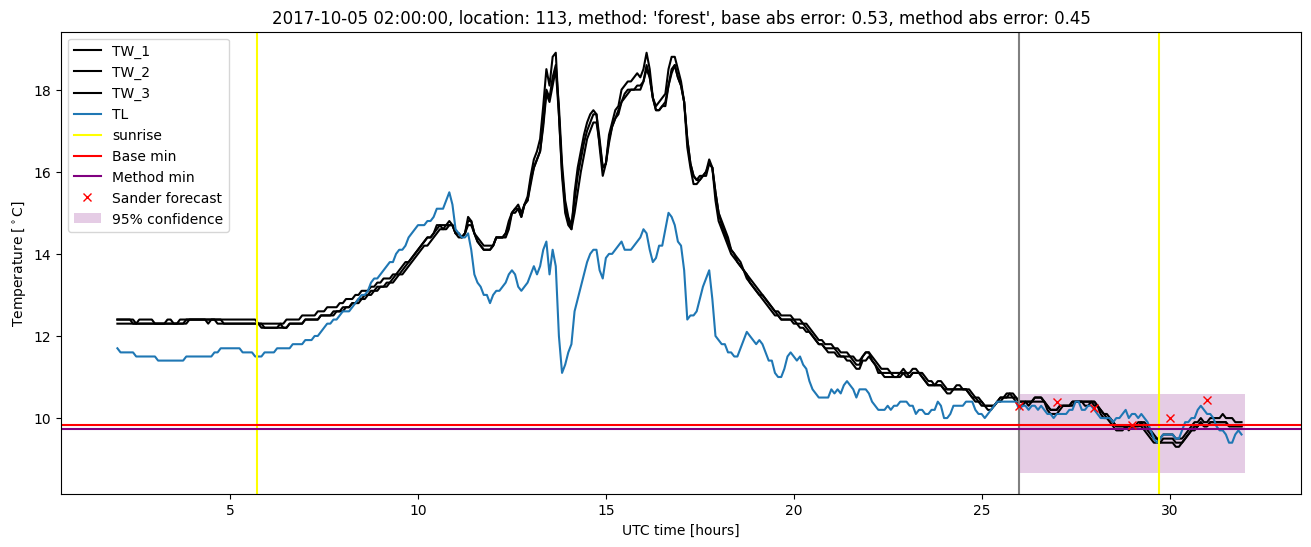
| forest |
winter 2018 |
0.960 |
0.031 |
0.313 |
0.381 |
2.593 |
0.499 |
3.626 |
| baseline |
winter 2019 |
0.987 |
0.077 |
0.340 |
0.433 |
1.885 |
NaN |
NaN |
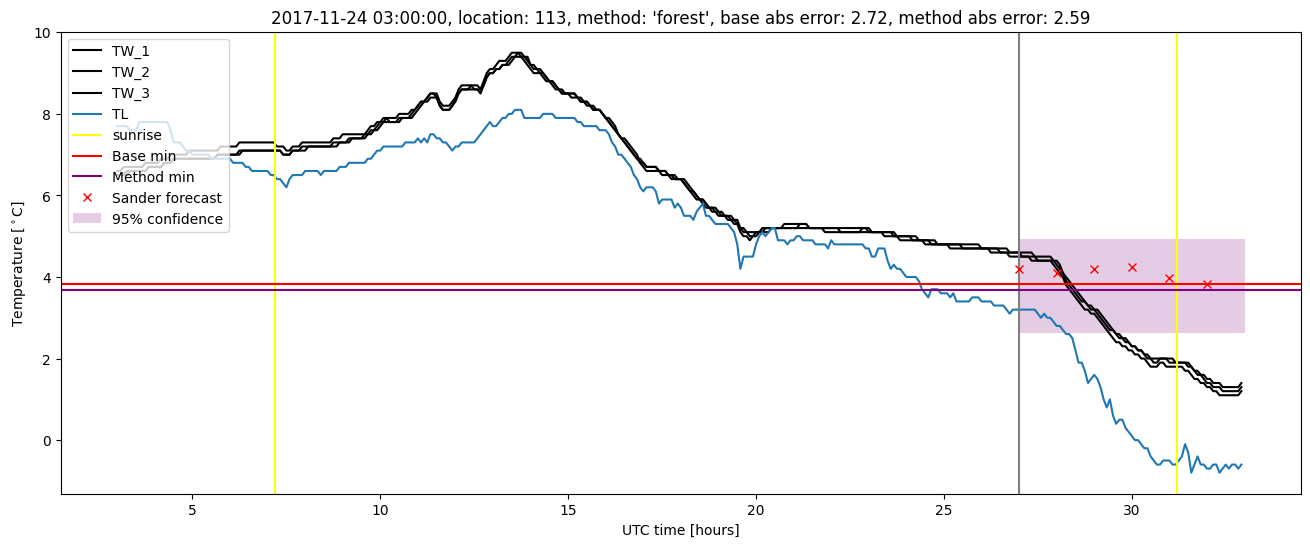
| forest |
winter 2019 |
0.993 |
0.000e+00 |
0.245 |
0.376 |
1.315 |
0.491 |
3.572 |
| baseline |
all |
0.981 |
0.080 |
0.385 |
0.438 |
2.896 |
NaN |
NaN |
| forest |
all |
0.978 |
0.044 |
0.301 |
0.386 |
2.593 |
0.499 |
3.666 |
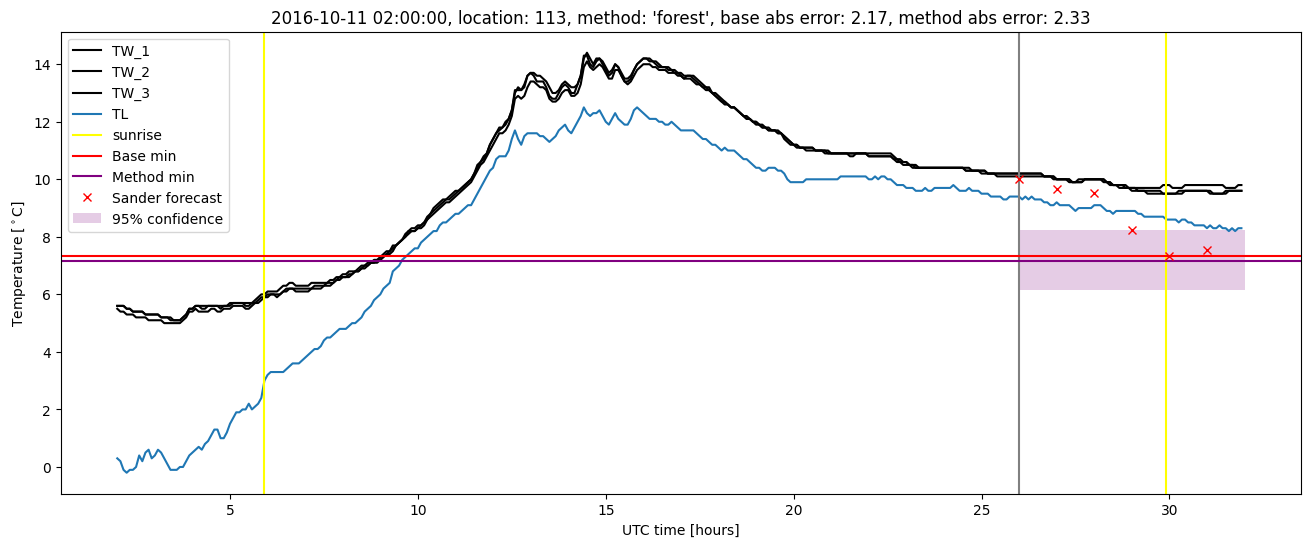
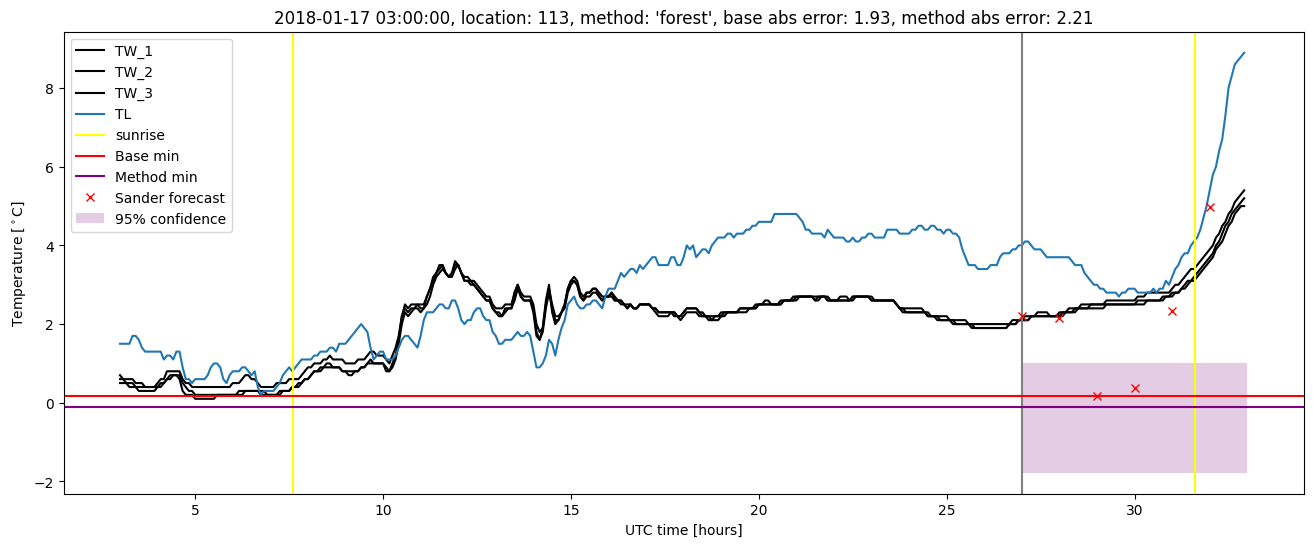
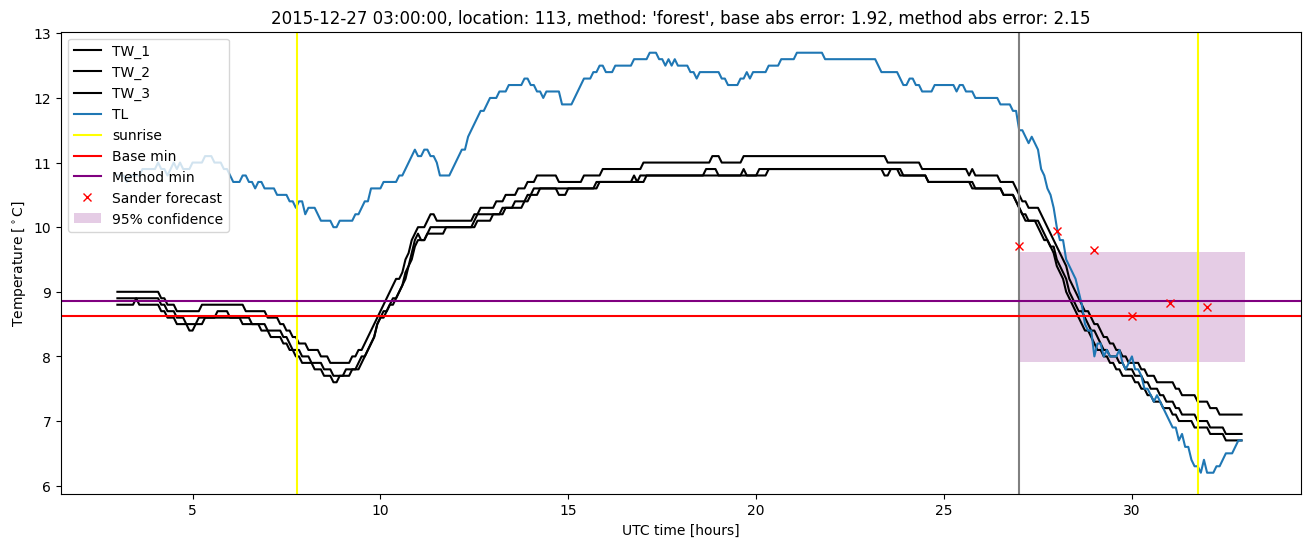
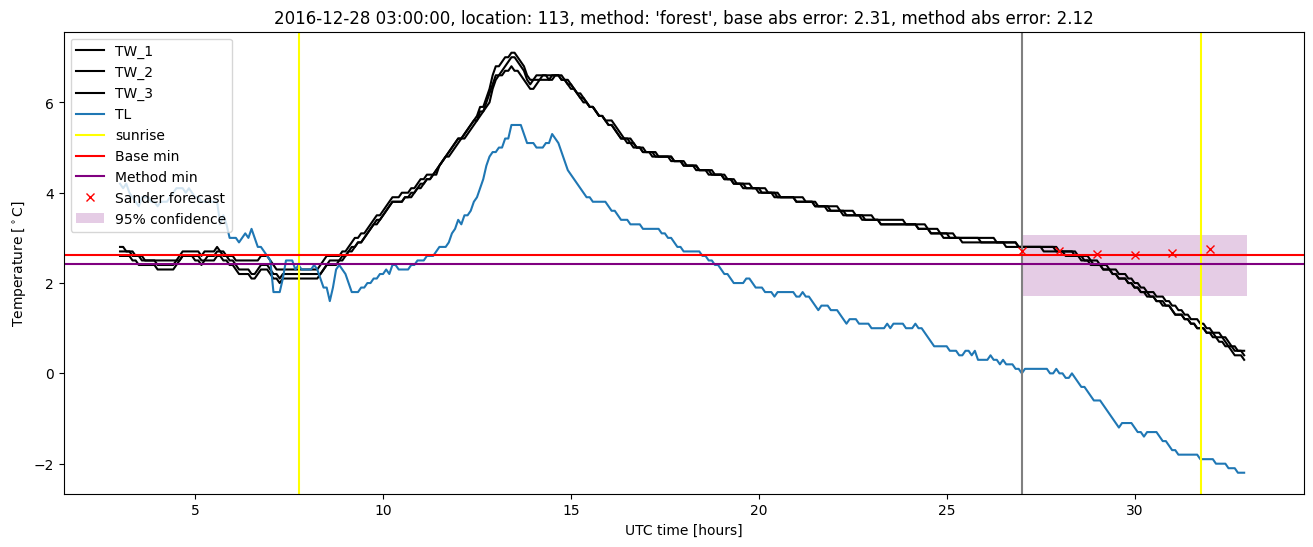
Random forest plots
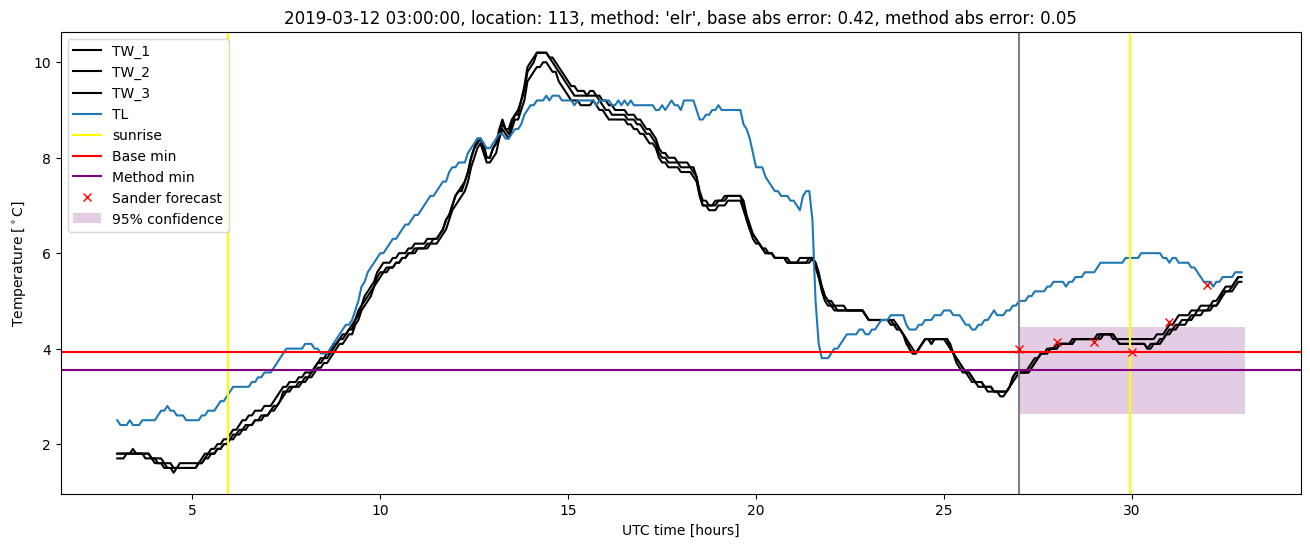
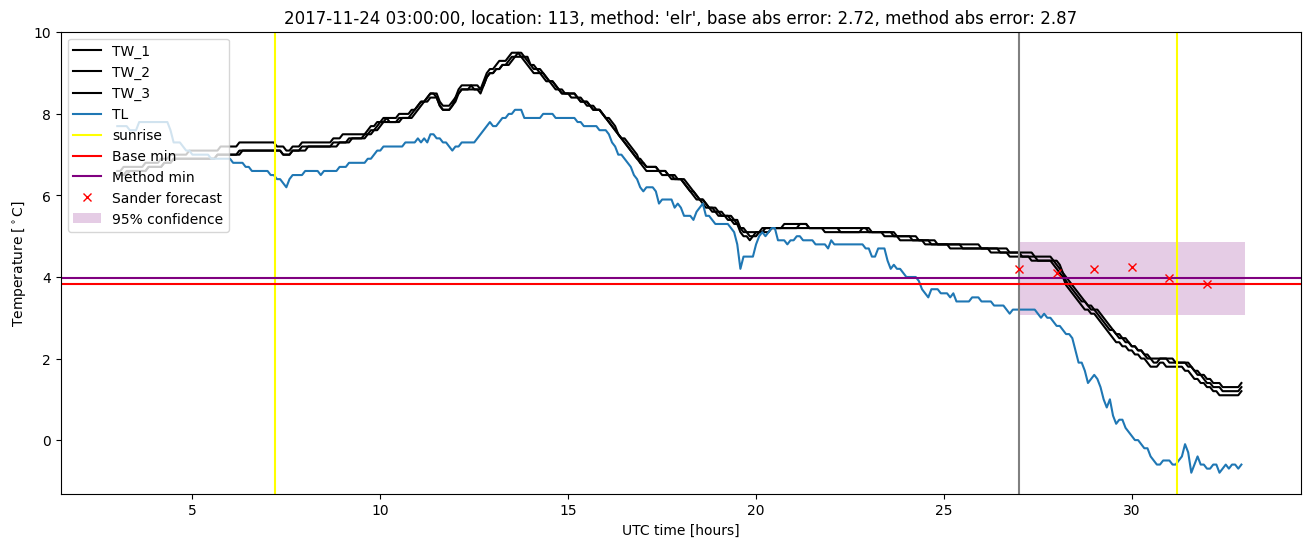
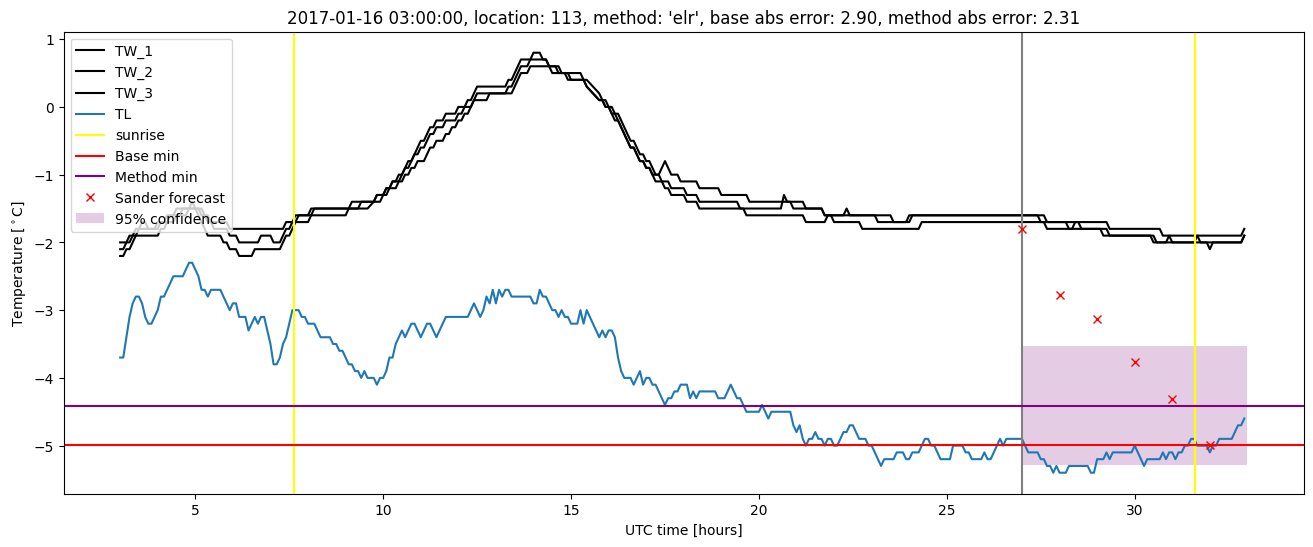
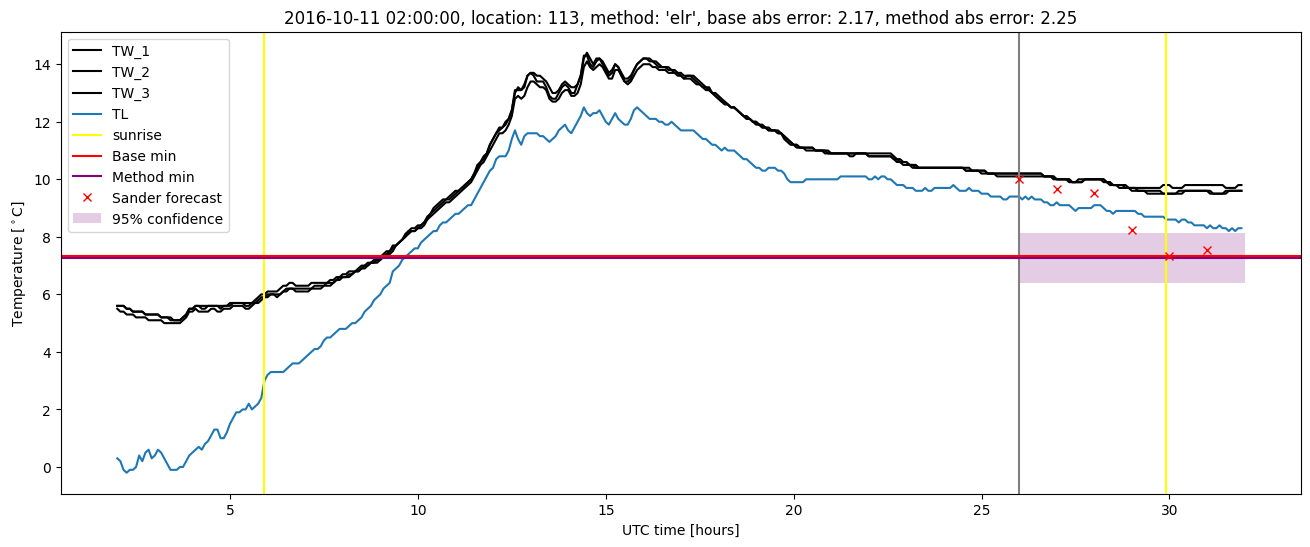
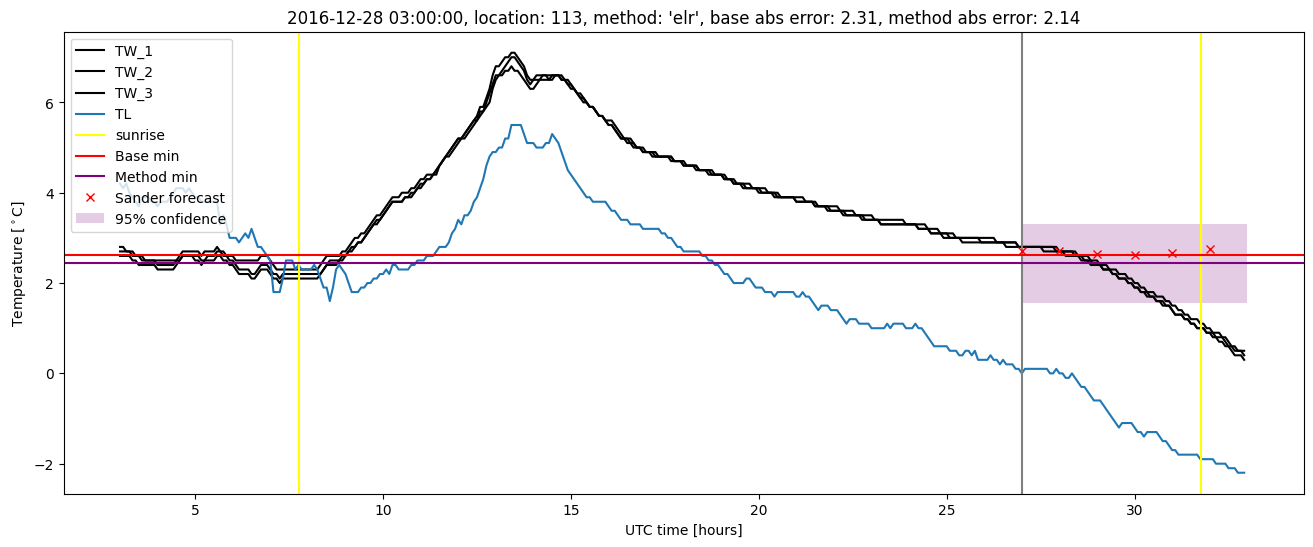
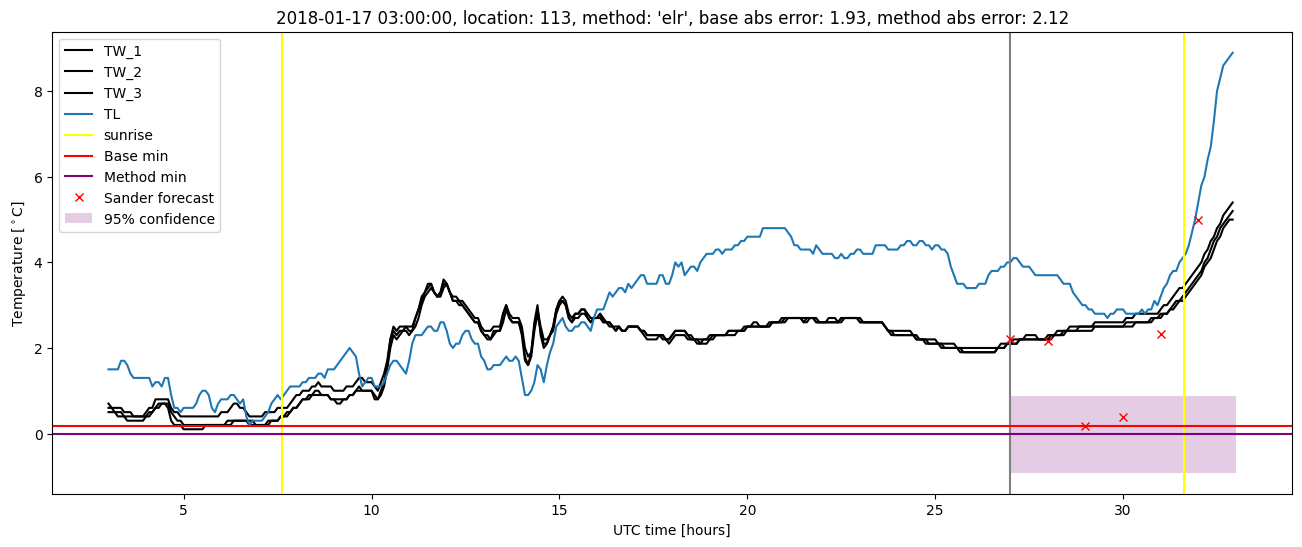
Extended logistic regression results
| names |
period |
power |
significance |
meanSquareError |
absError |
maxError |
CRPS |
IGN |
| baseline |
winter 2016 |
0.988 |
0.036 |
0.325 |
0.419 |
1.949 |
NaN |
NaN |
| elr |
winter 2016 |
0.988 |
0.000e+00 |
0.301 |
0.423 |
2.016 |
0.595 |
4.625 |
| baseline |
winter 2017 |
0.974 |
0.125 |
0.495 |
0.466 |
2.896 |
NaN |
NaN |
| elr |
winter 2017 |
0.982 |
0.100 |
0.393 |
0.440 |
2.314 |
0.530 |
4.277 |
| baseline |
winter 2018 |
0.973 |
0.062 |
0.399 |
0.442 |
2.724 |
NaN |
NaN |
| elr |
winter 2018 |
0.973 |
0.031 |
0.346 |
0.399 |
2.872 |
0.564 |
4.299 |
| baseline |
winter 2019 |
0.987 |
0.077 |
0.340 |
0.433 |
1.885 |
NaN |
NaN |
| elr |
winter 2019 |
1.000 |
0.077 |
0.290 |
0.429 |
1.425 |
0.540 |
3.793 |
| baseline |
all |
0.981 |
0.080 |
0.385 |
0.438 |
2.896 |
NaN |
NaN |
| elr |
all |
0.986 |
0.053 |
0.331 |
0.422 |
2.872 |
0.560 |
4.271 |
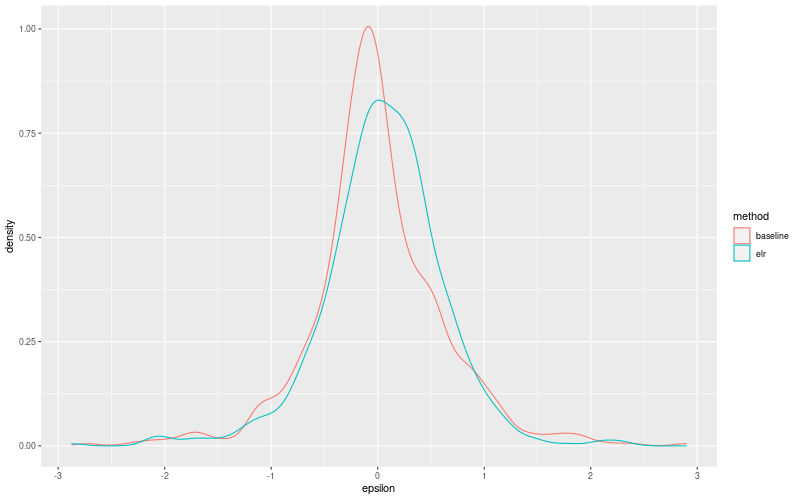
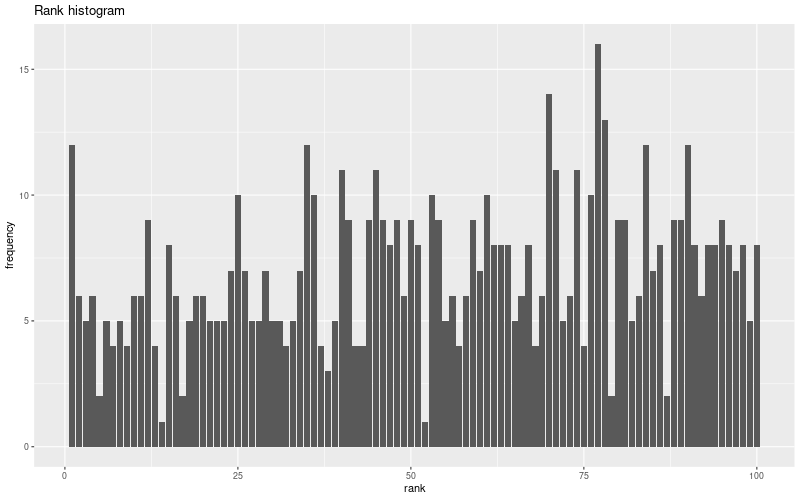
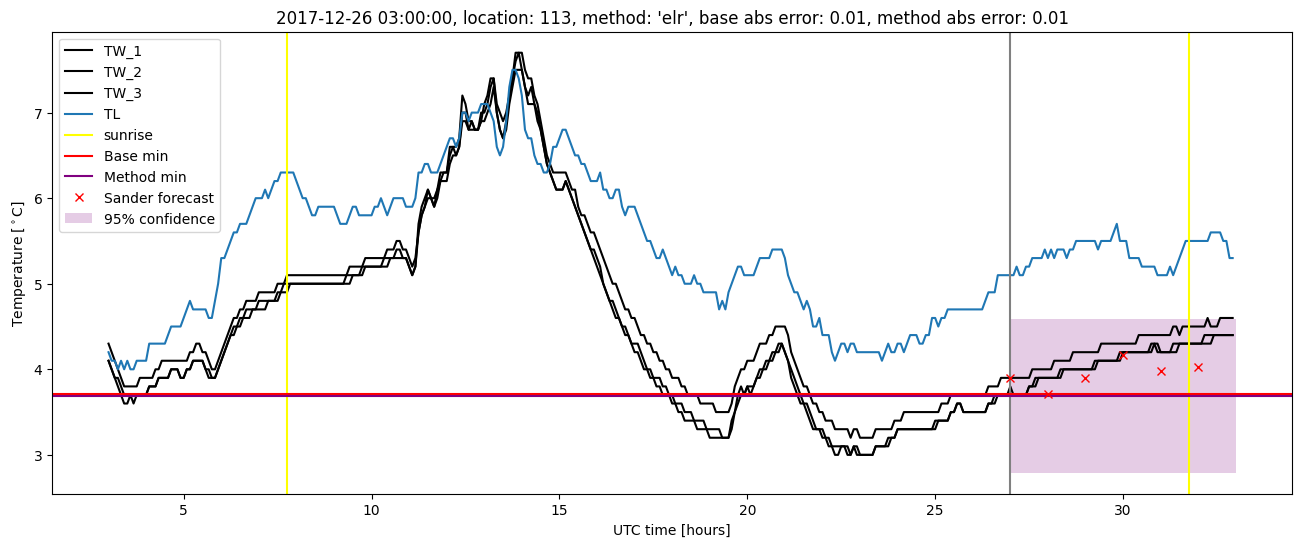
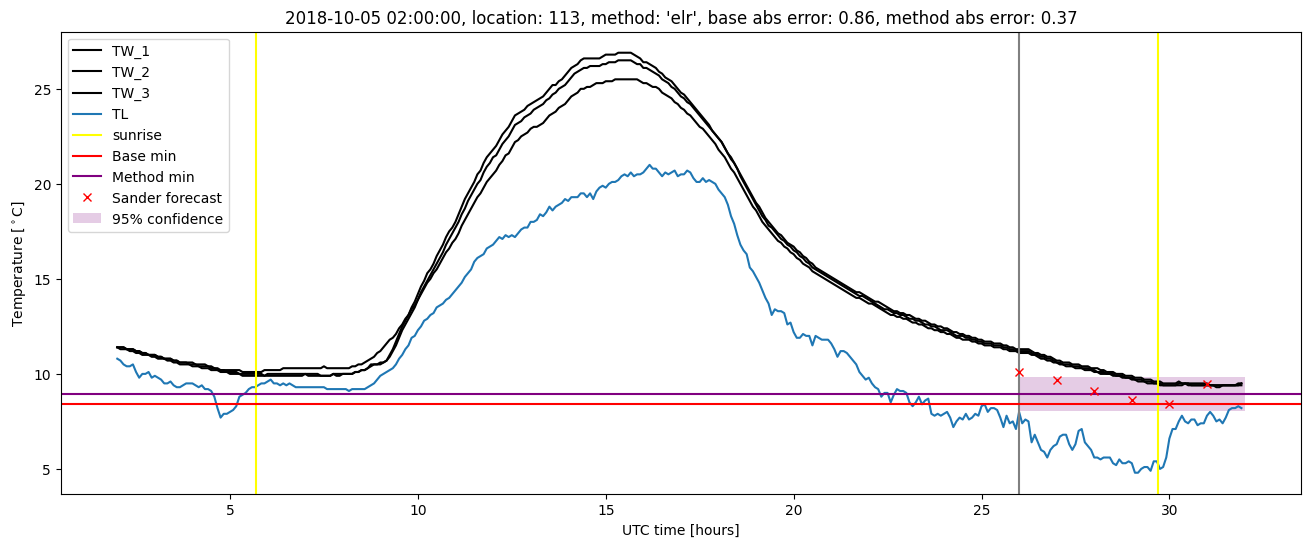
Extended logistic regression plots