GMS location: 112
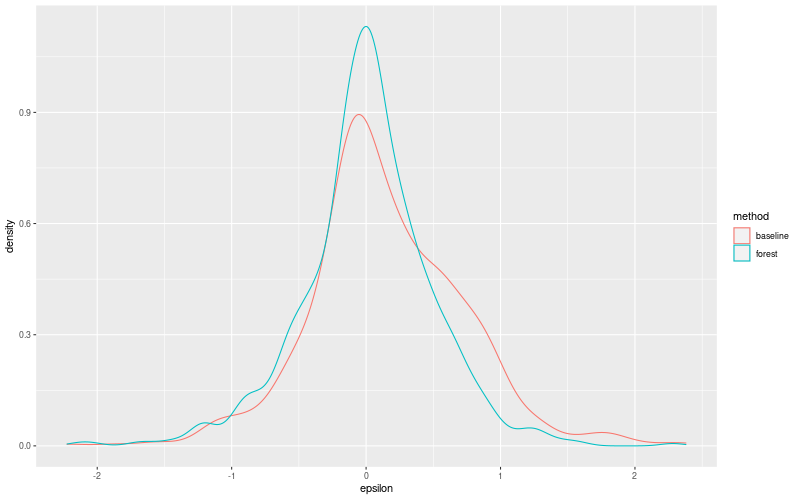
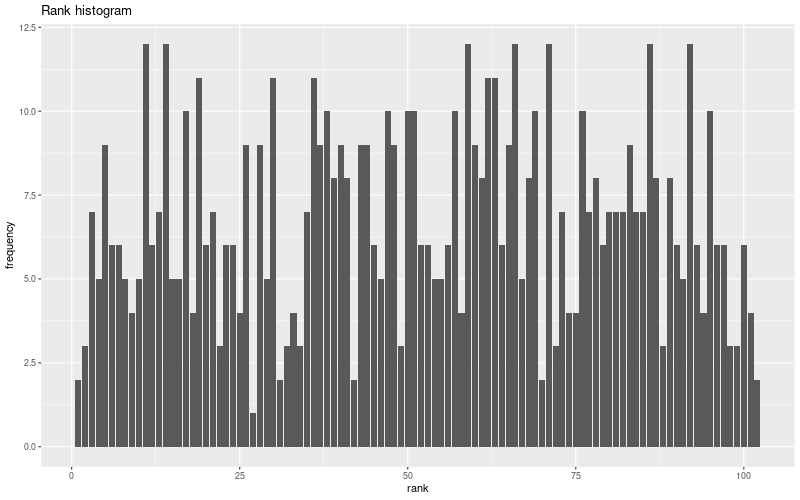
Random forest results
| names |
period |
power |
significance |
meanSquareError |
absError |
maxError |
CRPS |
IGN |
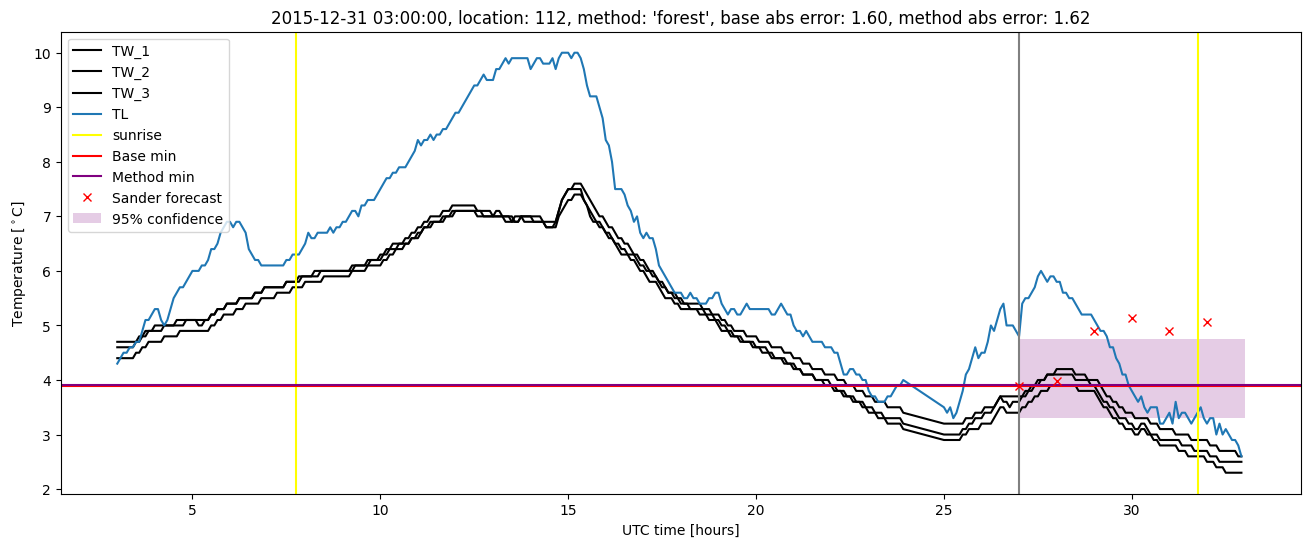
| baseline |
winter 2016 |
0.994 |
0.000e+00 |
0.296 |
0.405 |
1.788 |
NaN |
NaN |
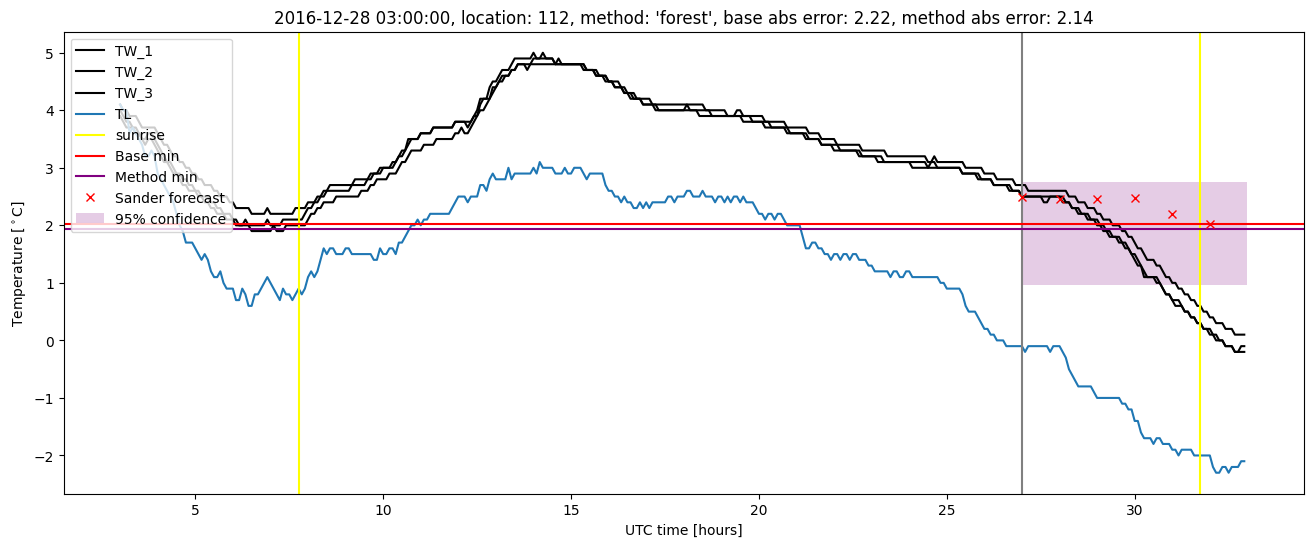
| forest |
winter 2016 |
1.000 |
0.000e+00 |
0.224 |
0.351 |
1.616 |
0.435 |
5.511 |
| baseline |
winter 2017 |
0.982 |
0.053 |
0.394 |
0.446 |
2.379 |
NaN |
NaN |
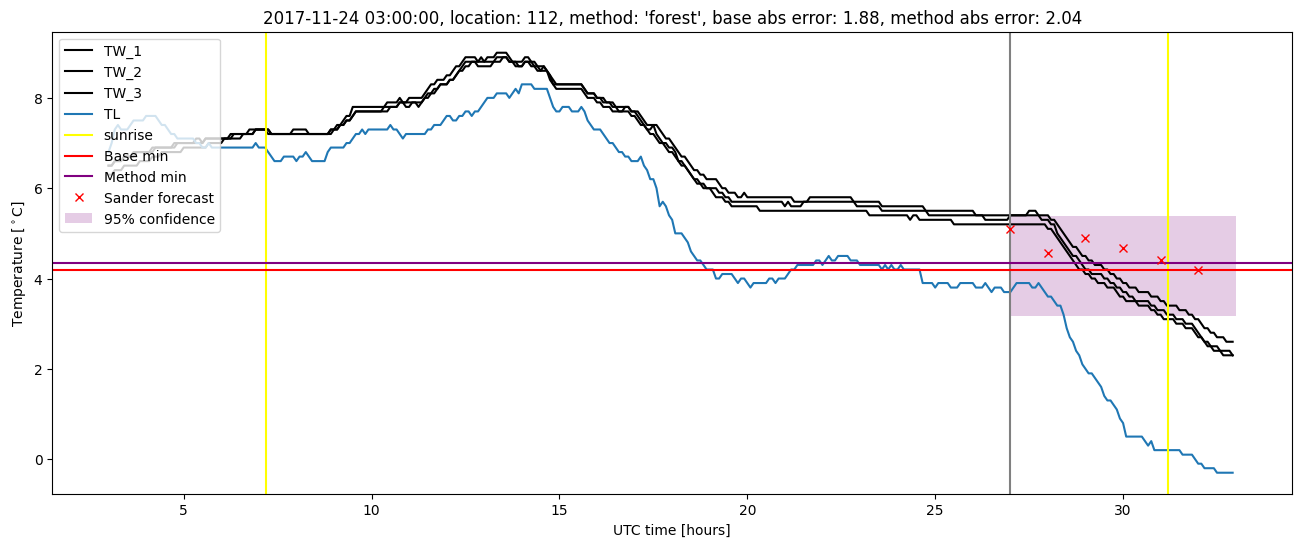
| forest |
winter 2017 |
0.982 |
0.053 |
0.269 |
0.372 |
2.142 |
0.444 |
6.088 |
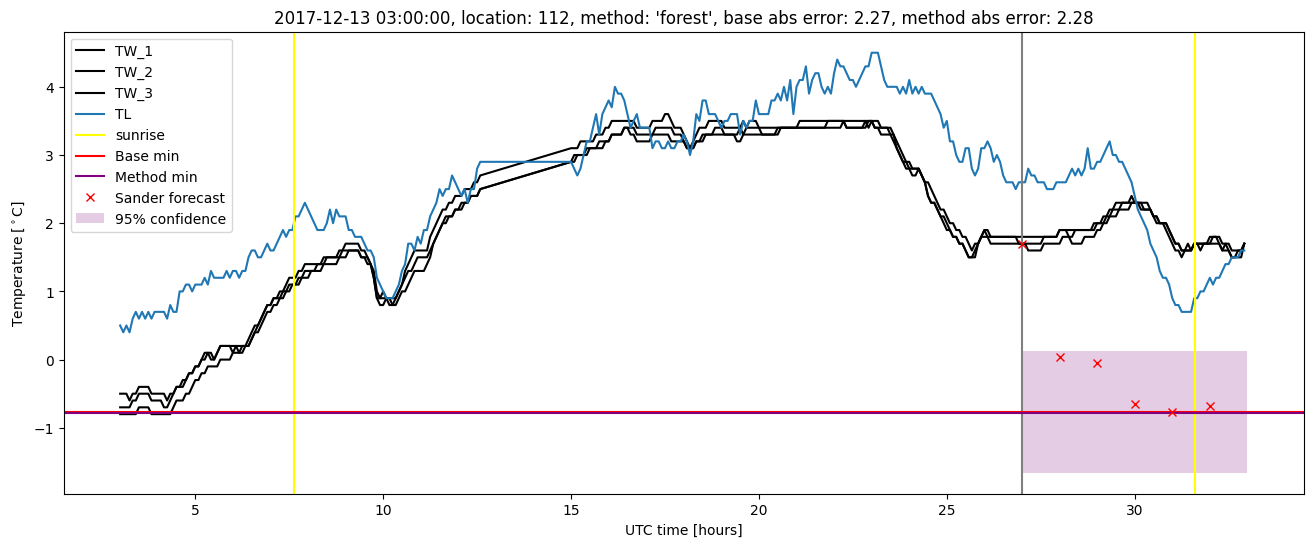
| baseline |
winter 2018 |
0.971 |
0.083 |
0.357 |
0.446 |
2.267 |
NaN |
NaN |
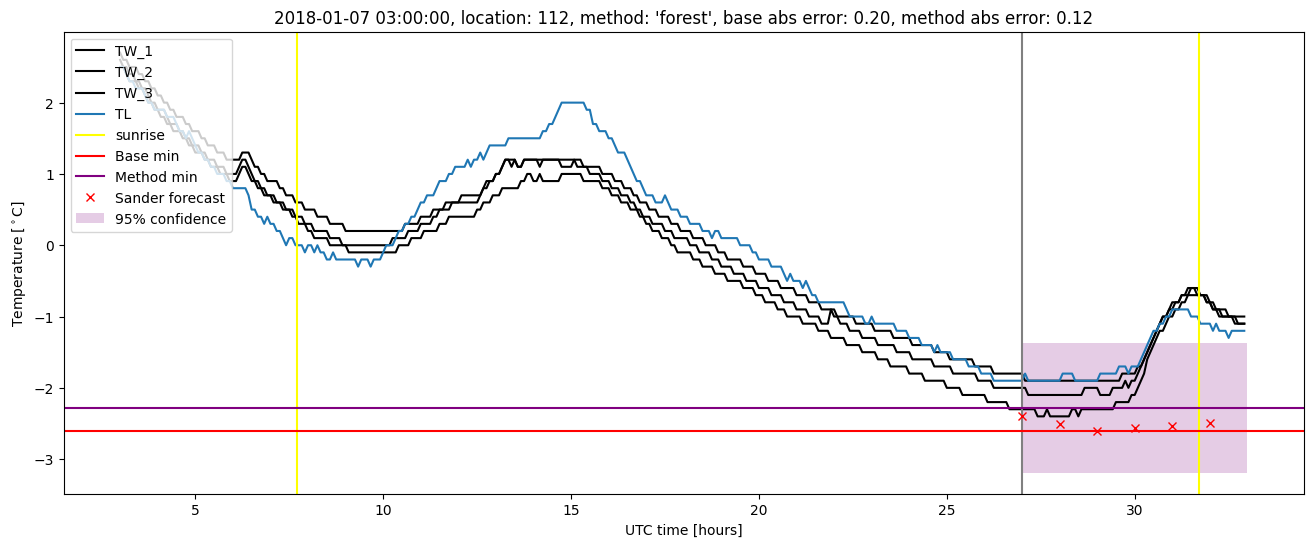
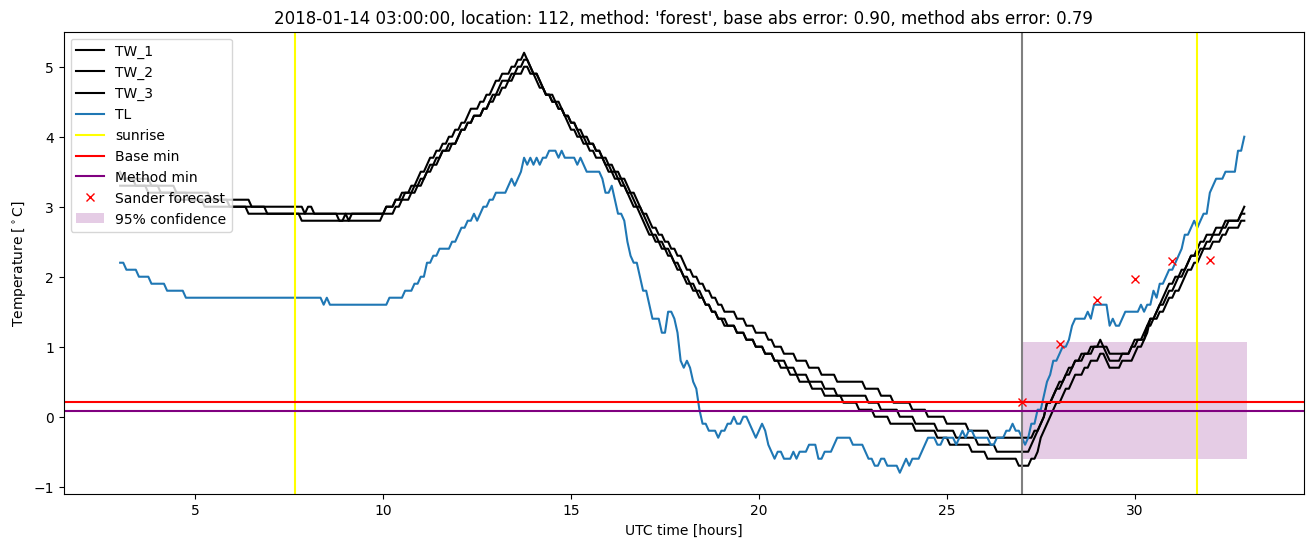
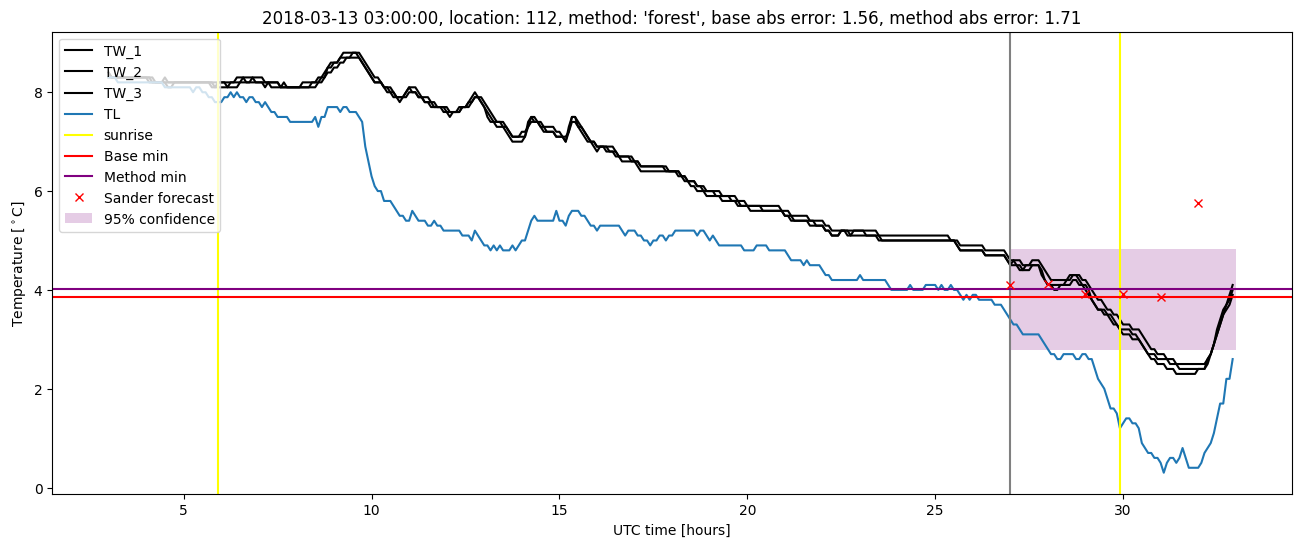
| forest |
winter 2018 |
0.964 |
0.083 |
0.249 |
0.350 |
2.282 |
0.428 |
5.419 |
| baseline |
winter 2019 |
0.987 |
0.000e+00 |
0.377 |
0.466 |
2.046 |
NaN |
NaN |
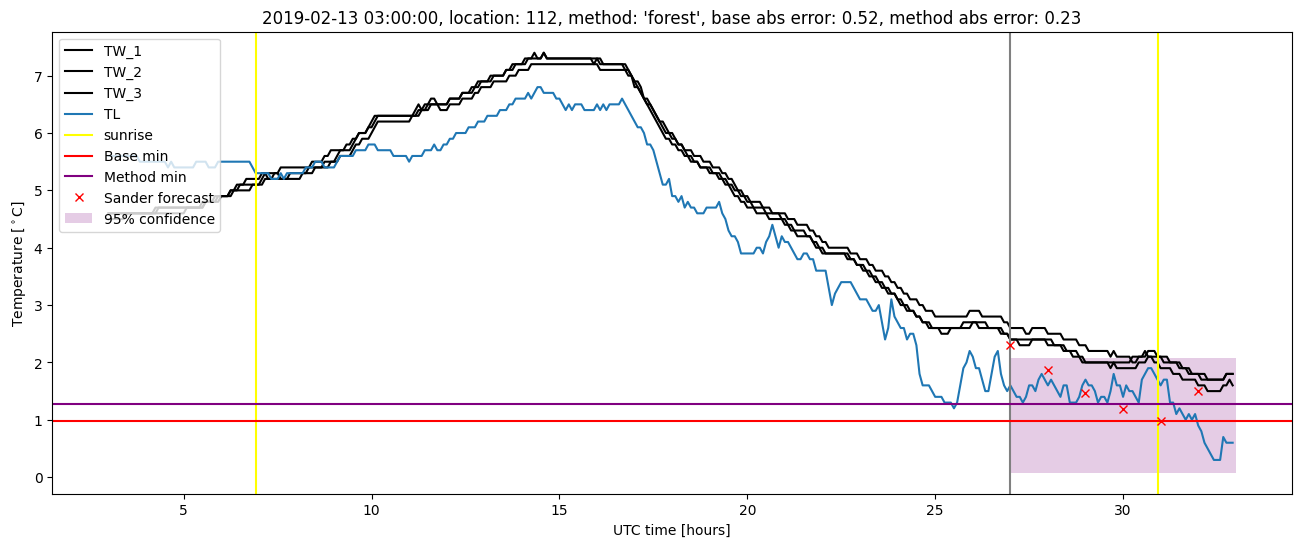
| forest |
winter 2019 |
0.987 |
0.000e+00 |
0.226 |
0.356 |
1.455 |
0.423 |
5.493 |
| baseline |
all |
0.984 |
0.044 |
0.352 |
0.439 |
2.379 |
NaN |
NaN |
| forest |
all |
0.984 |
0.044 |
0.241 |
0.357 |
2.282 |
0.432 |
5.607 |
Random forest plots
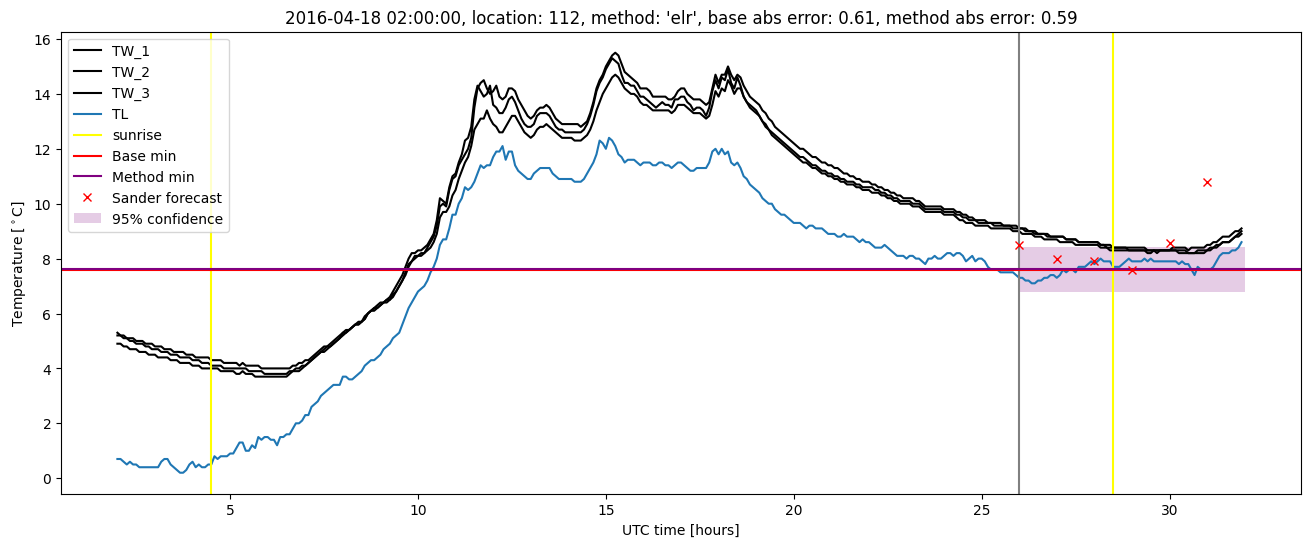
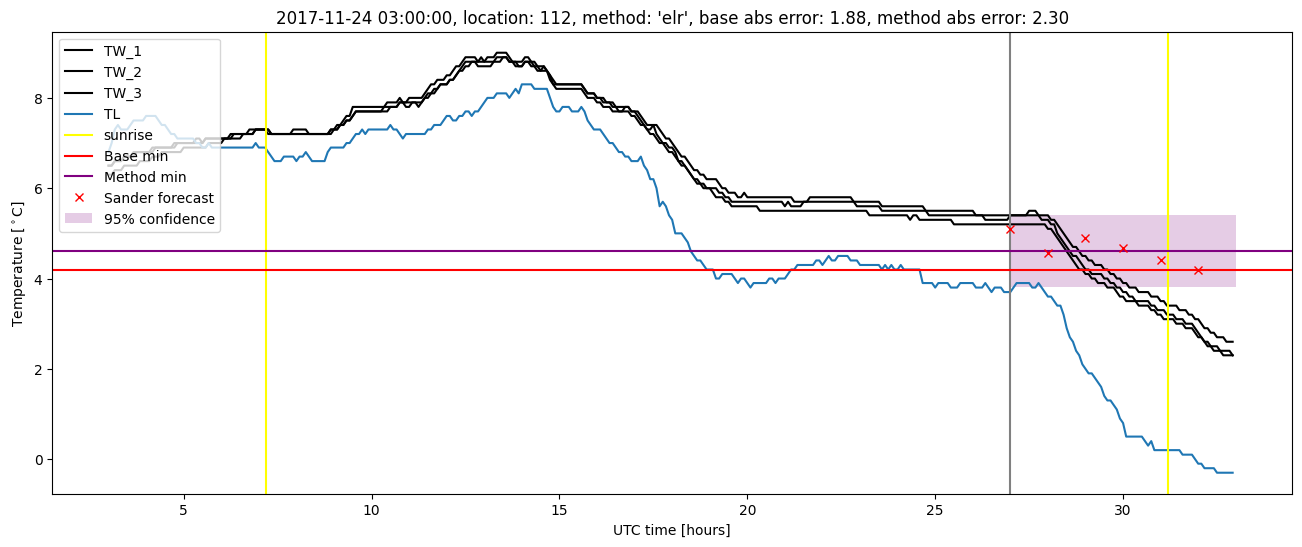
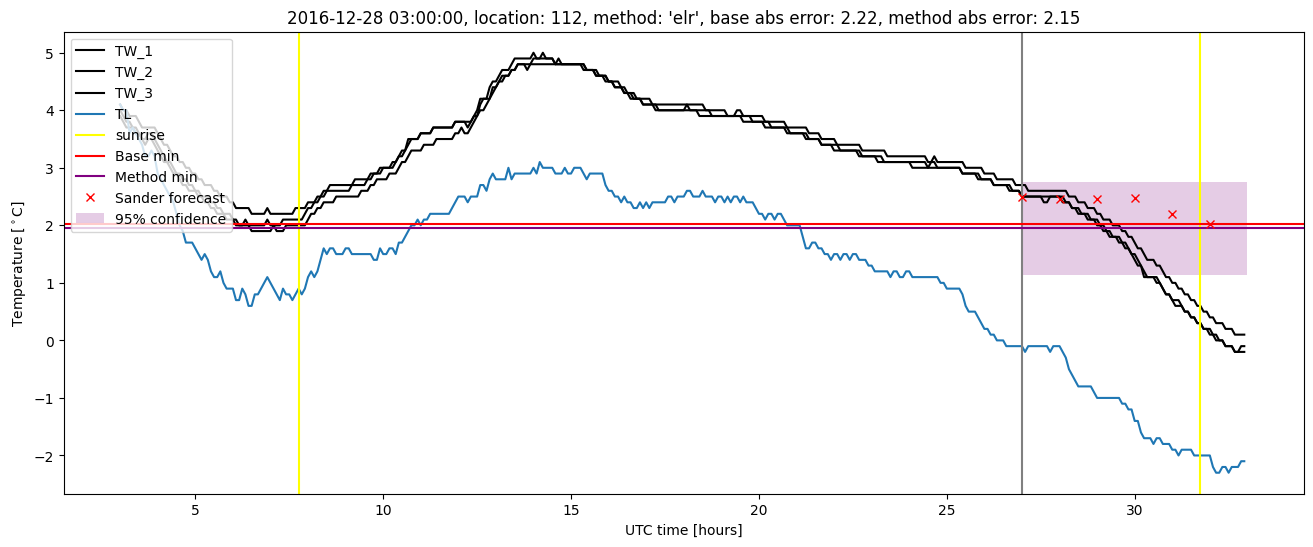
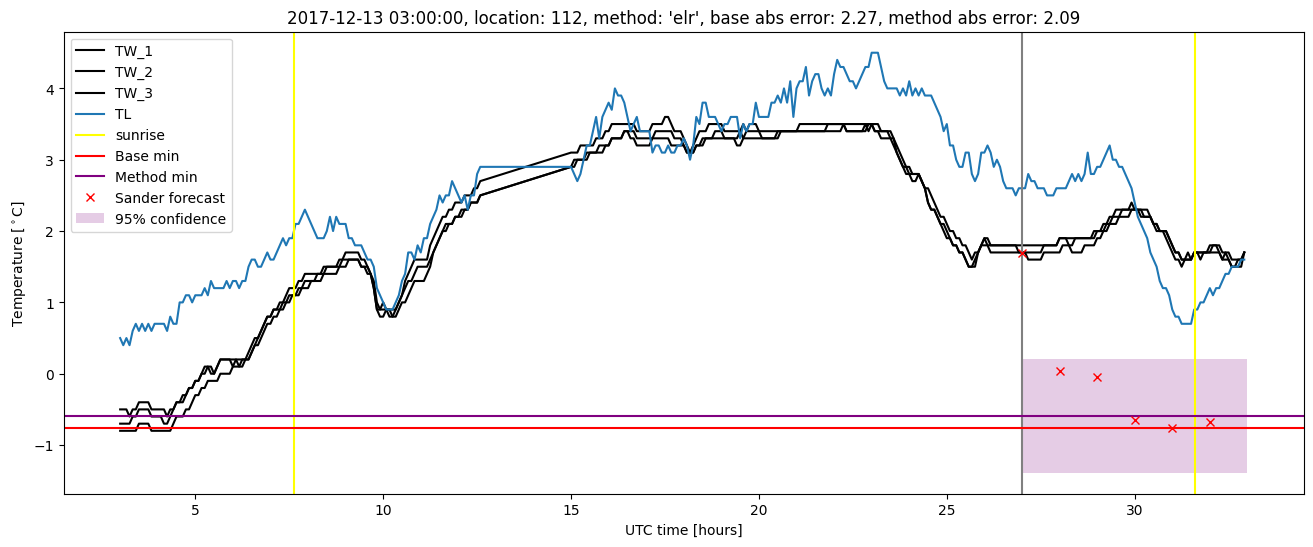
Extended logistic regression results
| names |
period |
power |
significance |
meanSquareError |
absError |
maxError |
CRPS |
IGN |
| baseline |
winter 2016 |
0.994 |
0.000e+00 |
0.296 |
0.405 |
1.788 |
NaN |
NaN |
| elr |
winter 2016 |
0.988 |
0.000e+00 |
0.260 |
0.393 |
1.567 |
0.496 |
4.717 |
| baseline |
winter 2017 |
0.982 |
0.053 |
0.394 |
0.446 |
2.379 |
NaN |
NaN |
| elr |
winter 2017 |
0.982 |
0.079 |
0.324 |
0.410 |
2.146 |
0.483 |
4.704 |
| baseline |
winter 2018 |
0.971 |
0.083 |
0.357 |
0.446 |
2.267 |
NaN |
NaN |
| elr |
winter 2018 |
0.971 |
0.083 |
0.310 |
0.409 |
2.304 |
0.498 |
5.054 |
| baseline |
winter 2019 |
0.987 |
0.000e+00 |
0.377 |
0.466 |
2.046 |
NaN |
NaN |
| elr |
winter 2019 |
1.000 |
0.000e+00 |
0.242 |
0.368 |
1.600 |
0.477 |
3.801 |
| baseline |
all |
0.984 |
0.044 |
0.352 |
0.439 |
2.379 |
NaN |
NaN |
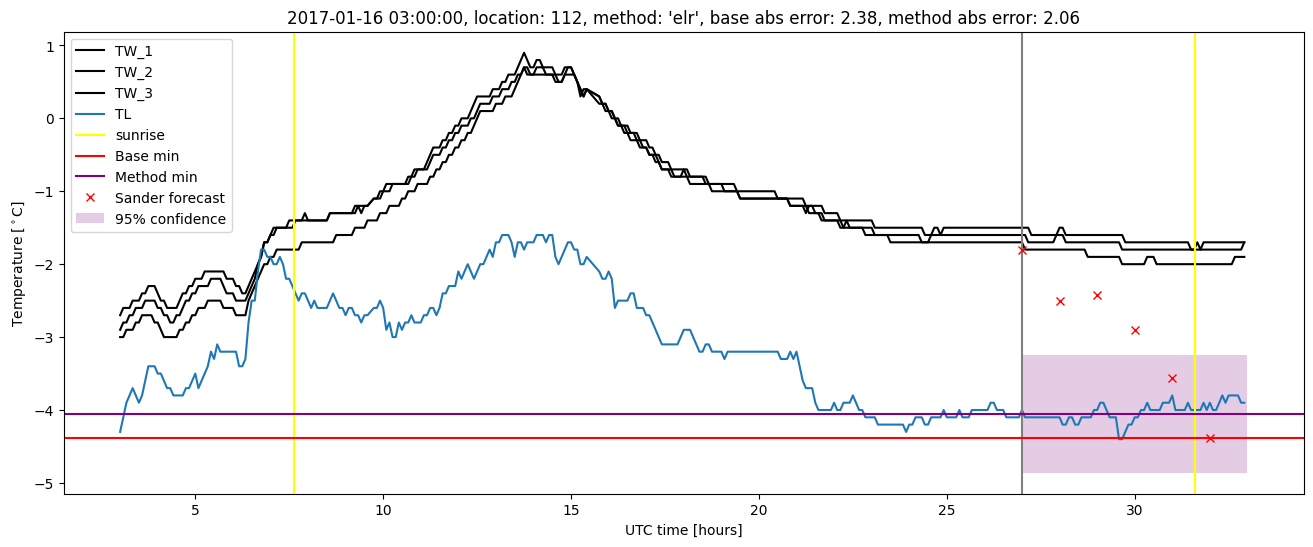
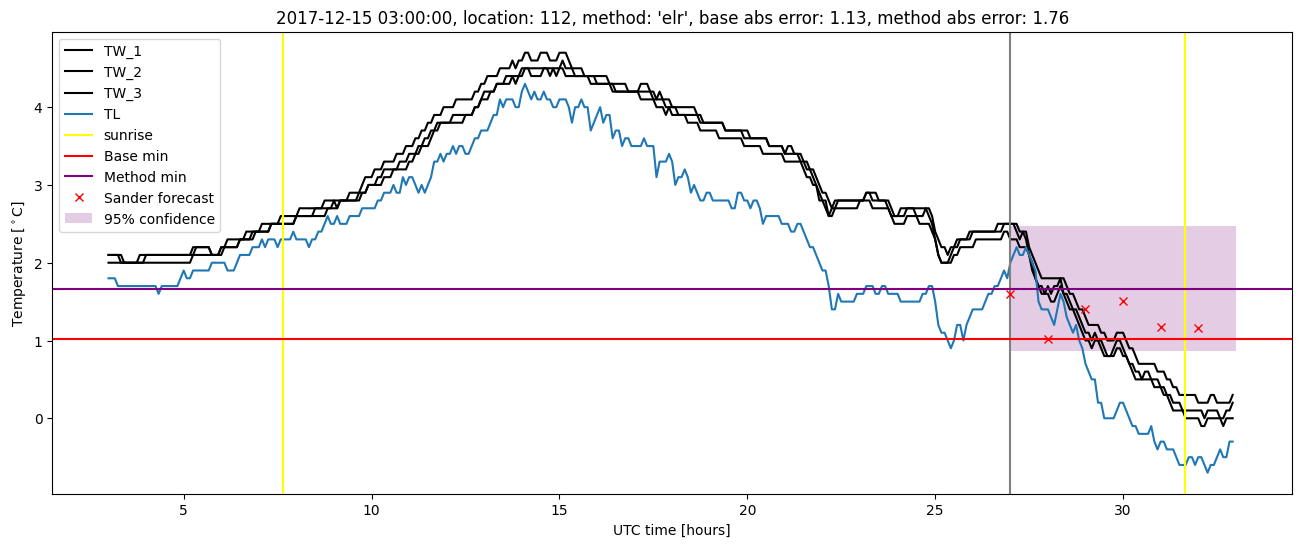
| elr |
all |
0.986 |
0.053 |
0.282 |
0.395 |
2.304 |
0.489 |
4.579 |
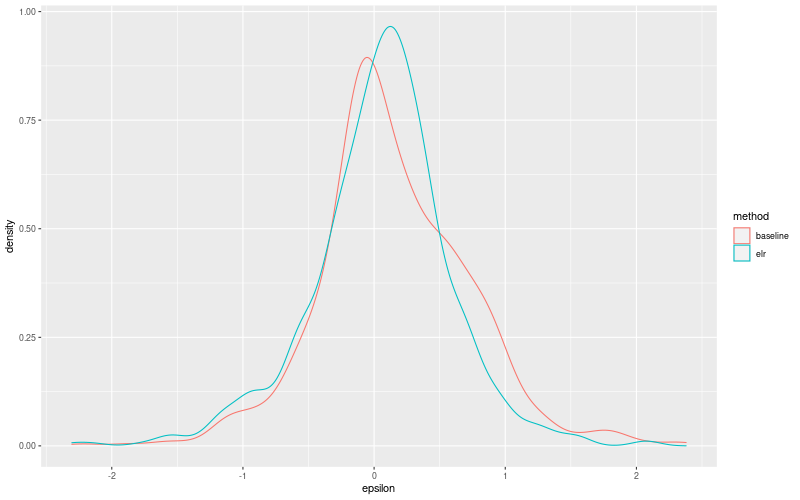
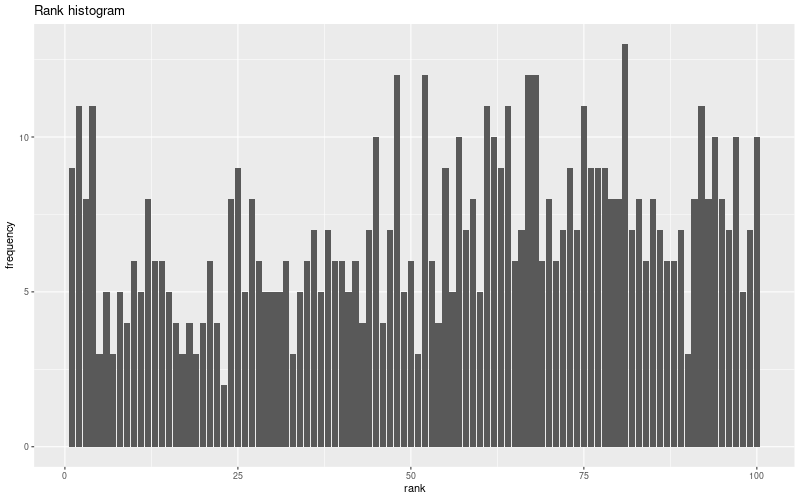
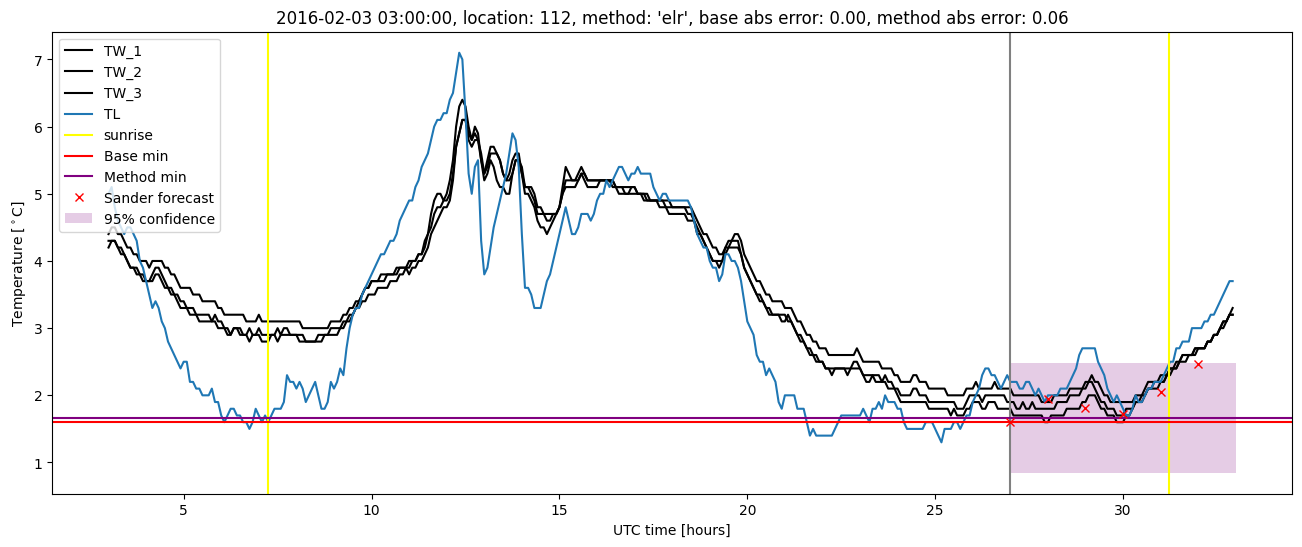
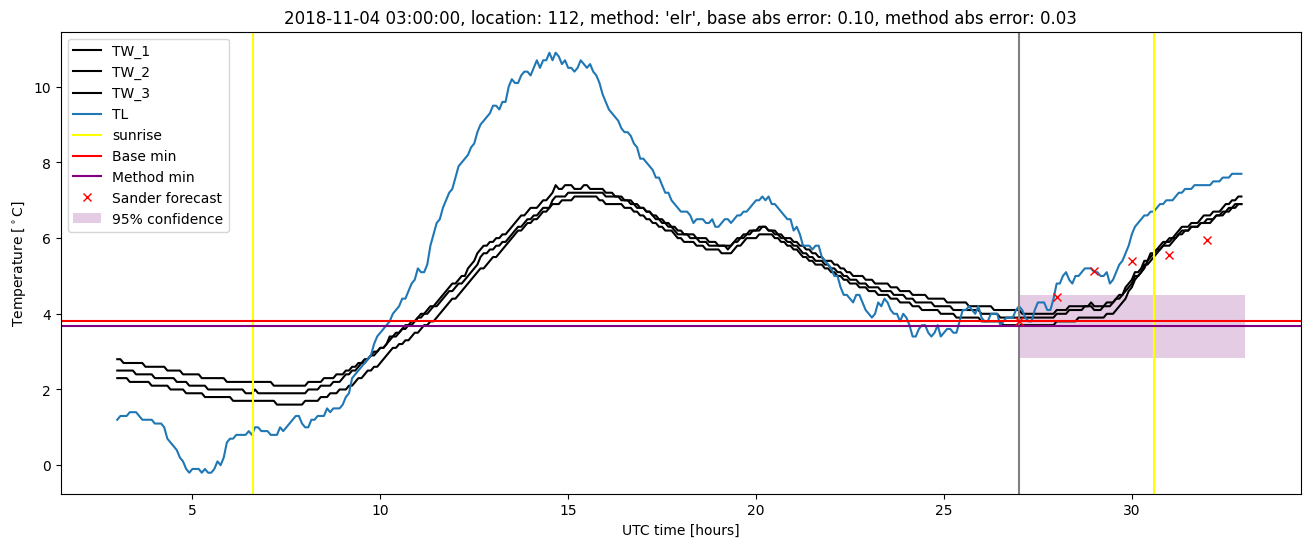
Extended logistic regression plots