GMS location: 1116
Random forest results
| names |
period |
power |
significance |
meanSquareError |
absError |
maxError |
CRPS |
IGN |
| baseline |
winter 2016 |
0.994 |
0.061 |
0.451 |
0.489 |
2.546 |
NaN |
NaN |
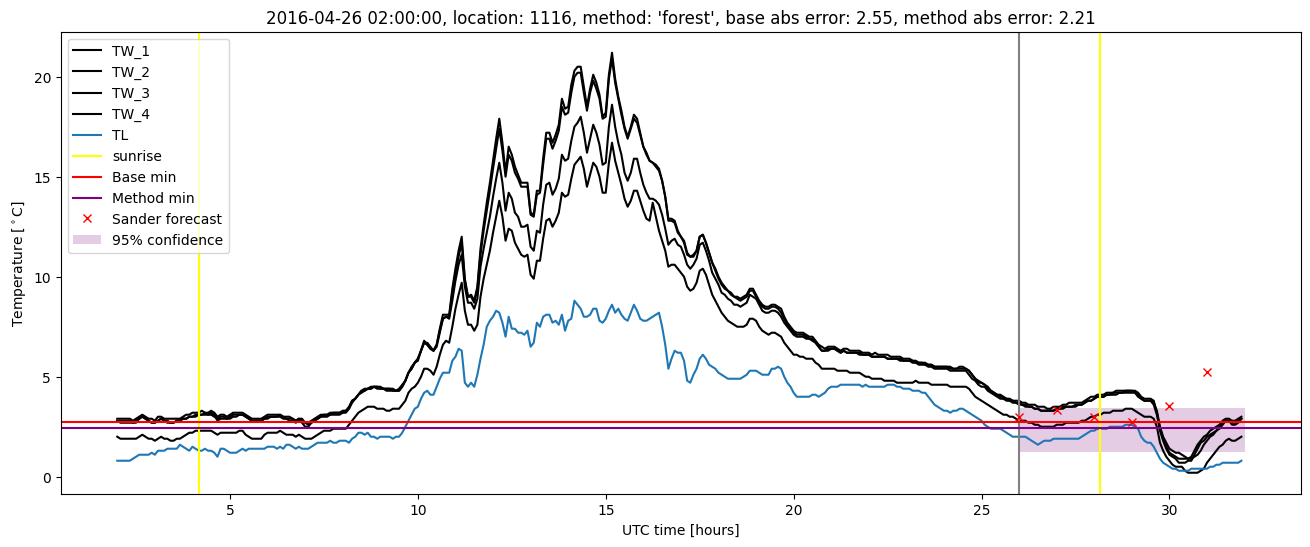
| forest |
winter 2016 |
0.982 |
0.030 |
0.365 |
0.430 |
2.215 |
0.570 |
4.204 |
| baseline |
winter 2017 |
0.980 |
0.160 |
0.413 |
0.477 |
1.956 |
NaN |
NaN |
| forest |
winter 2017 |
0.990 |
0.080 |
0.317 |
0.427 |
1.898 |
0.527 |
3.458 |
| baseline |
winter 2018 |
0.986 |
0.089 |
0.350 |
0.418 |
2.579 |
NaN |
NaN |
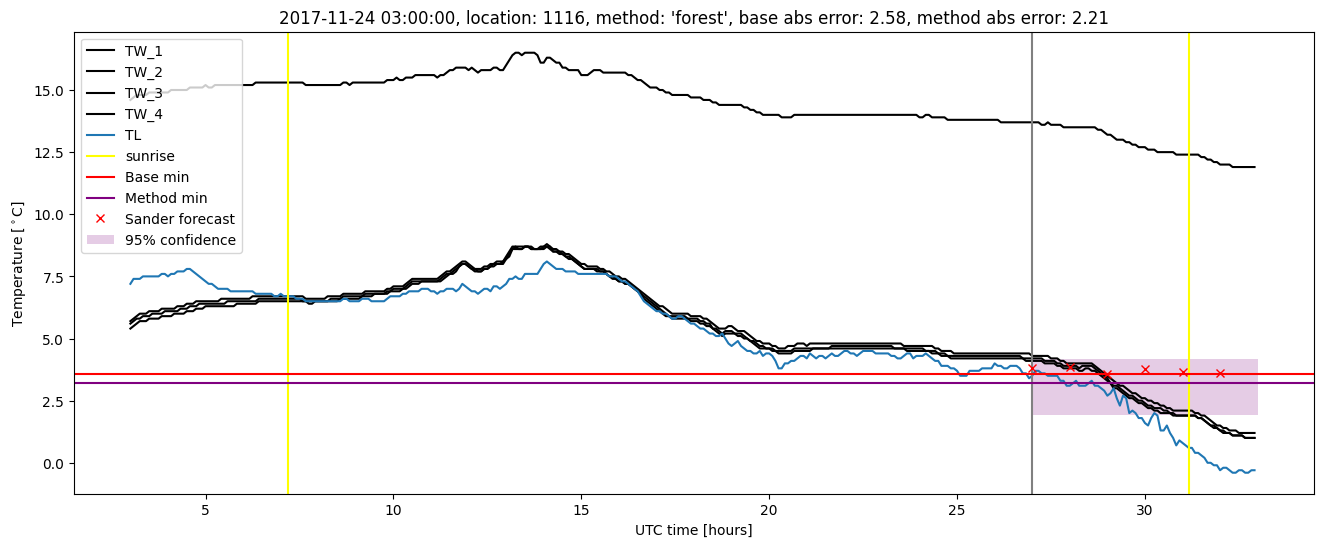
| forest |
winter 2018 |
0.978 |
0.067 |
0.299 |
0.416 |
2.208 |
0.578 |
3.375 |
| baseline |
winter 2019 |
1.000 |
0.000e+00 |
0.400 |
0.433 |
2.600 |
NaN |
NaN |
| forest |
winter 2019 |
0.993 |
0.000e+00 |
0.309 |
0.396 |
2.377 |
0.548 |
3.709 |
| baseline |
all |
0.991 |
0.099 |
0.404 |
0.455 |
2.600 |
NaN |
NaN |
| forest |
all |
0.985 |
0.056 |
0.324 |
0.418 |
2.377 |
0.558 |
3.708 |
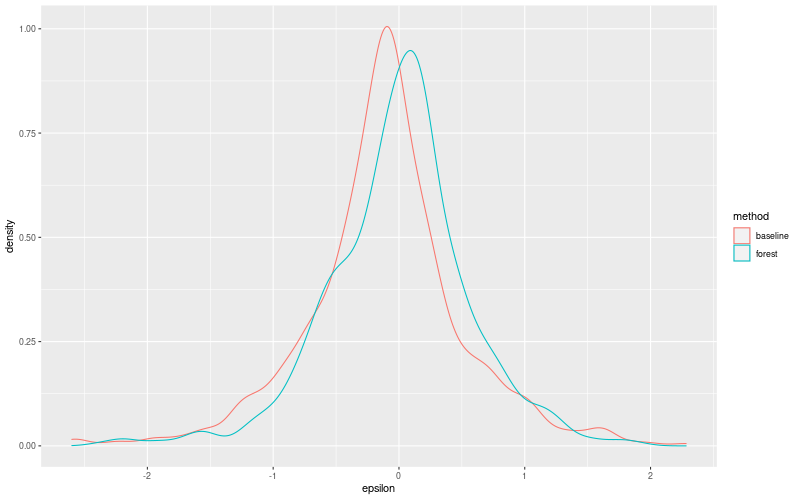
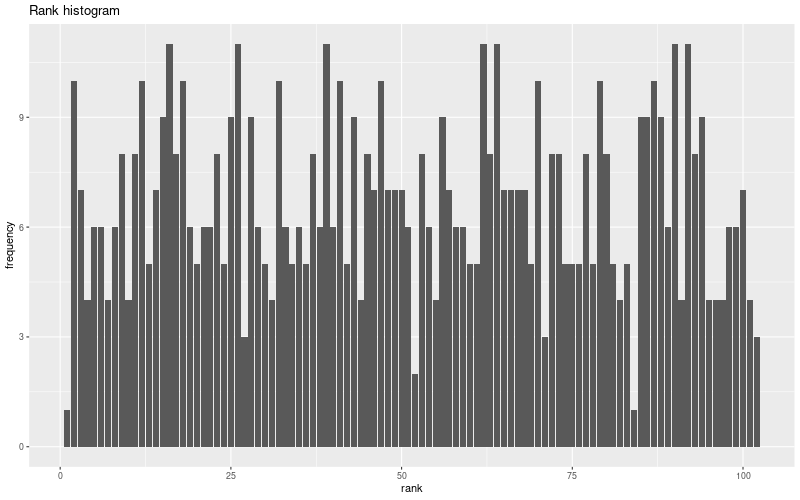
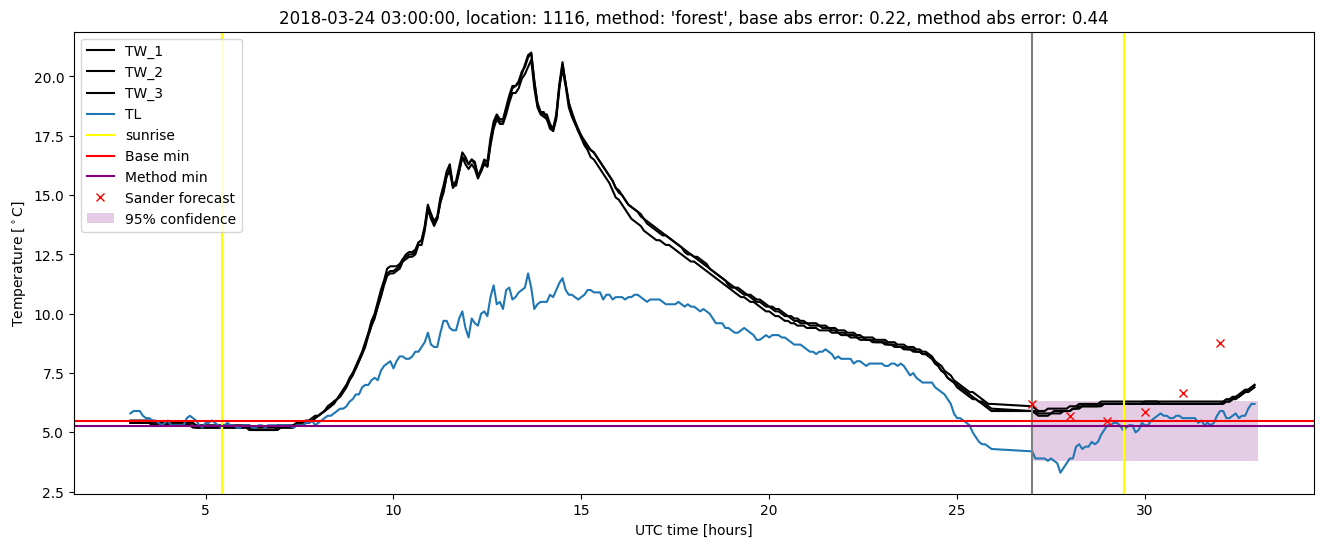
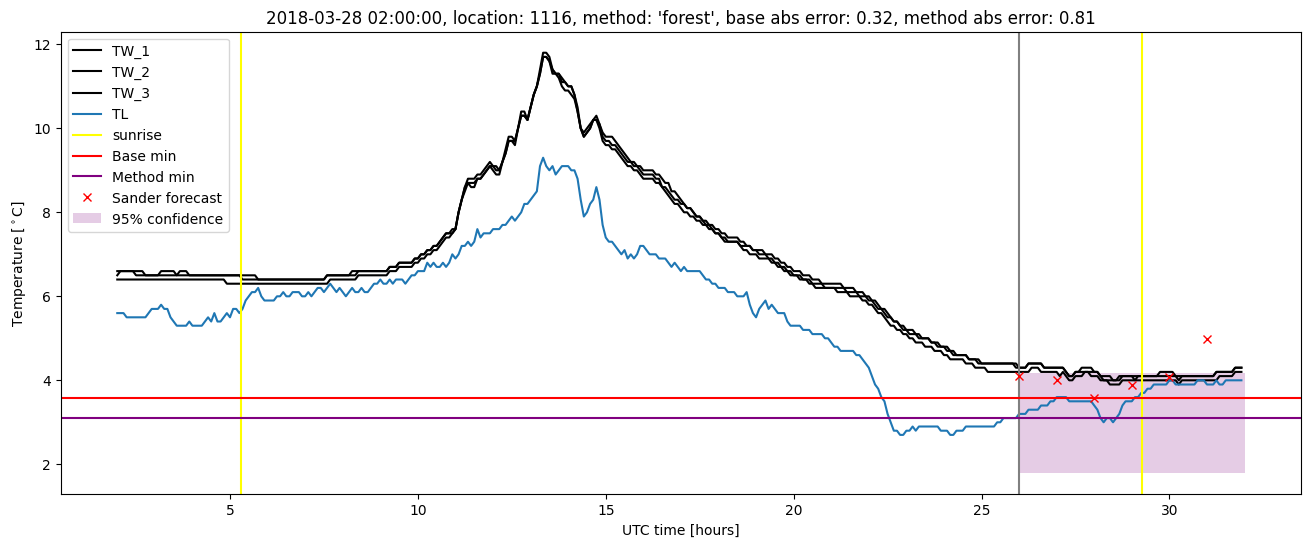
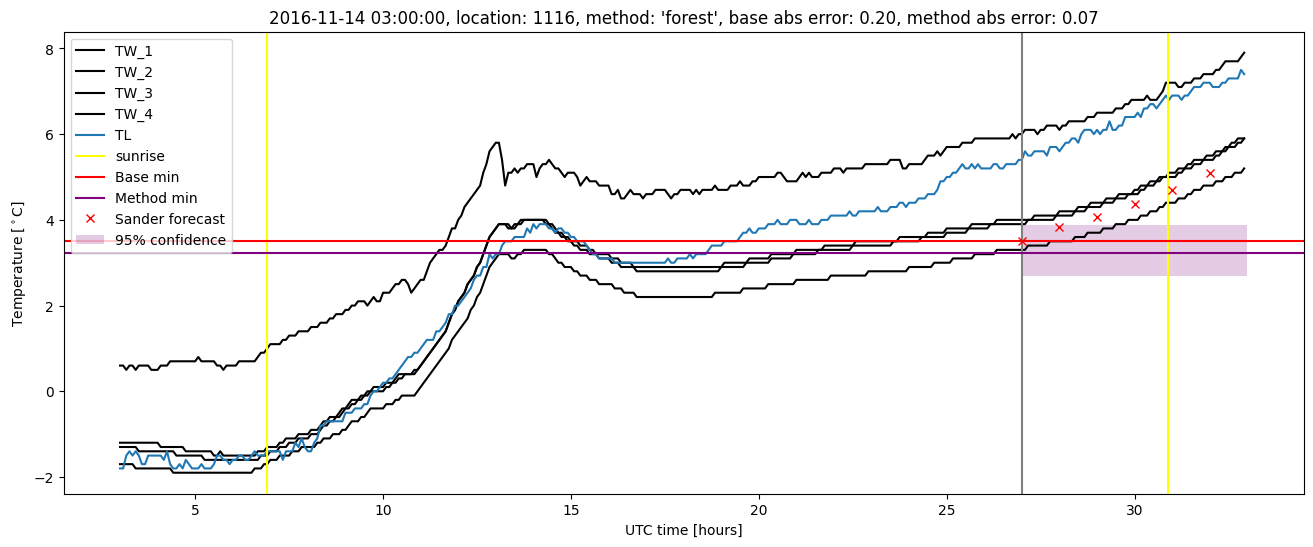
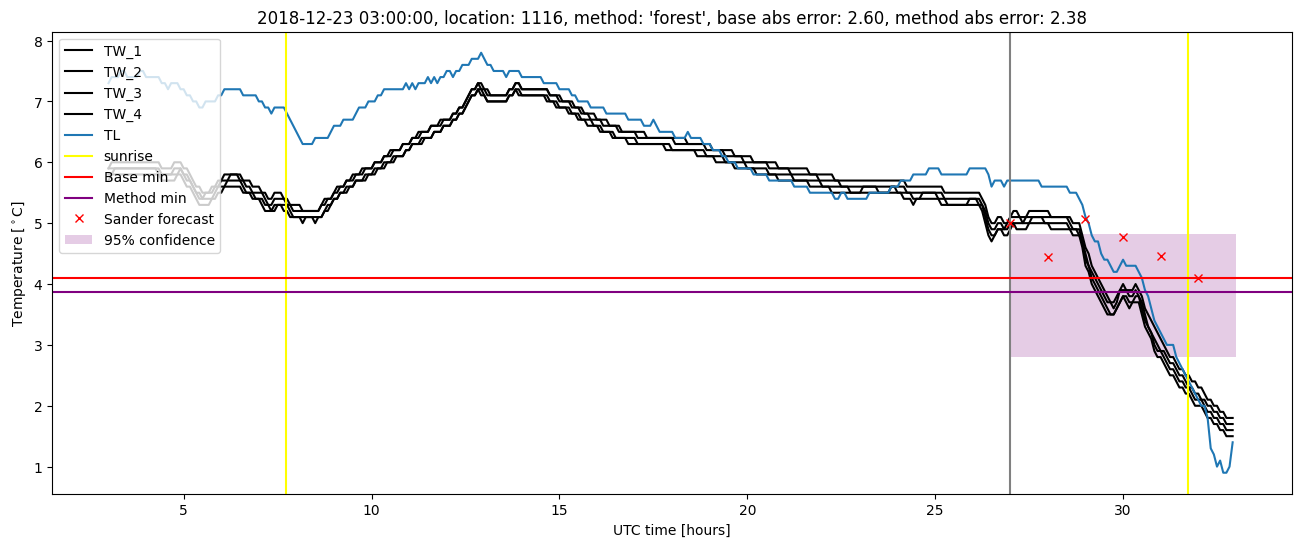
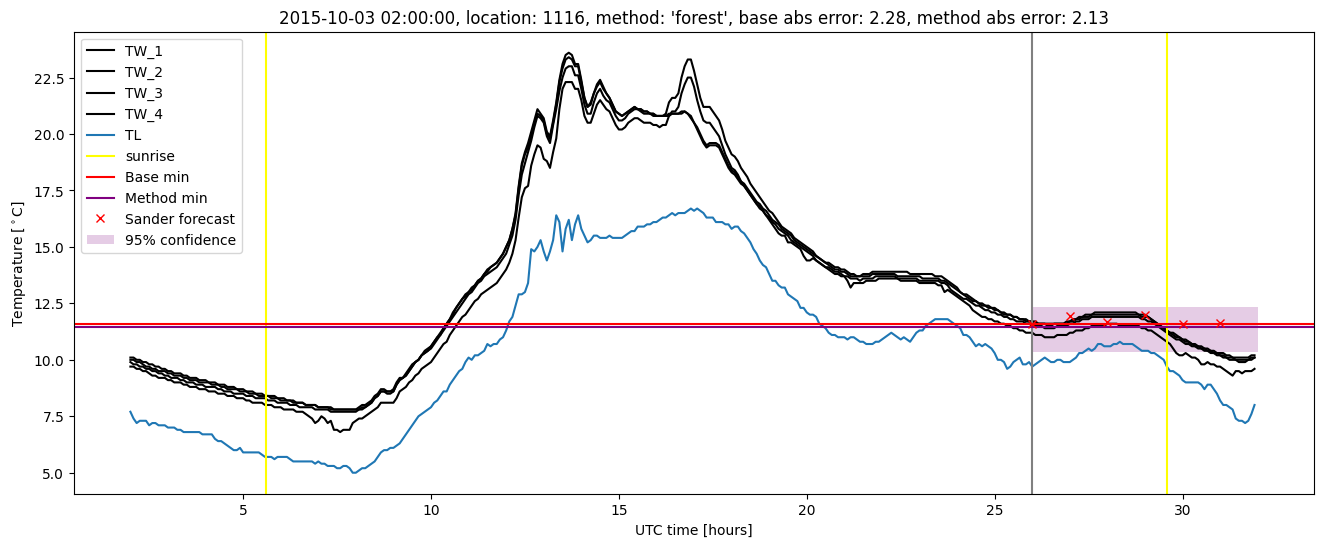
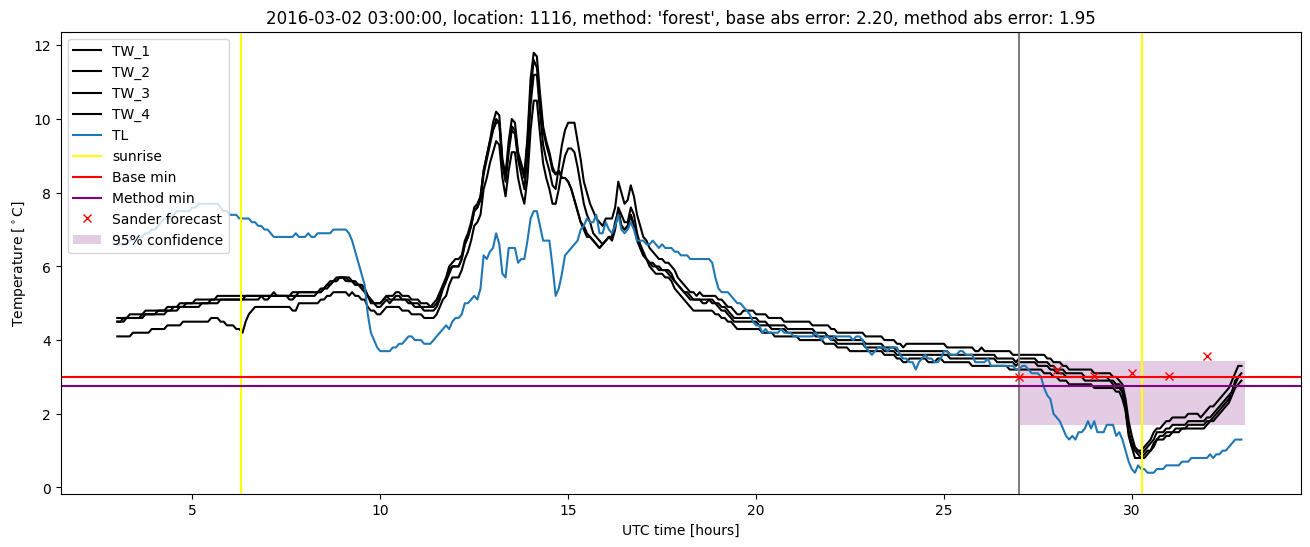
Random forest plots
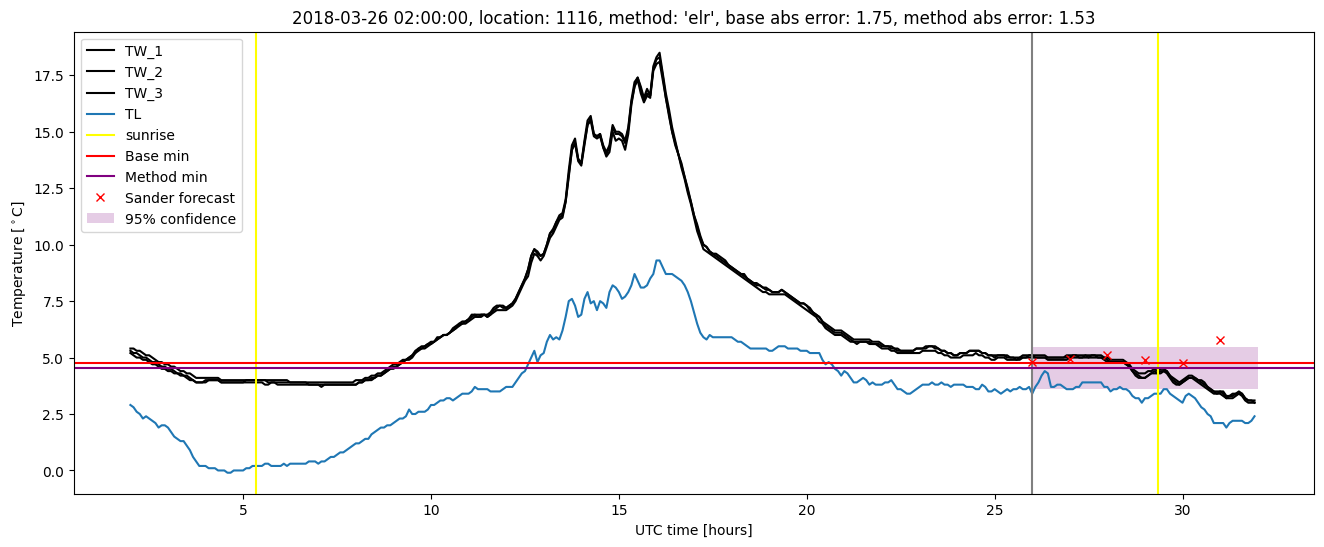
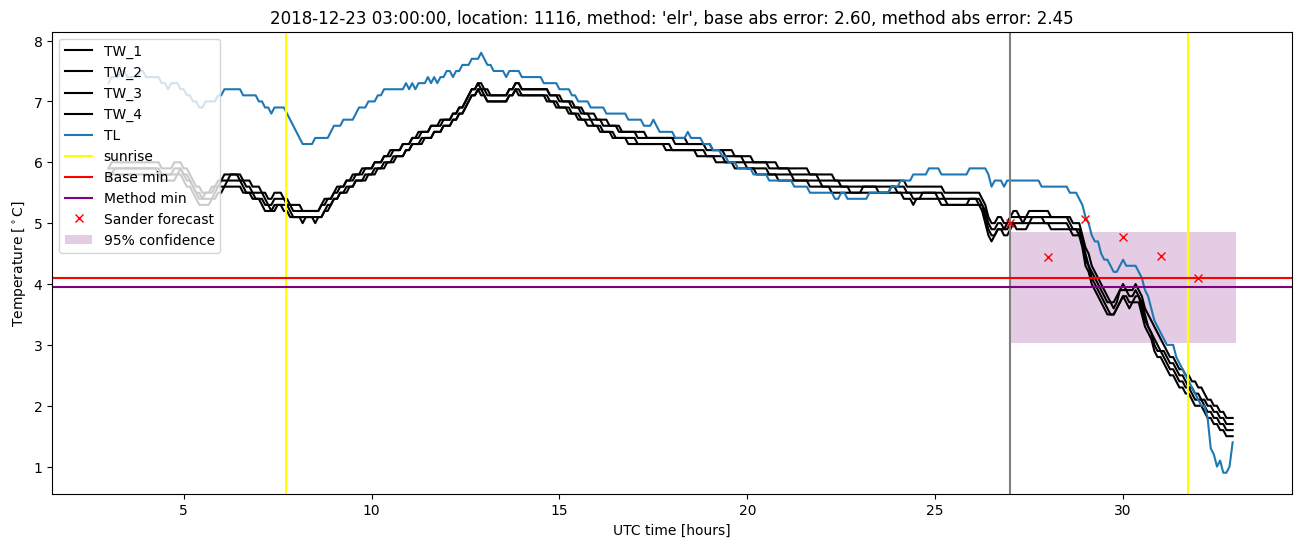
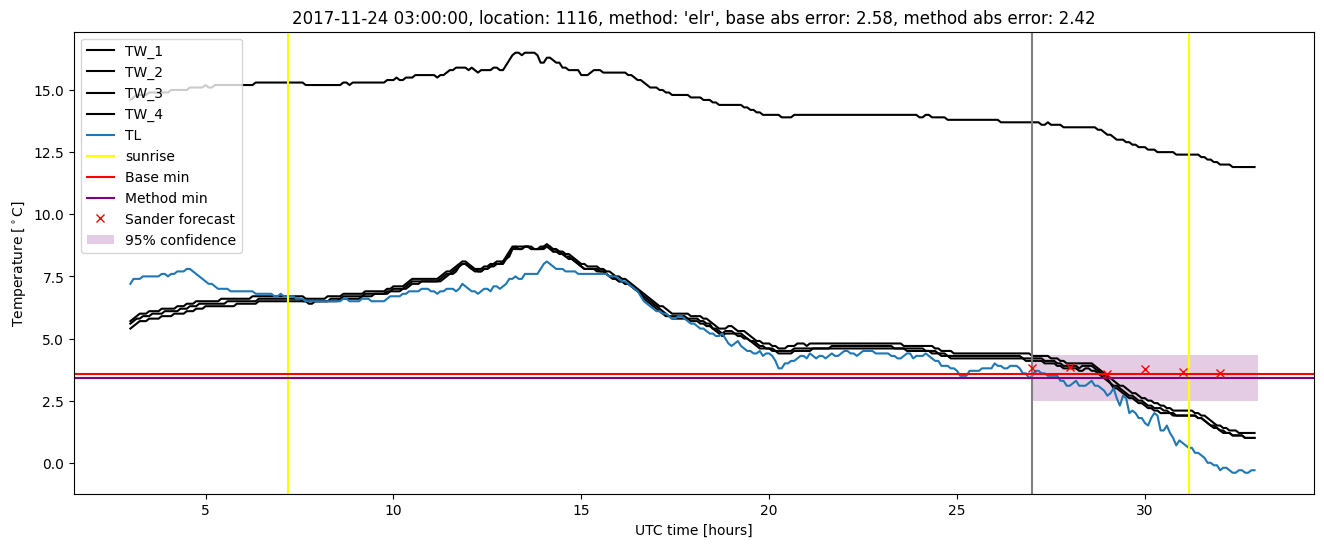
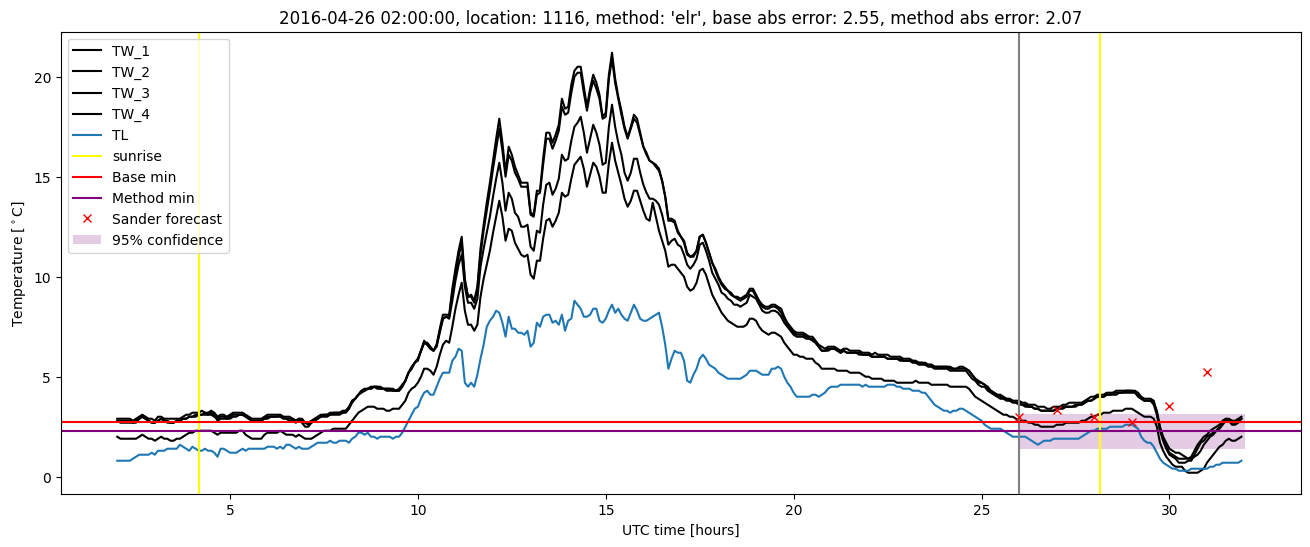
Extended logistic regression results
| names |
period |
power |
significance |
meanSquareError |
absError |
maxError |
CRPS |
IGN |
| baseline |
winter 2016 |
0.994 |
0.061 |
0.451 |
0.489 |
2.546 |
NaN |
NaN |
| elr |
winter 2016 |
0.988 |
0.061 |
0.340 |
0.432 |
2.070 |
0.646 |
5.447 |
| baseline |
winter 2017 |
0.980 |
0.160 |
0.413 |
0.477 |
1.956 |
NaN |
NaN |
| elr |
winter 2017 |
0.969 |
0.060 |
0.340 |
0.450 |
1.716 |
0.577 |
4.234 |
| baseline |
winter 2018 |
0.986 |
0.089 |
0.350 |
0.418 |
2.579 |
NaN |
NaN |
| elr |
winter 2018 |
0.978 |
0.111 |
0.332 |
0.440 |
2.422 |
0.634 |
4.708 |
| baseline |
winter 2019 |
1.000 |
0.000e+00 |
0.400 |
0.433 |
2.600 |
NaN |
NaN |
| elr |
winter 2019 |
1.000 |
0.000e+00 |
0.308 |
0.410 |
2.449 |
0.583 |
4.354 |
| baseline |
all |
0.991 |
0.099 |
0.404 |
0.455 |
2.600 |
NaN |
NaN |
| elr |
all |
0.985 |
0.070 |
0.331 |
0.433 |
2.449 |
0.614 |
4.739 |
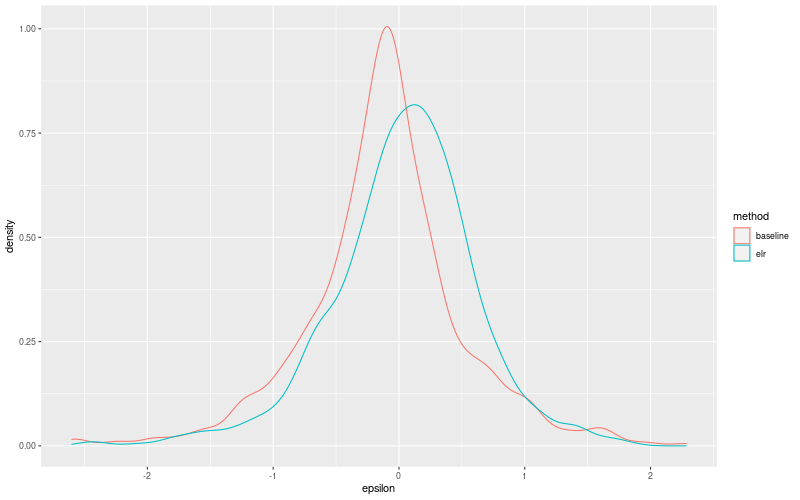
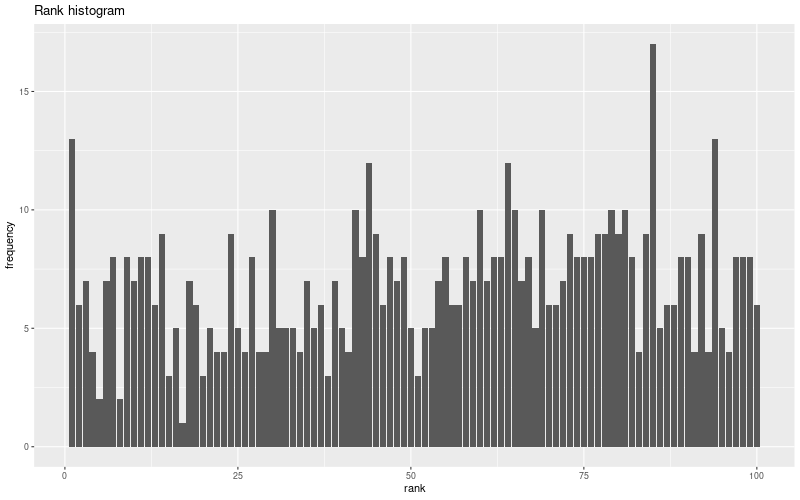
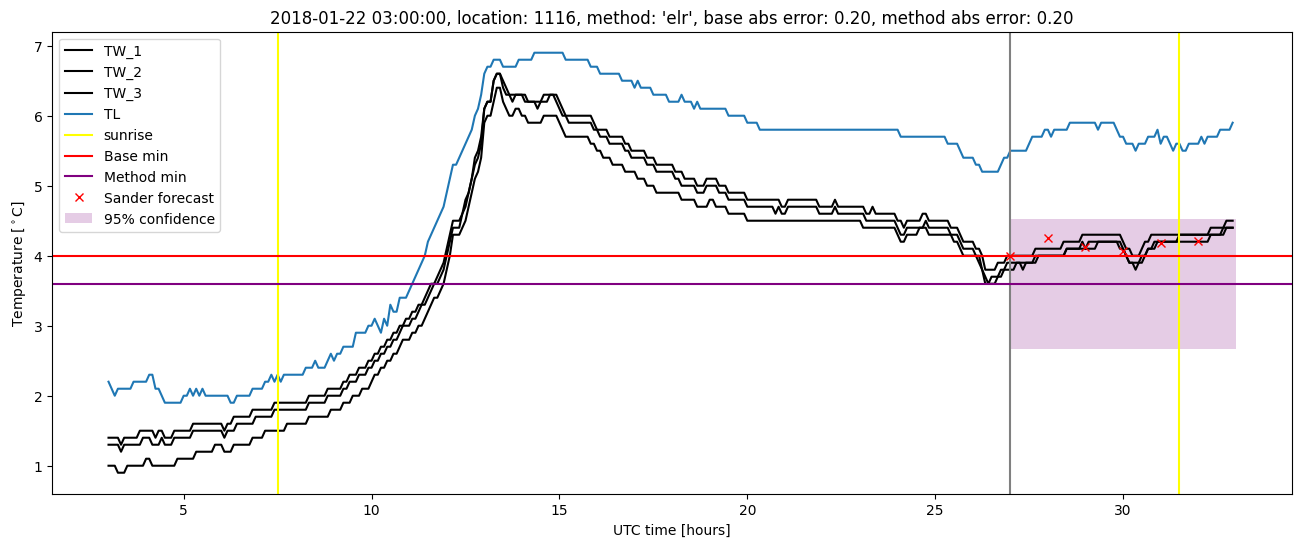
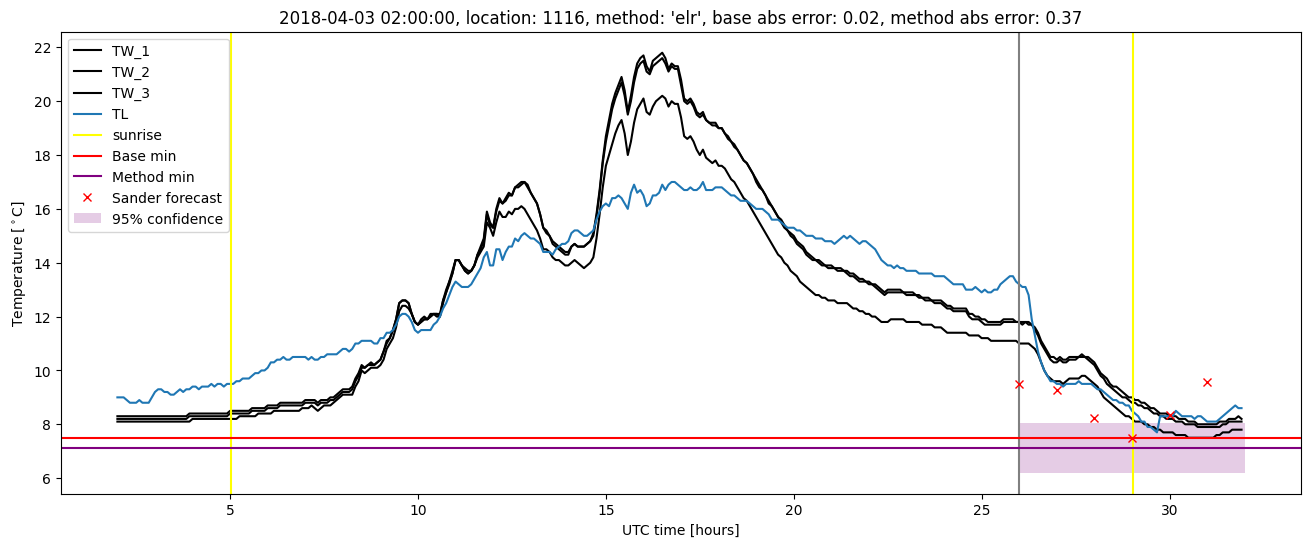
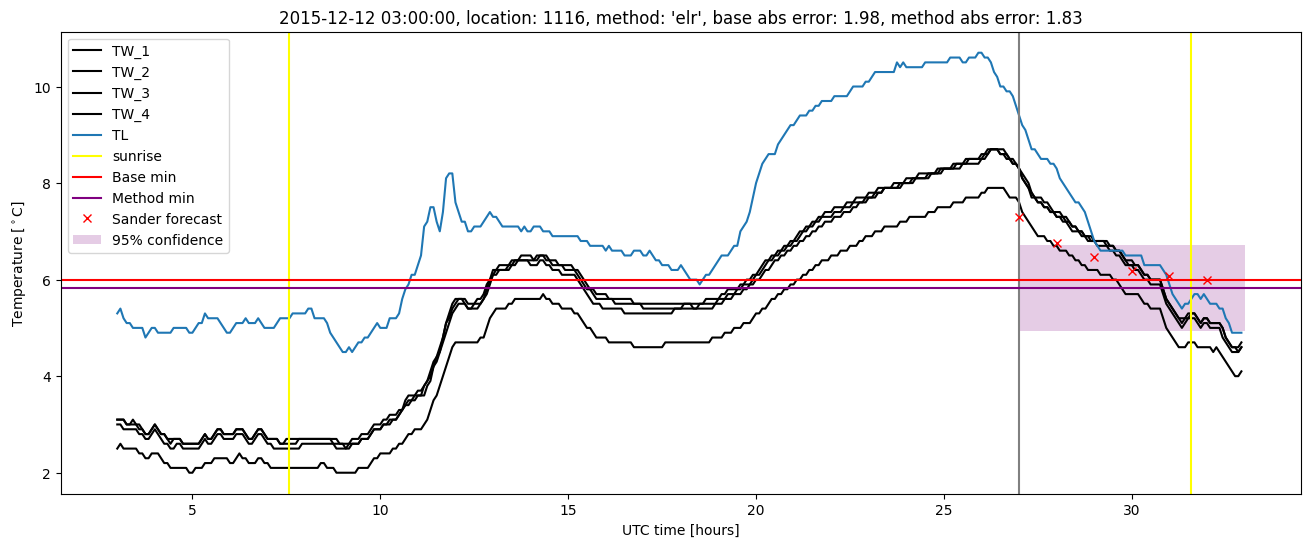
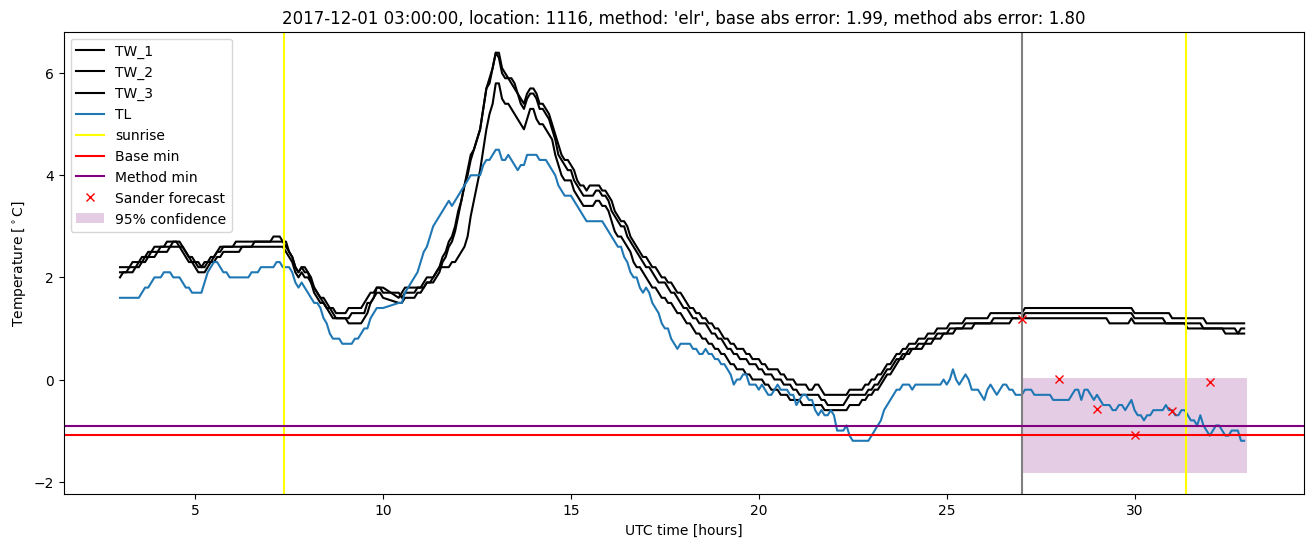
Extended logistic regression plots