GMS location: 1115
Random forest results
| names |
period |
power |
significance |
meanSquareError |
absError |
maxError |
CRPS |
IGN |
| baseline |
winter 2016 |
0.983 |
0.088 |
0.398 |
0.430 |
2.735 |
NaN |
NaN |
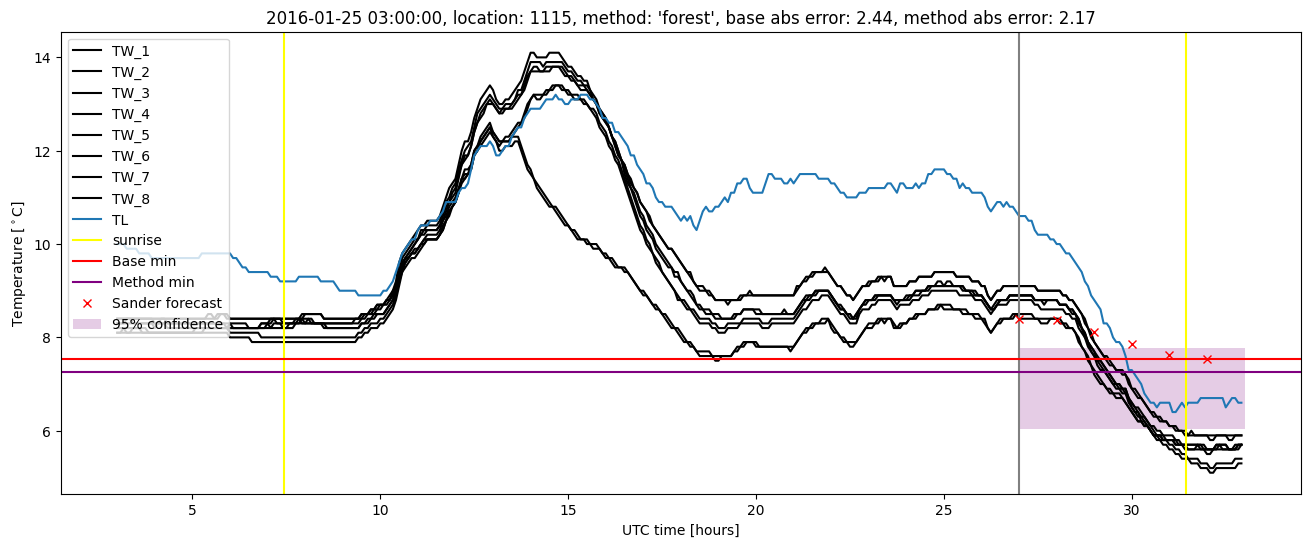
| forest |
winter 2016 |
0.954 |
0.059 |
0.337 |
0.399 |
2.565 |
0.589 |
3.695 |
| baseline |
winter 2017 |
0.991 |
0.068 |
0.381 |
0.436 |
2.169 |
NaN |
NaN |
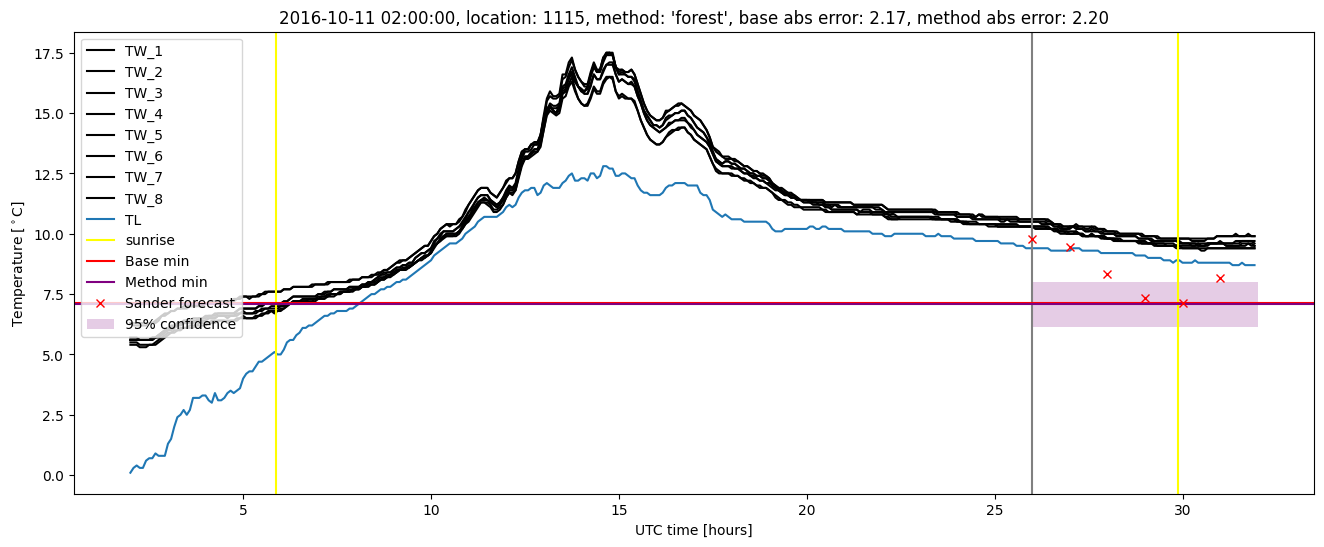
| forest |
winter 2017 |
0.981 |
0.068 |
0.315 |
0.396 |
2.203 |
0.554 |
3.132 |
| baseline |
winter 2018 |
0.985 |
0.075 |
0.393 |
0.444 |
2.073 |
NaN |
NaN |
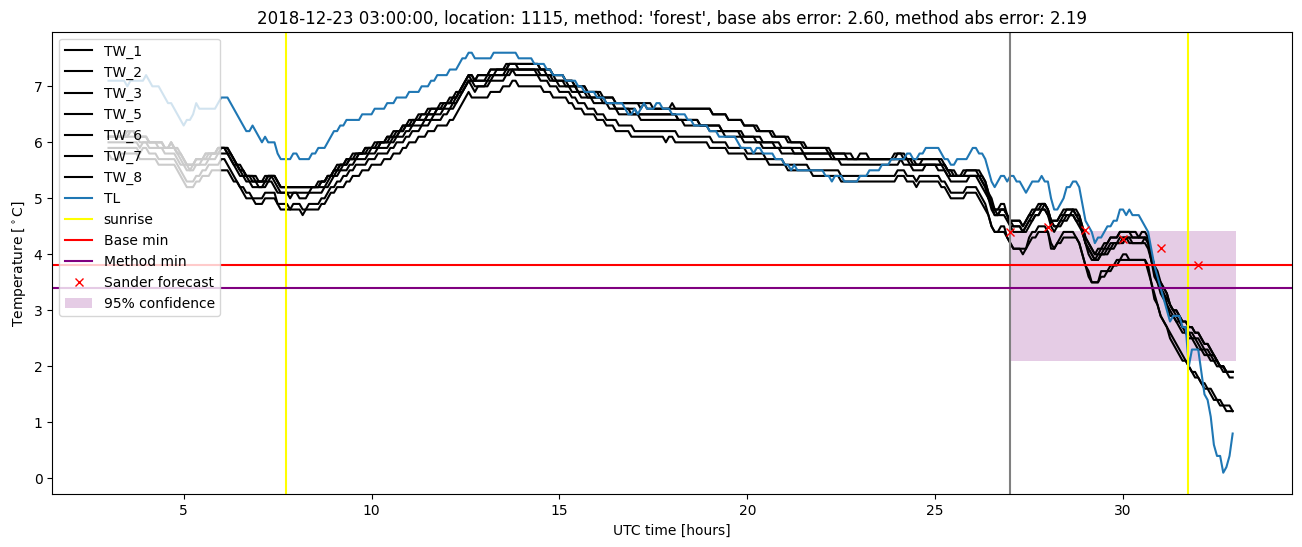
| forest |
winter 2018 |
0.985 |
0.000e+00 |
0.354 |
0.458 |
1.738 |
0.585 |
3.478 |
| baseline |
winter 2019 |
0.991 |
0.154 |
0.426 |
0.463 |
2.602 |
NaN |
NaN |
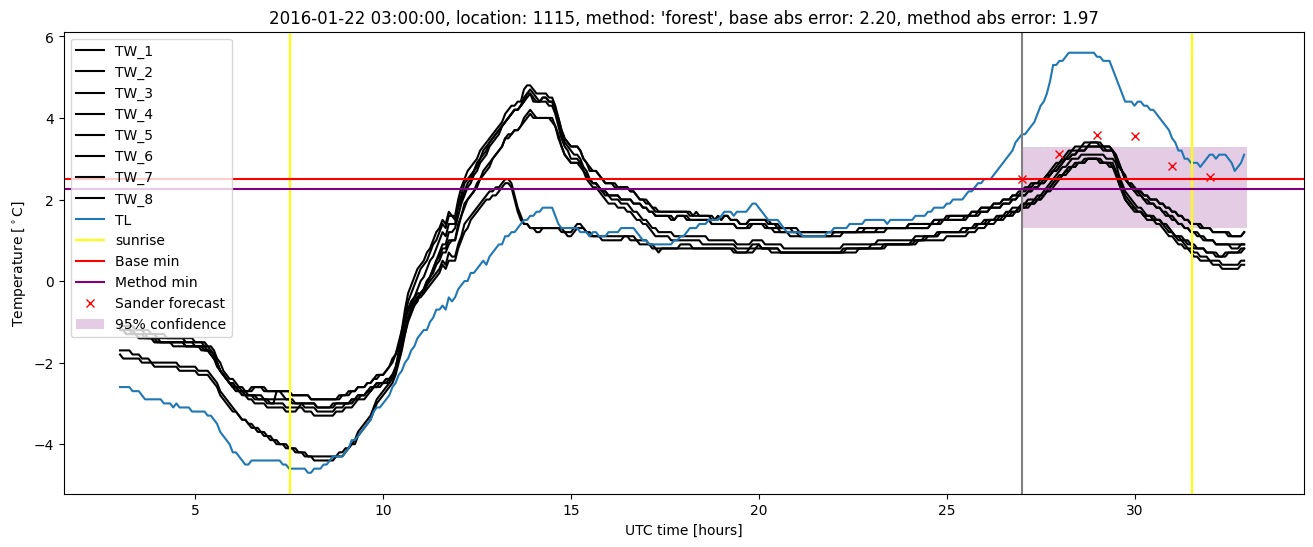
| forest |
winter 2019 |
0.991 |
0.077 |
0.332 |
0.425 |
2.191 |
0.569 |
3.278 |
| baseline |
all |
0.987 |
0.084 |
0.398 |
0.442 |
2.735 |
NaN |
NaN |
| forest |
all |
0.975 |
0.046 |
0.336 |
0.419 |
2.565 |
0.576 |
3.429 |
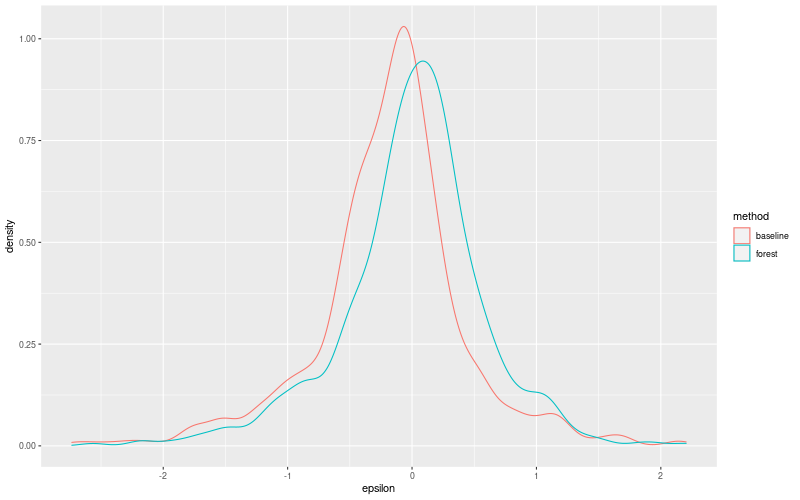
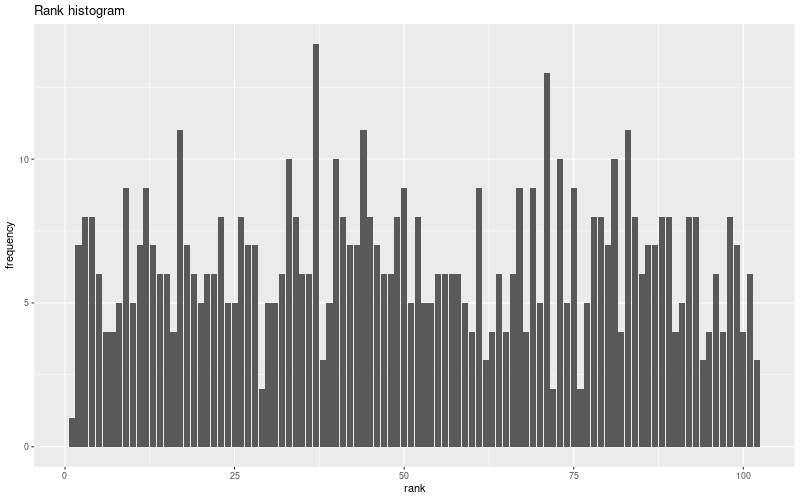
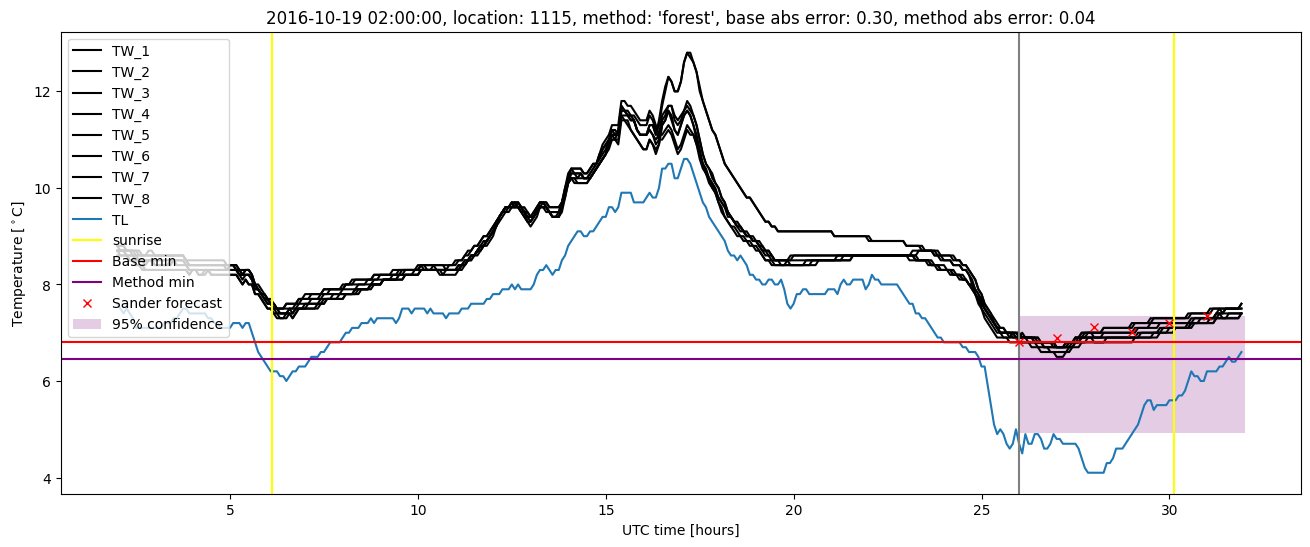
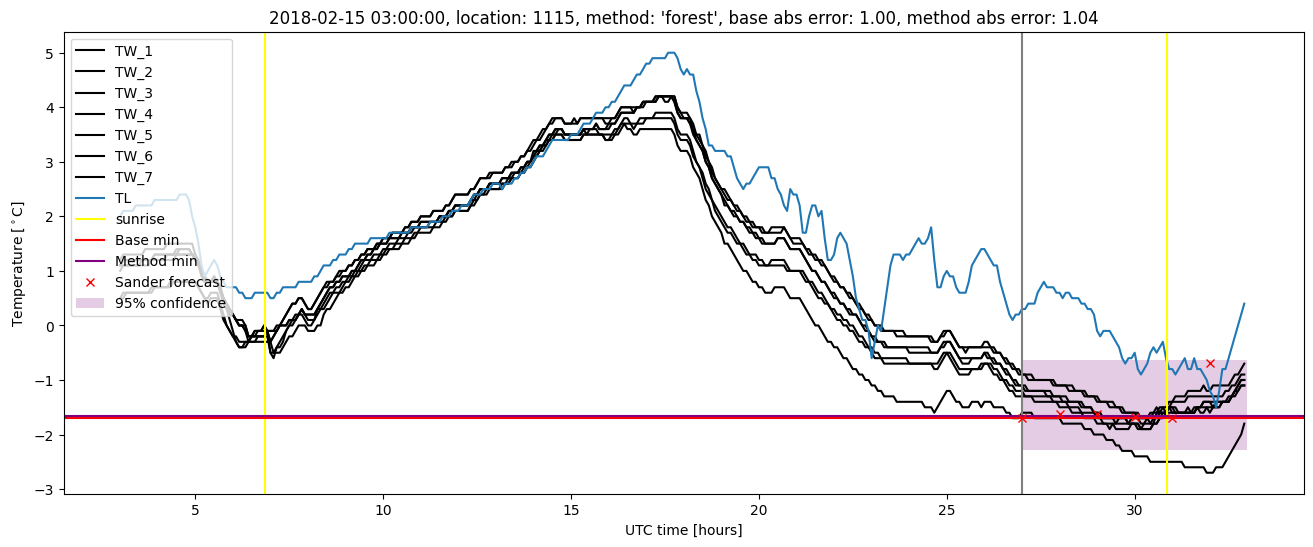
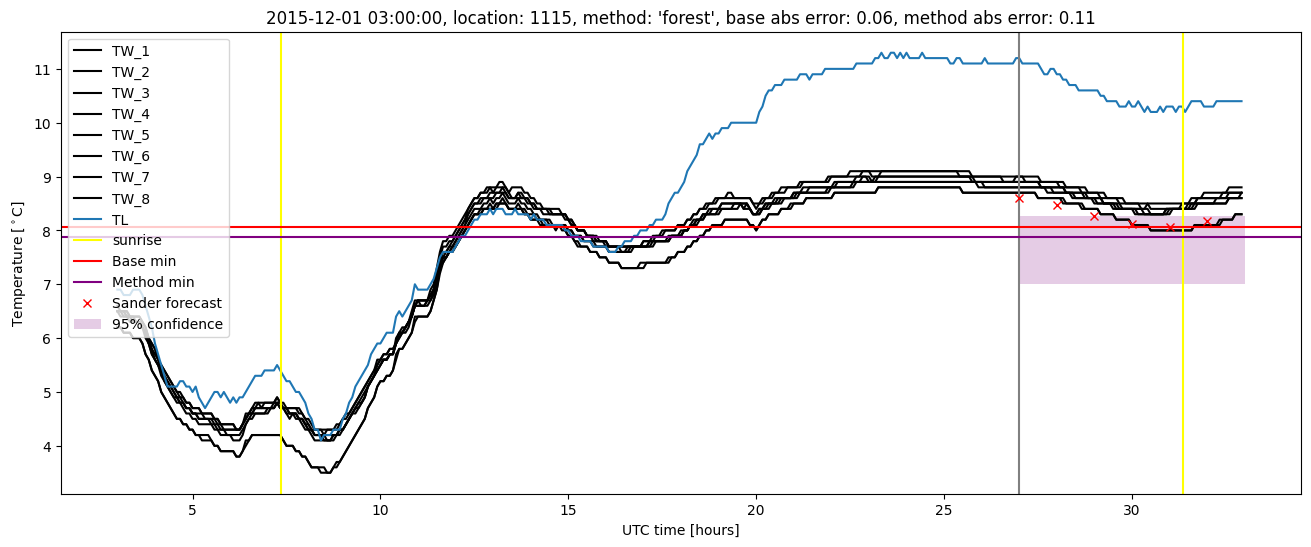
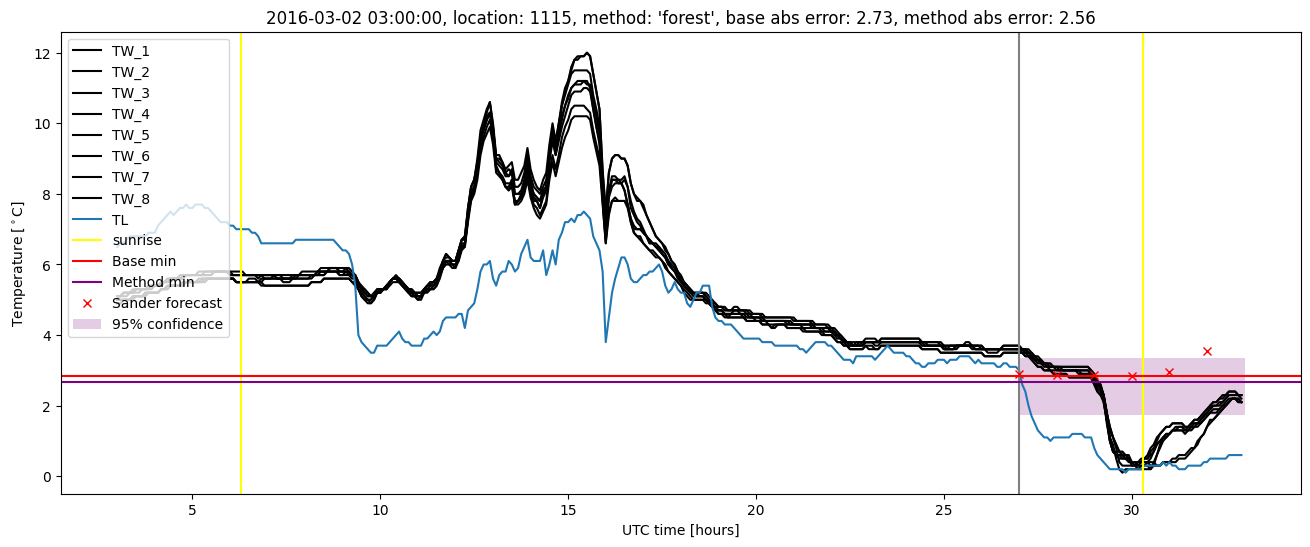
Random forest plots
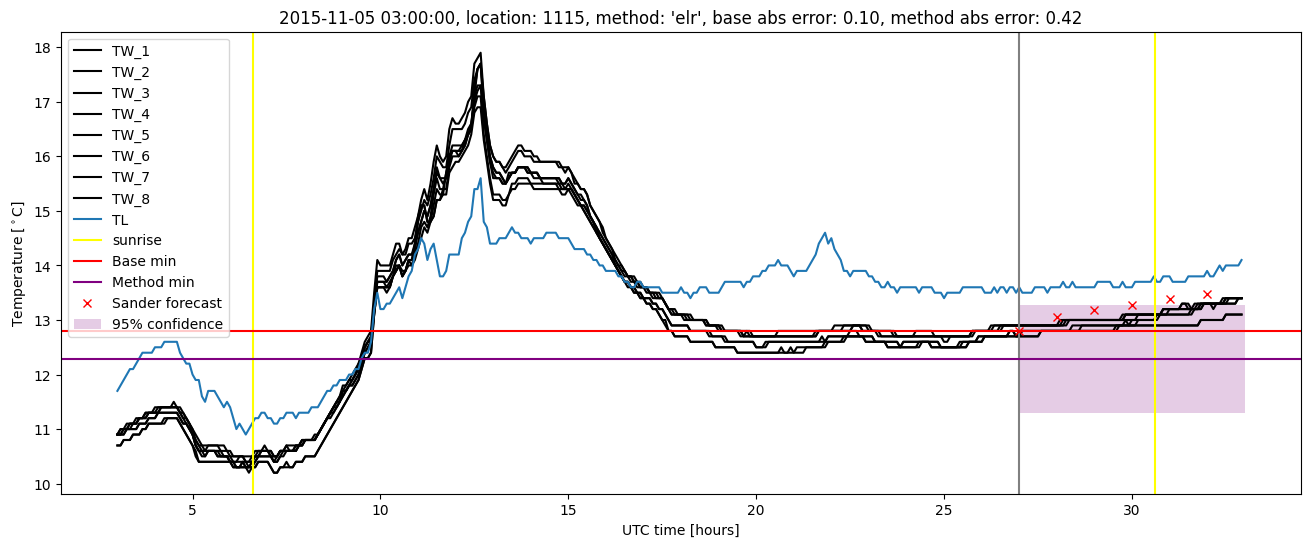
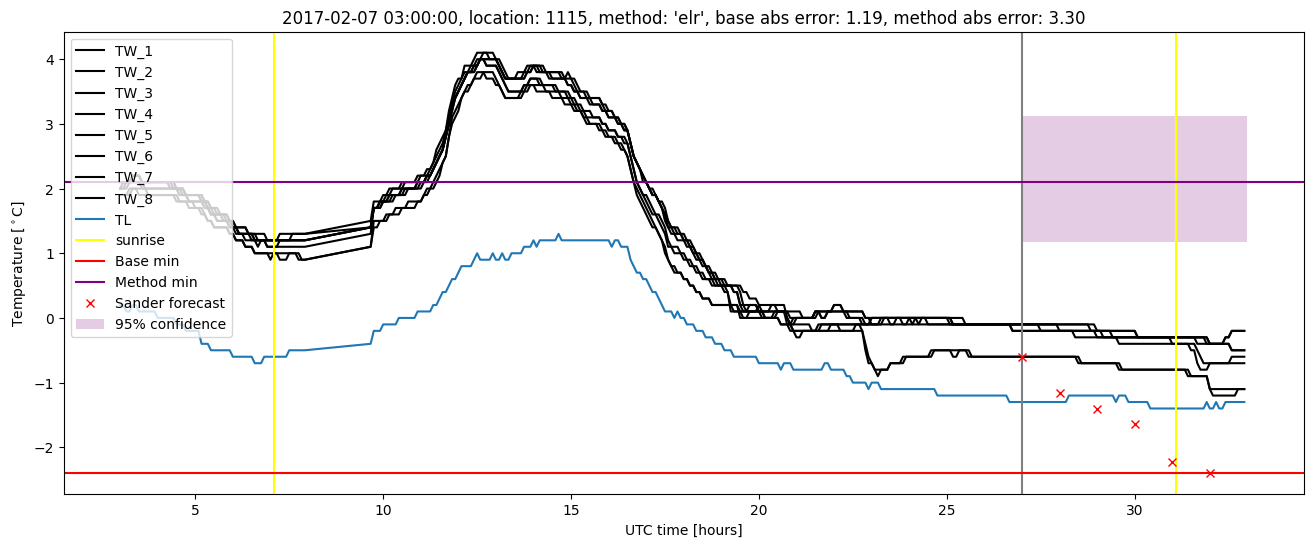
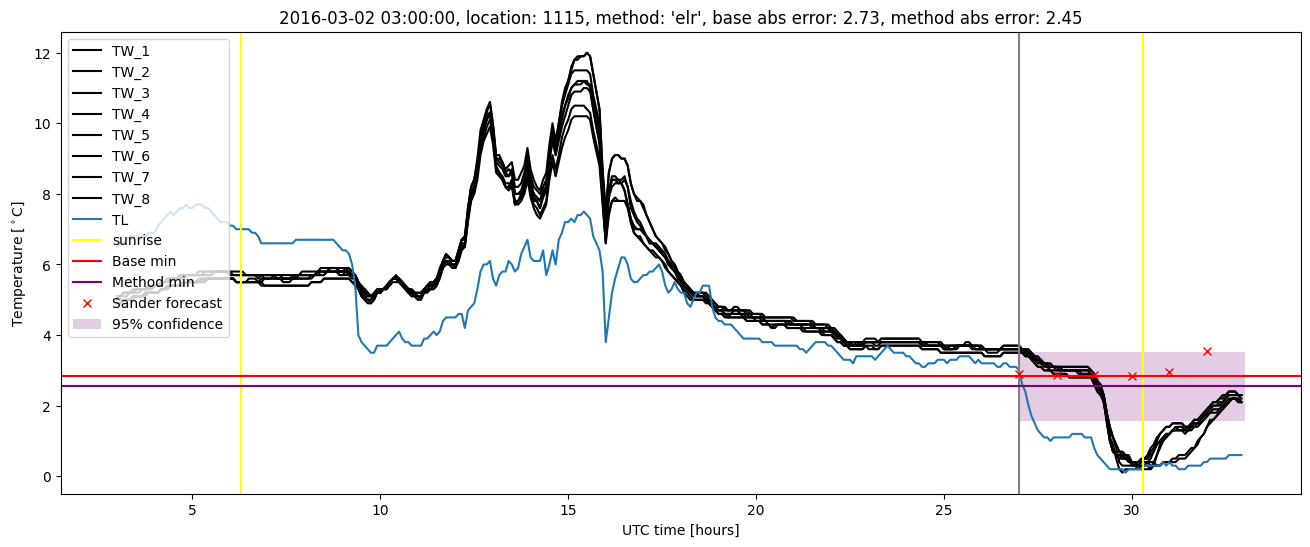
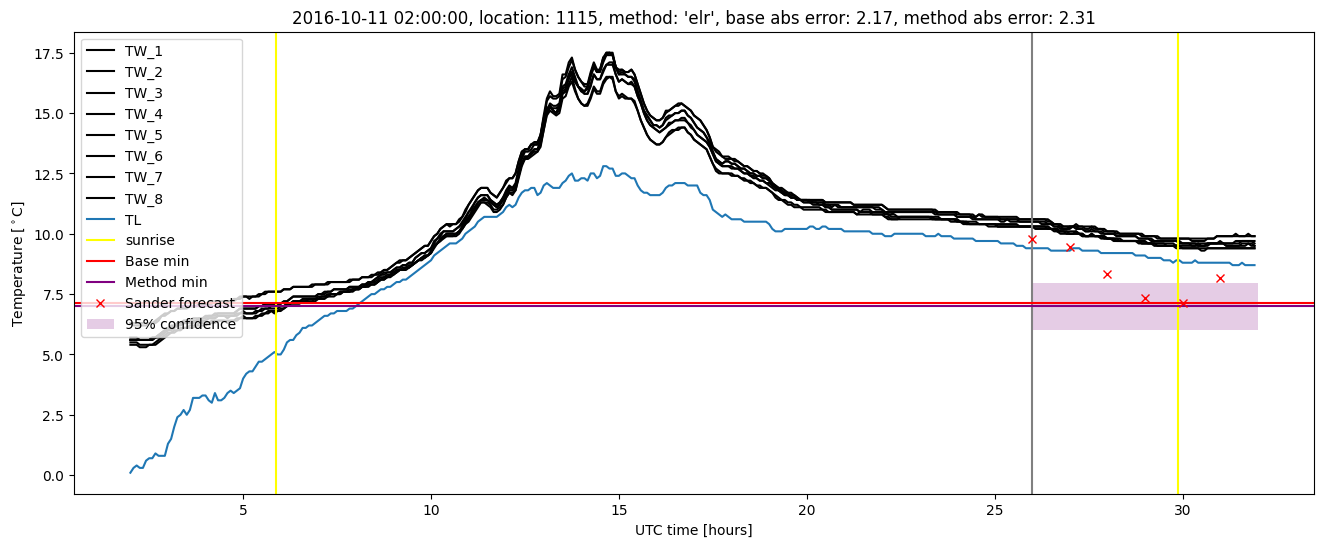
Extended logistic regression results
| names |
period |
power |
significance |
meanSquareError |
absError |
maxError |
CRPS |
IGN |
| baseline |
winter 2016 |
0.983 |
0.088 |
0.398 |
0.430 |
2.735 |
NaN |
NaN |
| elr |
winter 2016 |
0.971 |
0.059 |
0.342 |
0.419 |
2.447 |
0.633 |
3.757 |
| baseline |
winter 2017 |
0.991 |
0.068 |
0.381 |
0.436 |
2.169 |
NaN |
NaN |
| elr |
winter 2017 |
0.981 |
0.091 |
0.411 |
0.436 |
3.303 |
0.647 |
4.398 |
| baseline |
winter 2018 |
0.985 |
0.075 |
0.393 |
0.444 |
2.073 |
NaN |
NaN |
| elr |
winter 2018 |
0.978 |
0.000e+00 |
0.344 |
0.445 |
1.939 |
0.636 |
4.556 |
| baseline |
winter 2019 |
0.991 |
0.154 |
0.426 |
0.463 |
2.602 |
NaN |
NaN |
| elr |
winter 2019 |
0.991 |
0.154 |
0.393 |
0.488 |
2.306 |
0.616 |
4.028 |
| baseline |
all |
0.987 |
0.084 |
0.398 |
0.442 |
2.735 |
NaN |
NaN |
| elr |
all |
0.979 |
0.061 |
0.368 |
0.443 |
3.303 |
0.634 |
4.167 |
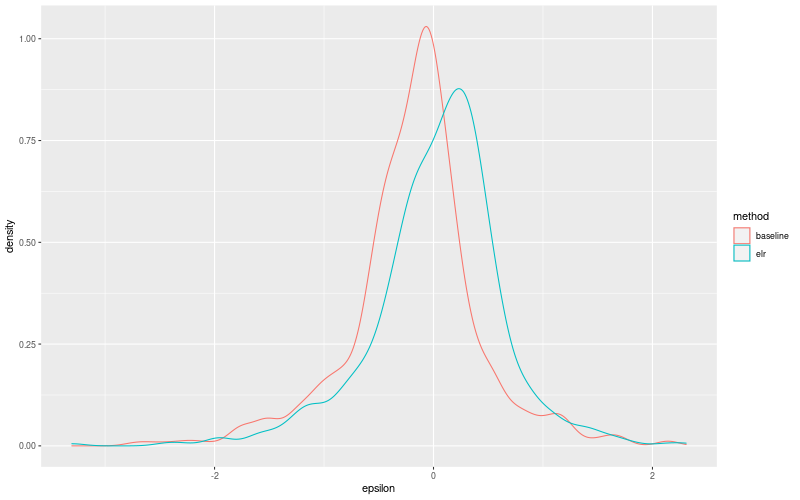
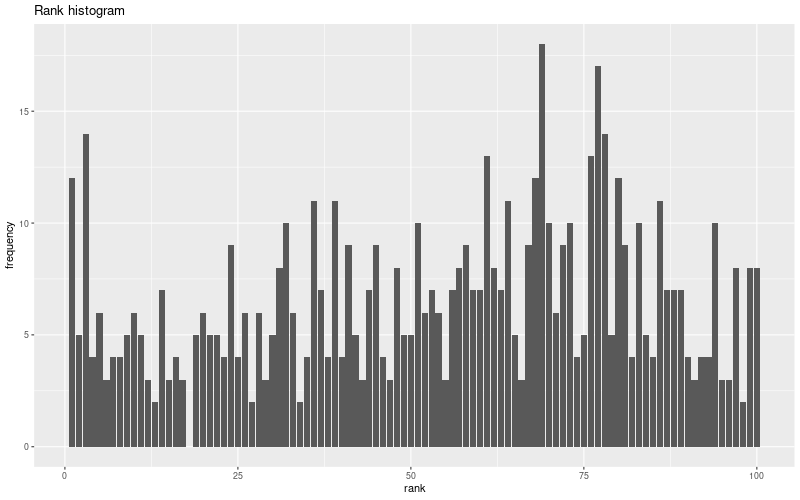
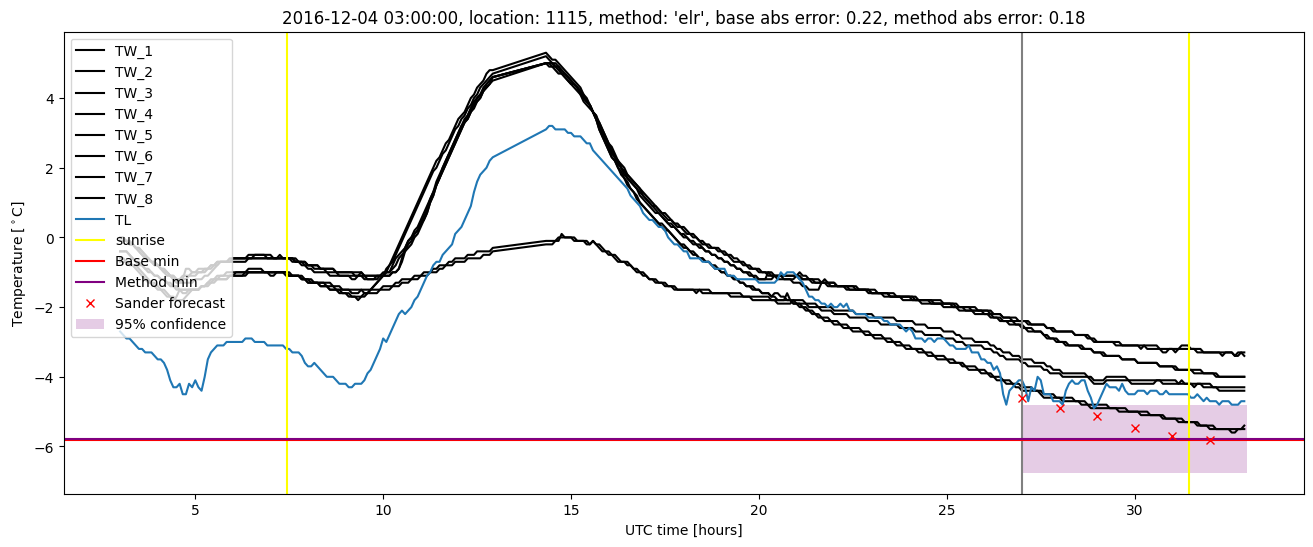
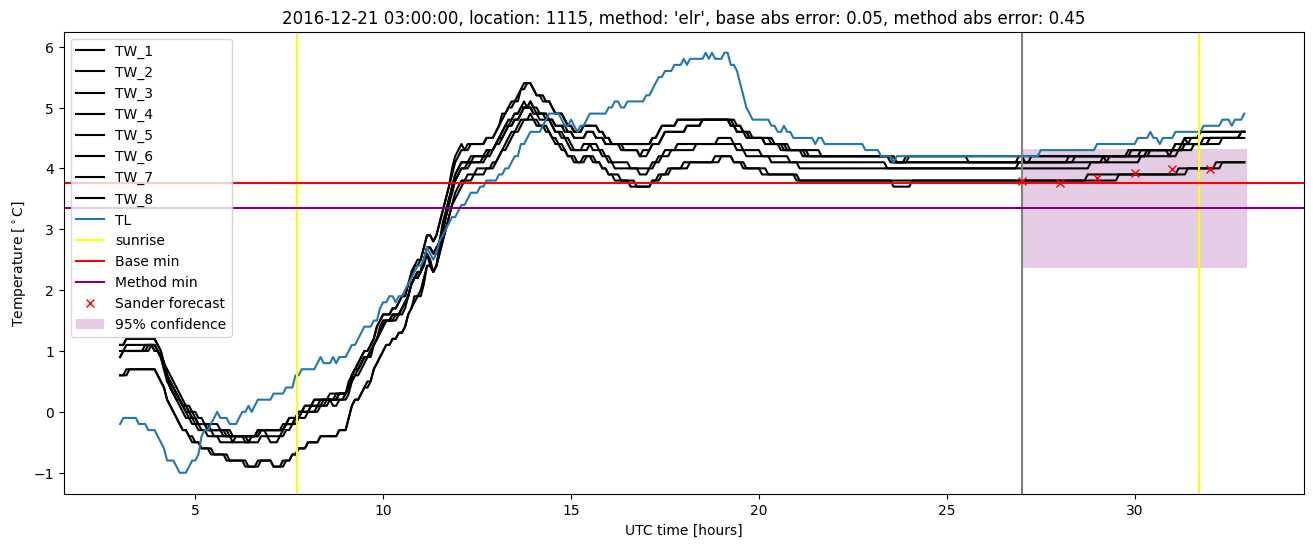
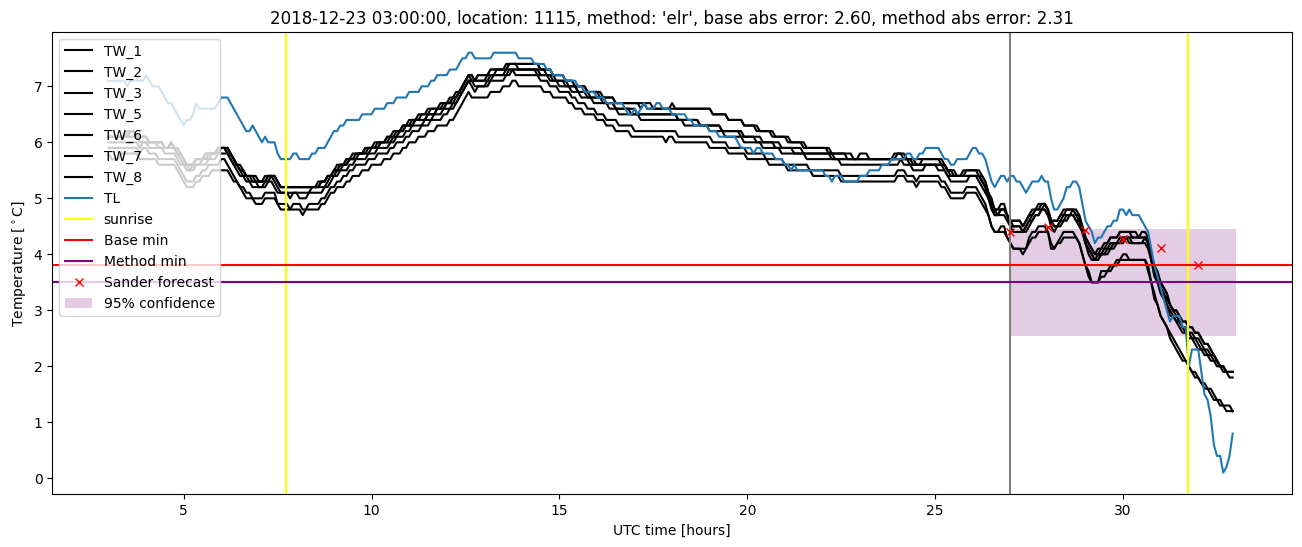
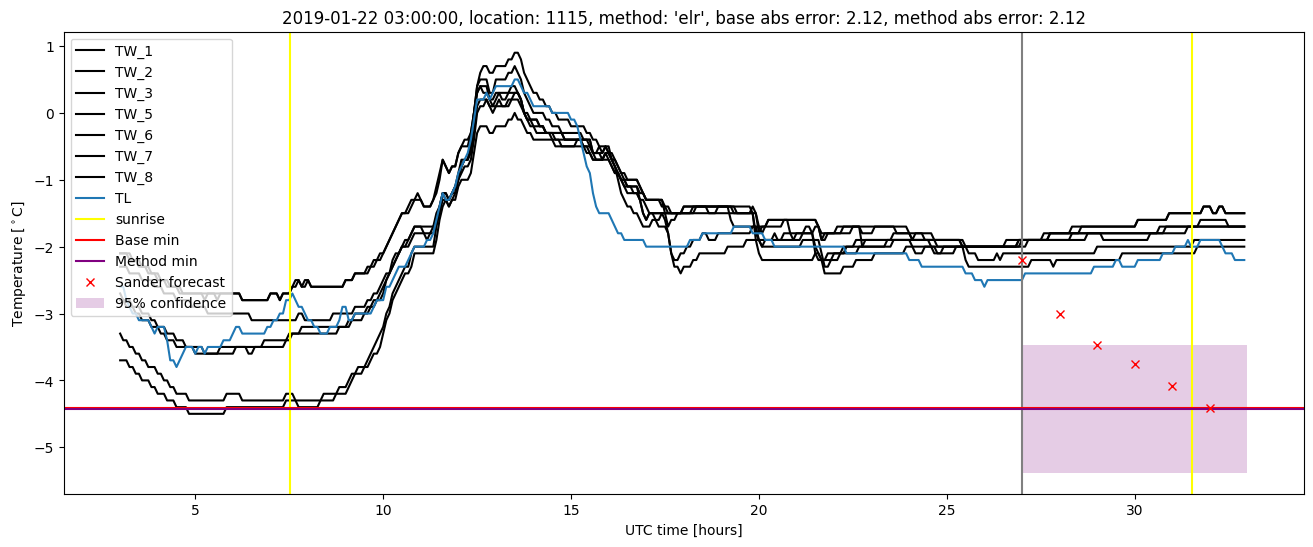
Extended logistic regression plots