GMS location: 1113
Random forest results
| names |
period |
power |
significance |
meanSquareError |
absError |
maxError |
CRPS |
IGN |
| baseline |
winter 2016 |
0.979 |
0.067 |
0.336 |
0.397 |
2.364 |
NaN |
NaN |
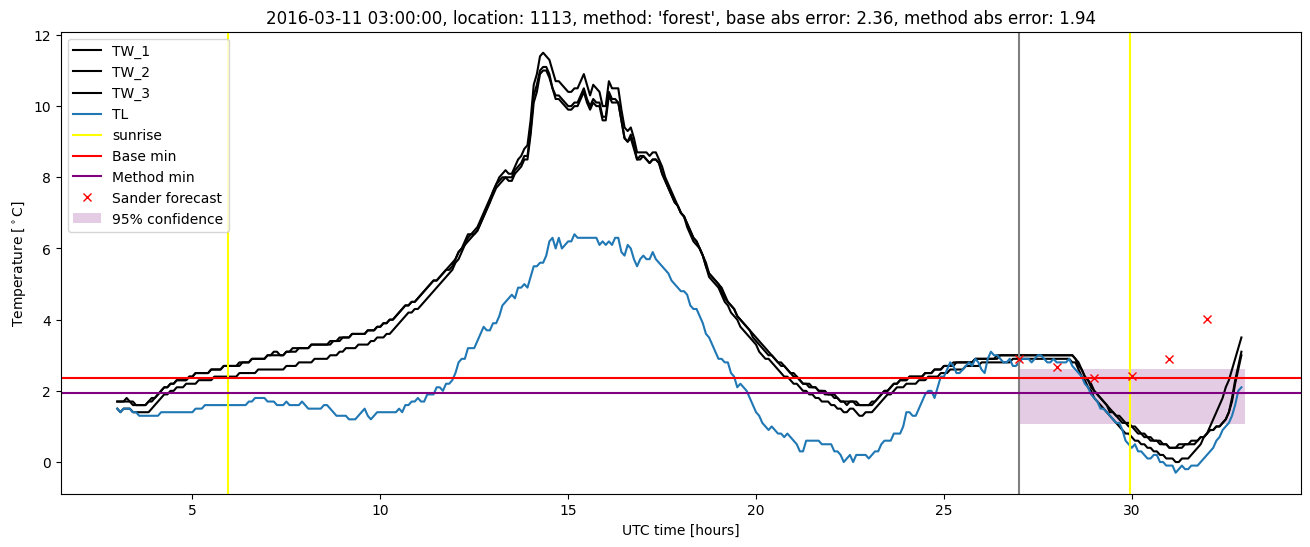
| forest |
winter 2016 |
0.979 |
0.067 |
0.325 |
0.433 |
1.935 |
0.516 |
2.323 |
| baseline |
winter 2017 |
0.972 |
0.071 |
0.458 |
0.466 |
3.501 |
NaN |
NaN |
| forest |
winter 2017 |
0.954 |
0.048 |
0.355 |
0.418 |
3.144 |
0.551 |
3.420 |
| baseline |
winter 2018 |
0.966 |
0.095 |
0.337 |
0.415 |
1.803 |
NaN |
NaN |
| forest |
winter 2018 |
0.949 |
0.095 |
0.302 |
0.426 |
1.448 |
0.545 |
2.815 |
| baseline |
winter 2019 |
0.992 |
0.158 |
0.417 |
0.481 |
2.479 |
NaN |
NaN |
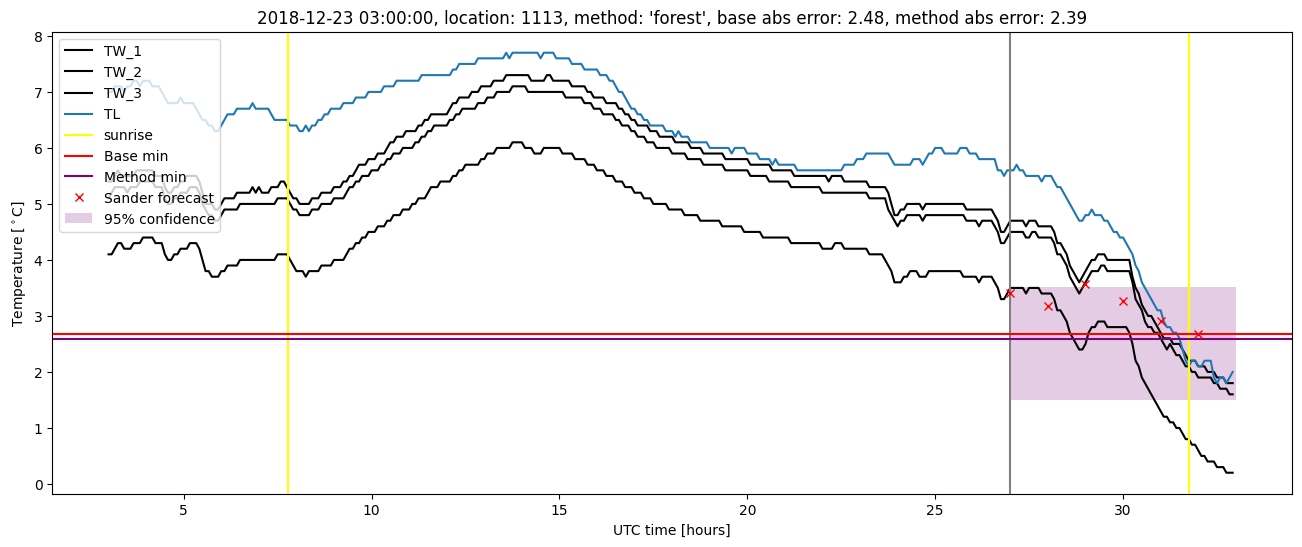
| forest |
winter 2019 |
0.983 |
0.105 |
0.342 |
0.430 |
2.390 |
0.541 |
3.842 |
| baseline |
all |
0.977 |
0.093 |
0.394 |
0.446 |
3.501 |
NaN |
NaN |
| forest |
all |
0.964 |
0.076 |
0.331 |
0.425 |
3.144 |
0.542 |
3.209 |
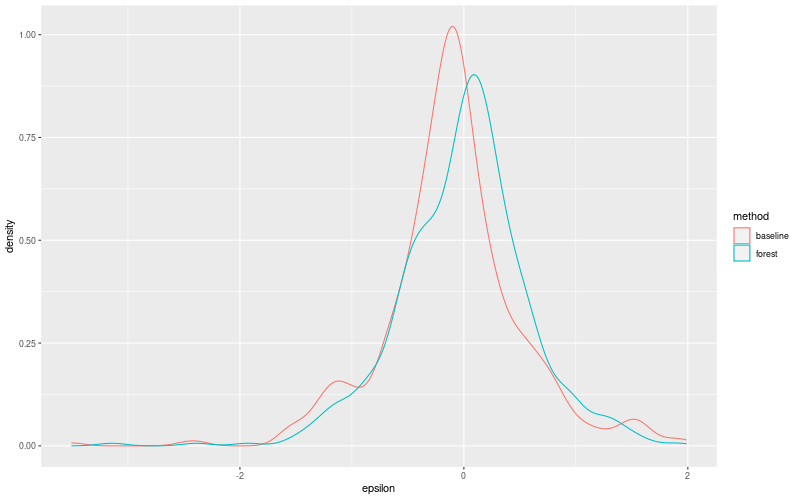
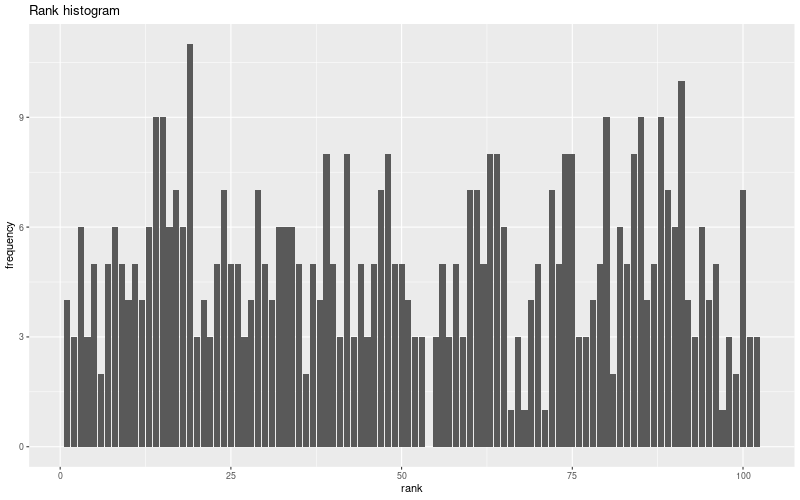
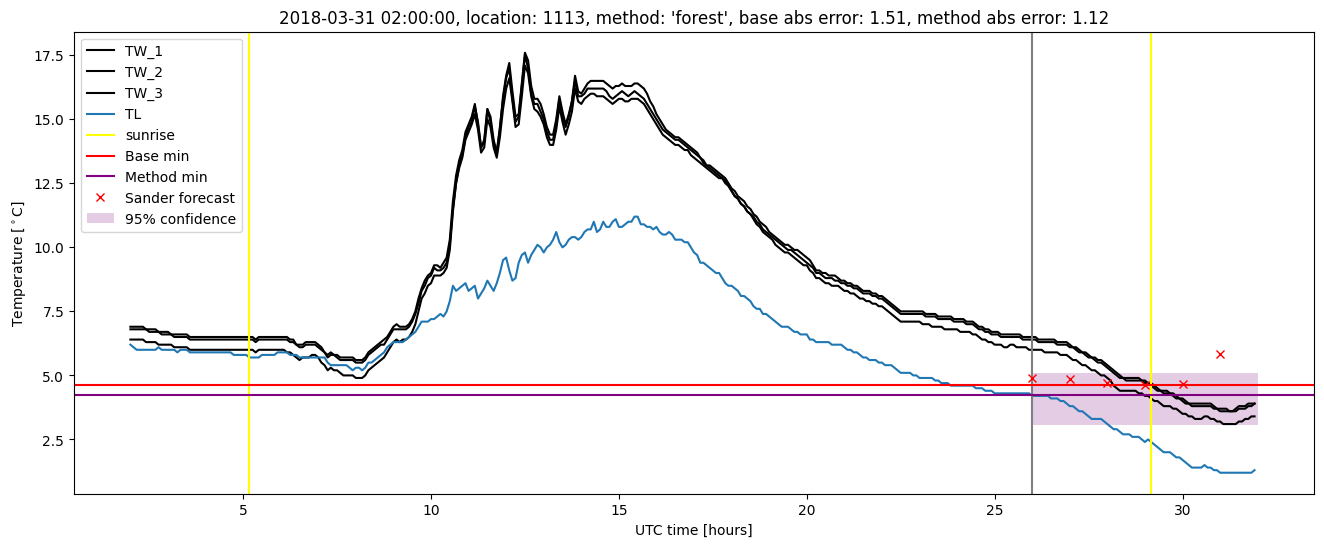
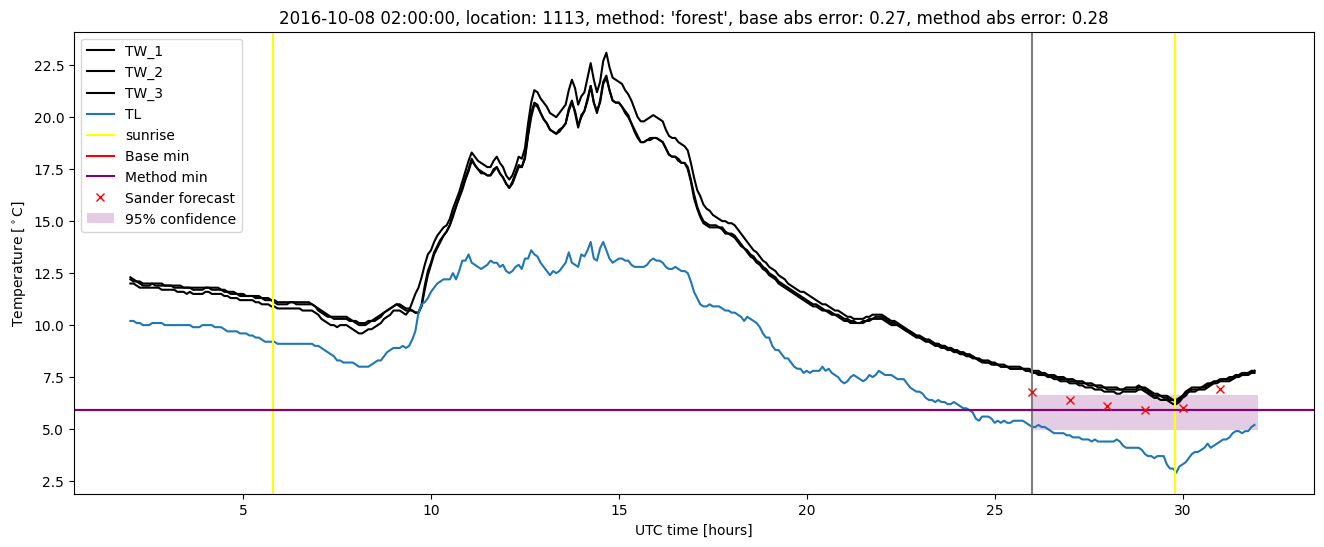
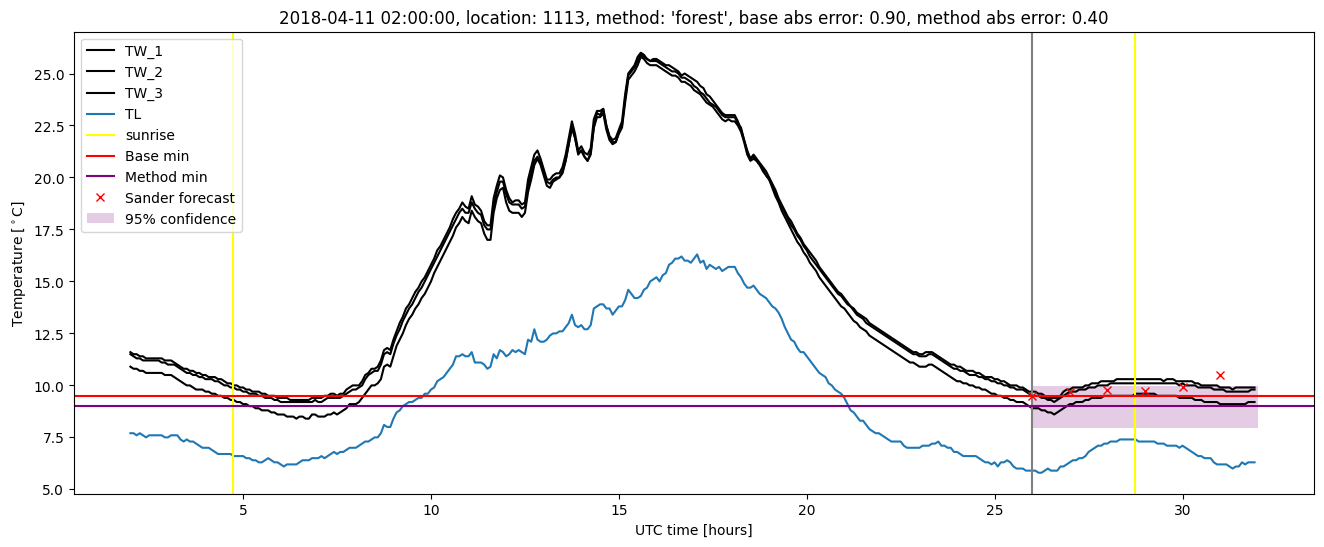
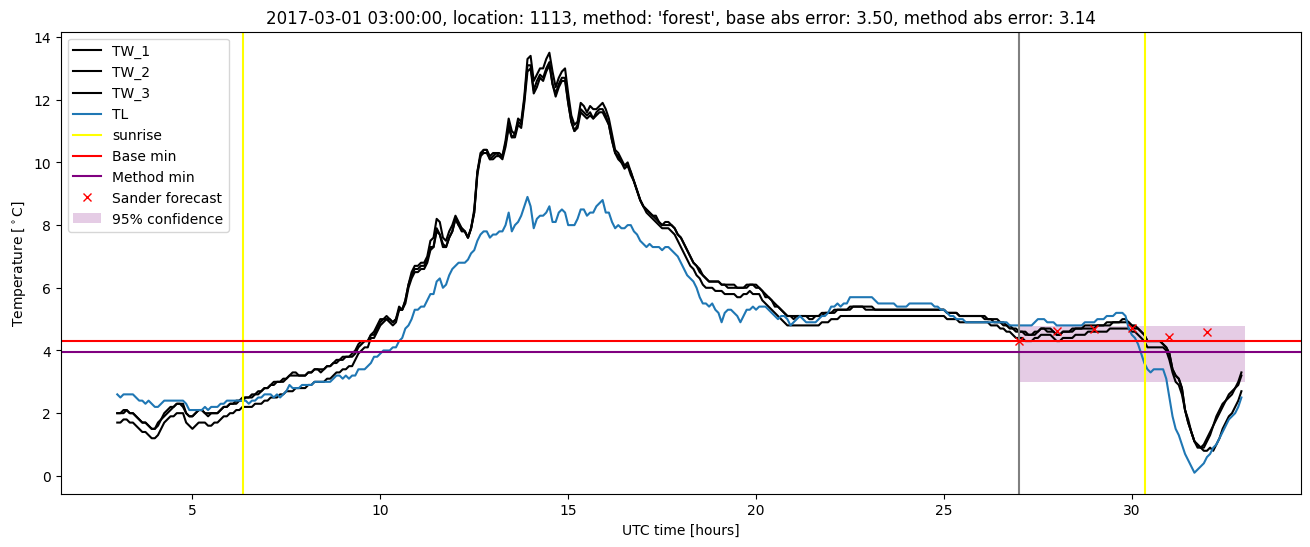
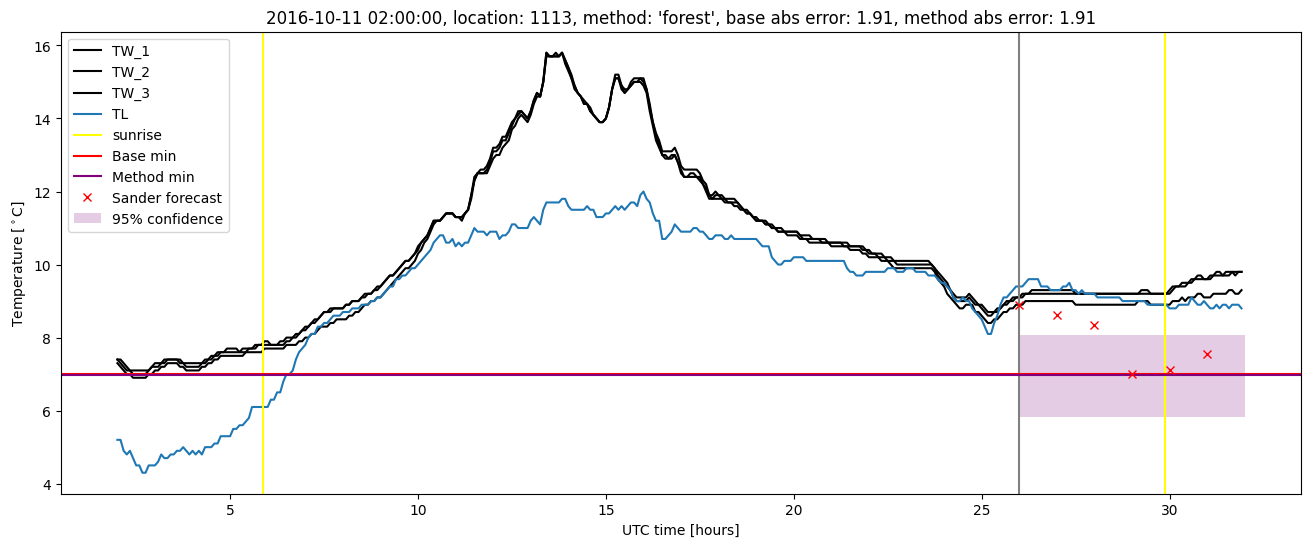
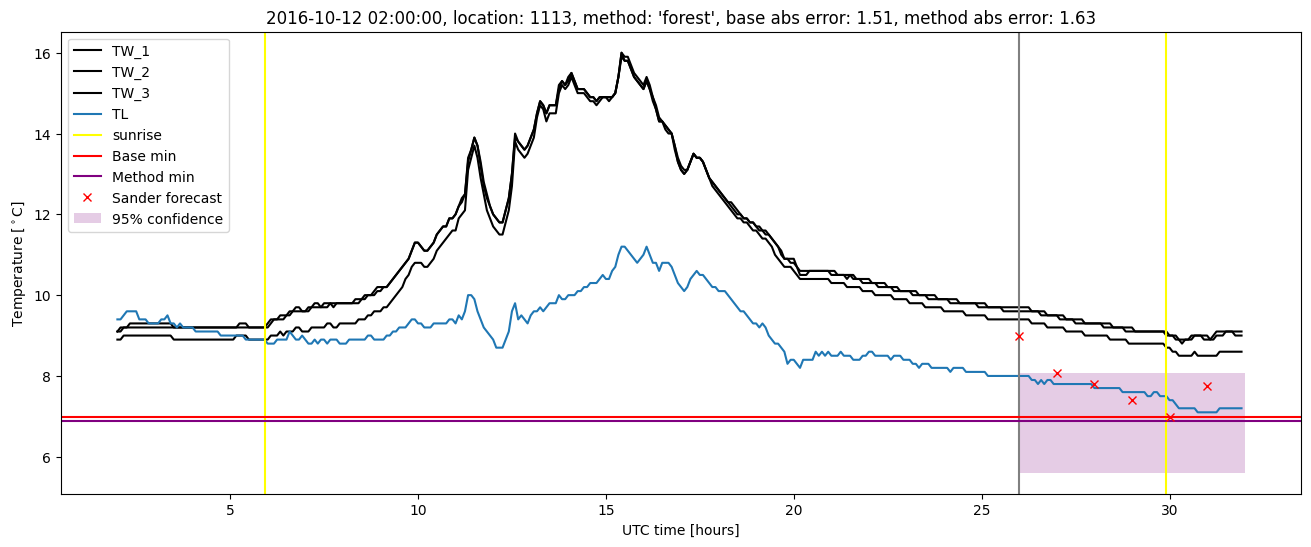
Random forest plots
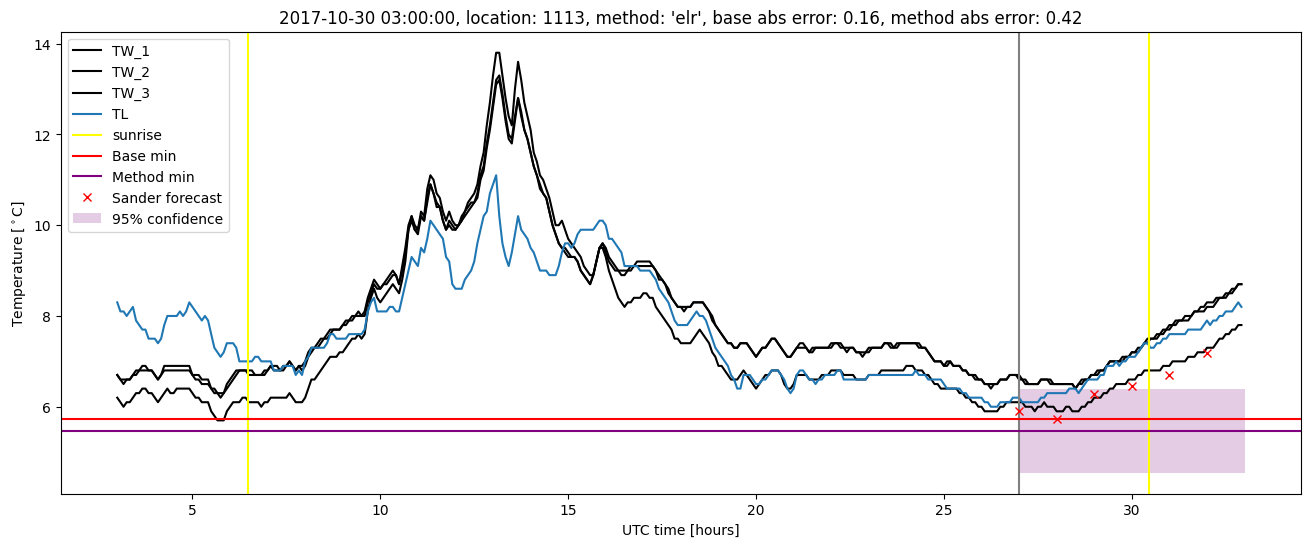
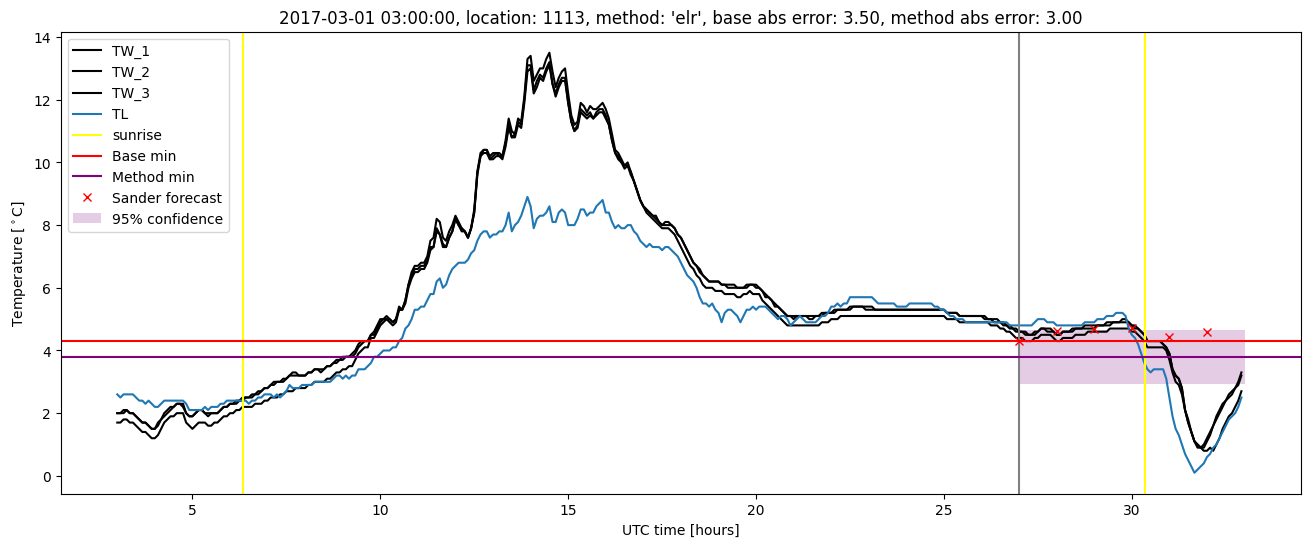
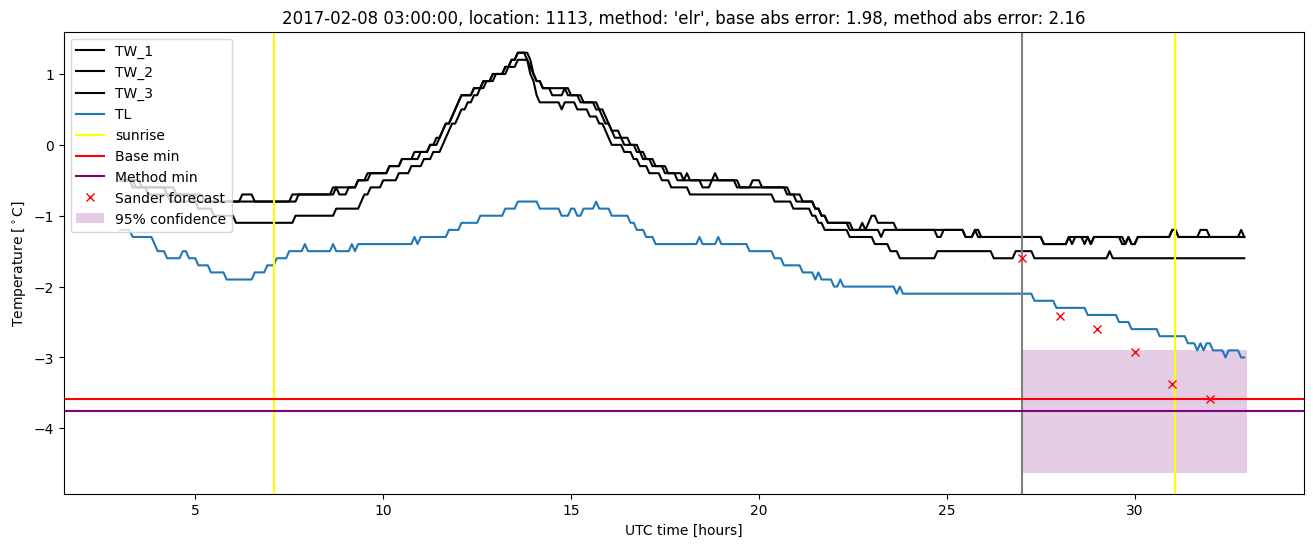
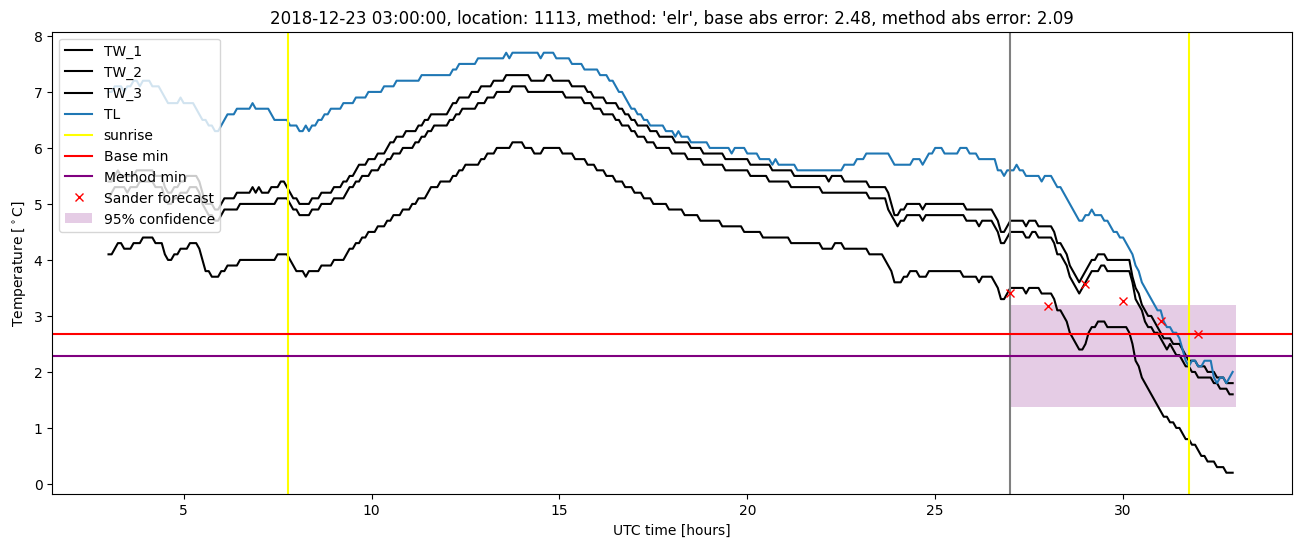
Extended logistic regression results
| names |
period |
power |
significance |
meanSquareError |
absError |
maxError |
CRPS |
IGN |
| baseline |
winter 2016 |
0.979 |
0.067 |
0.336 |
0.397 |
2.364 |
NaN |
NaN |
| elr |
winter 2016 |
0.979 |
0.067 |
0.353 |
0.440 |
2.036 |
0.616 |
5.270 |
| baseline |
winter 2017 |
0.972 |
0.071 |
0.458 |
0.466 |
3.501 |
NaN |
NaN |
| elr |
winter 2017 |
0.963 |
0.048 |
0.431 |
0.475 |
3.002 |
0.661 |
6.458 |
| baseline |
winter 2018 |
0.966 |
0.095 |
0.337 |
0.415 |
1.803 |
NaN |
NaN |
| elr |
winter 2018 |
0.949 |
0.095 |
0.308 |
0.448 |
1.463 |
0.655 |
5.001 |
| baseline |
winter 2019 |
0.992 |
0.158 |
0.417 |
0.481 |
2.479 |
NaN |
NaN |
| elr |
winter 2019 |
0.992 |
0.210 |
0.352 |
0.440 |
2.087 |
0.592 |
4.392 |
| baseline |
all |
0.977 |
0.093 |
0.394 |
0.446 |
3.501 |
NaN |
NaN |
| elr |
all |
0.969 |
0.093 |
0.362 |
0.453 |
3.002 |
0.635 |
5.299 |
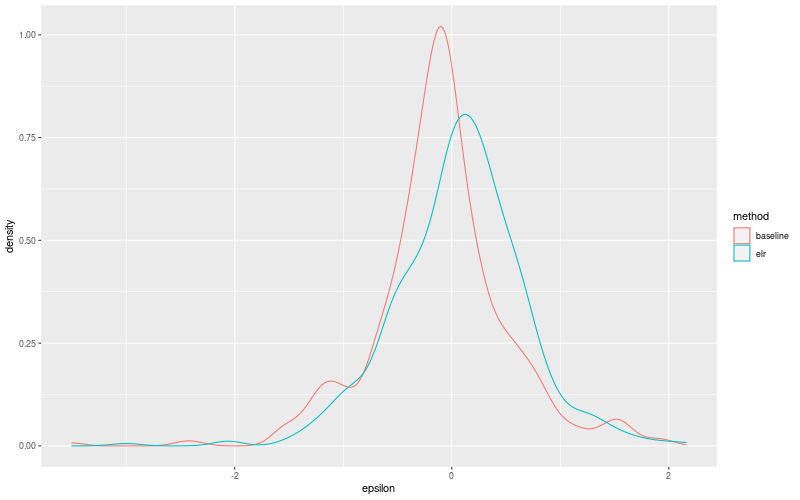
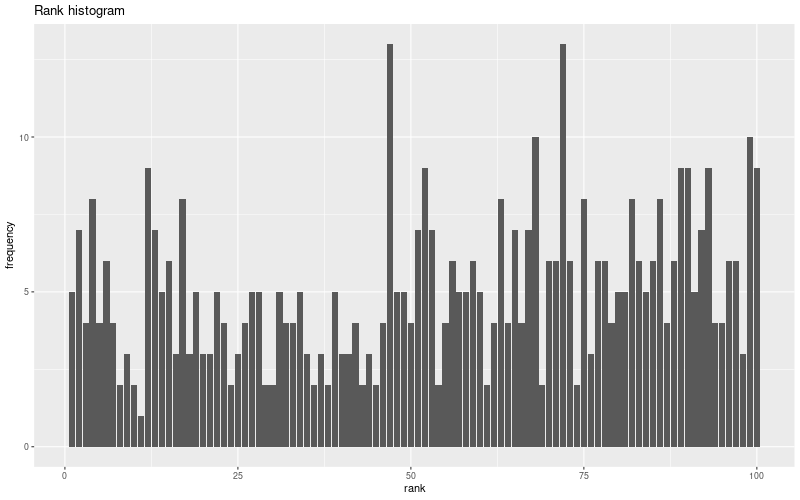
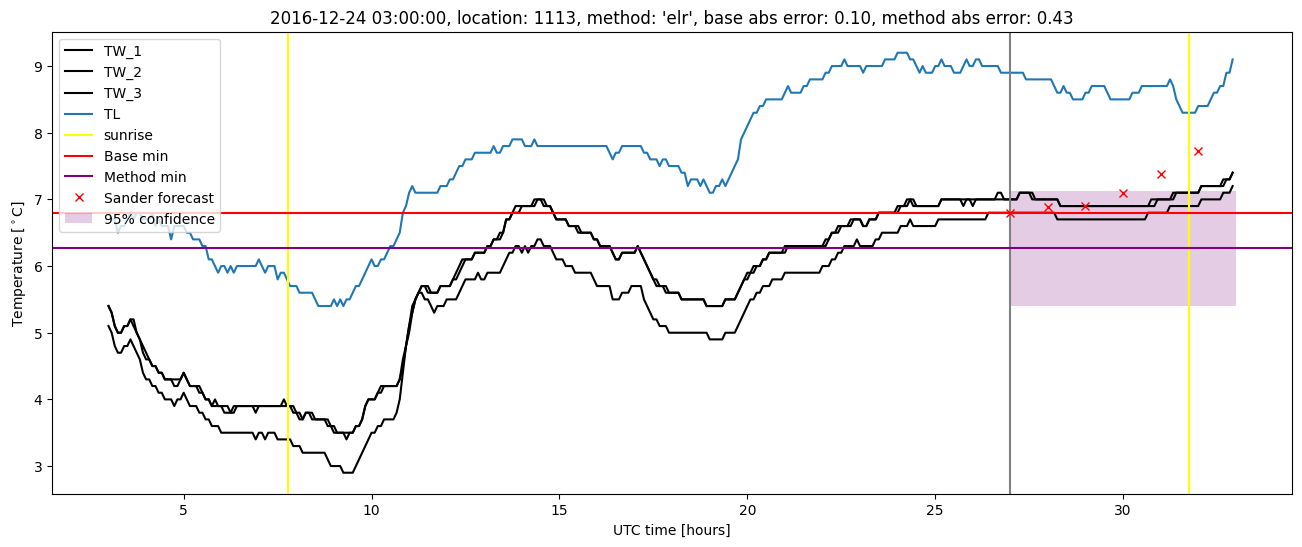
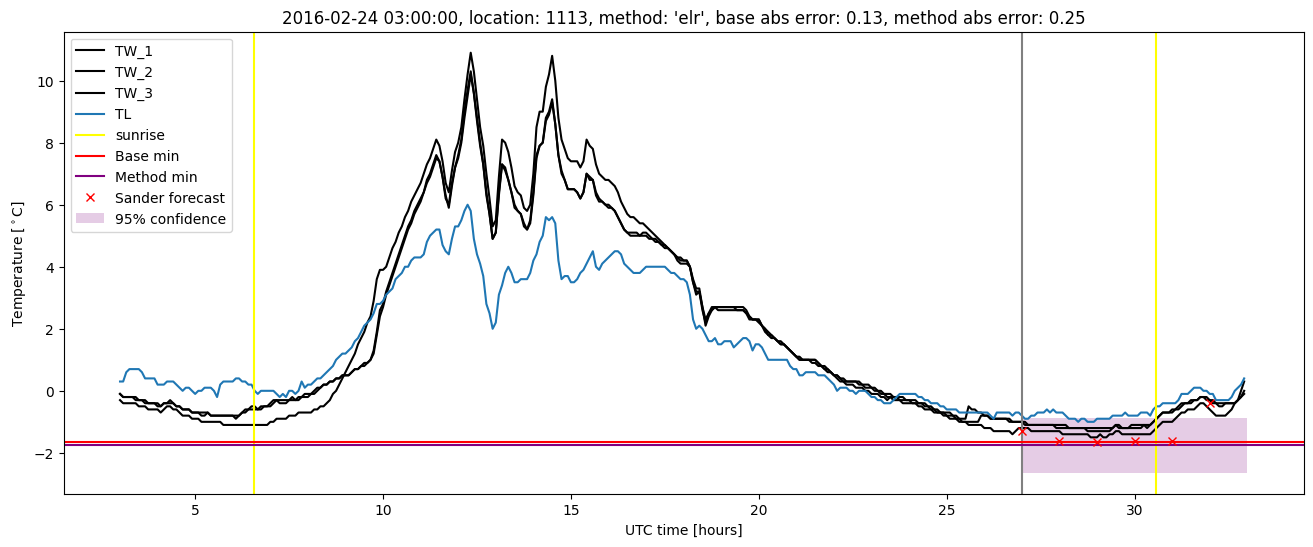
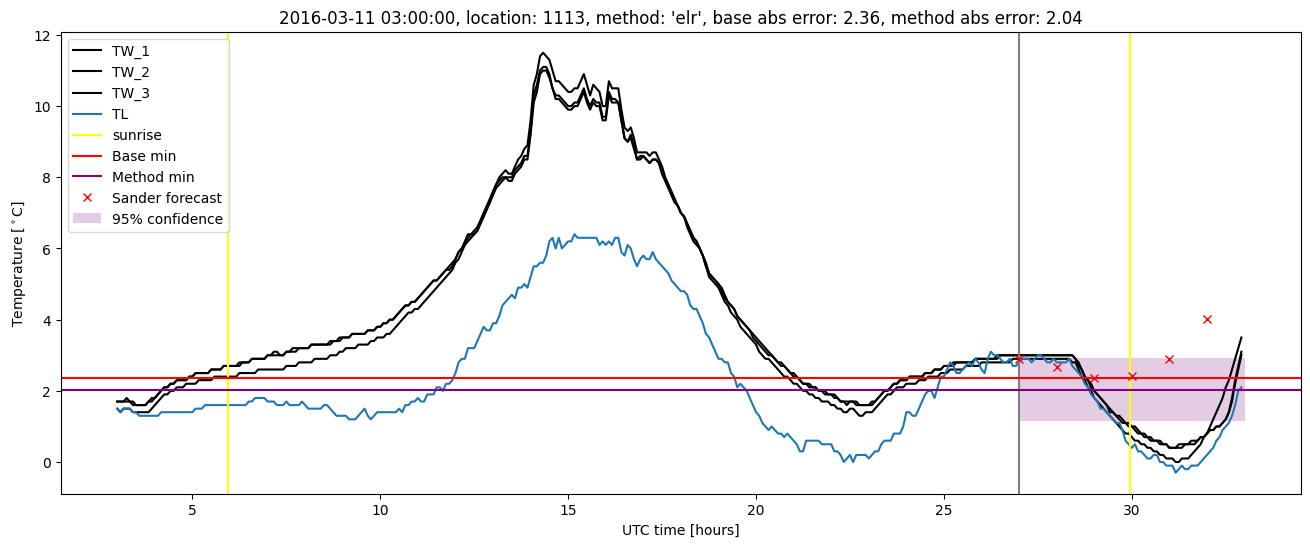
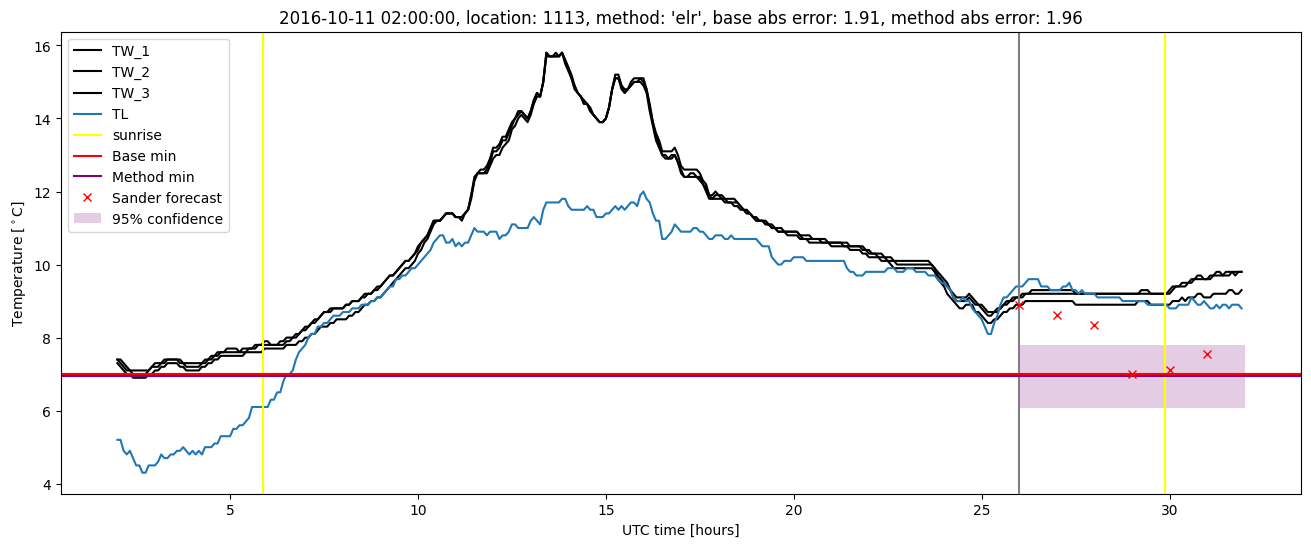
Extended logistic regression plots