GMS location: 1112
Random forest results
| names |
period |
power |
significance |
meanSquareError |
absError |
maxError |
CRPS |
IGN |
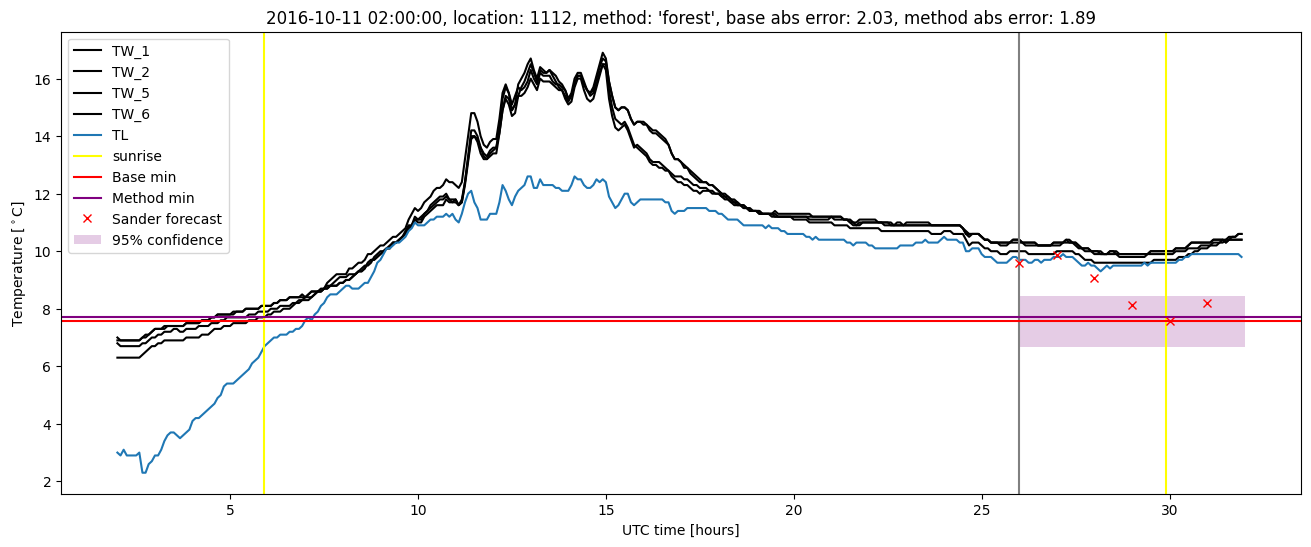
| baseline |
winter 2016 |
0.988 |
0.094 |
0.337 |
0.404 |
2.398 |
NaN |
NaN |
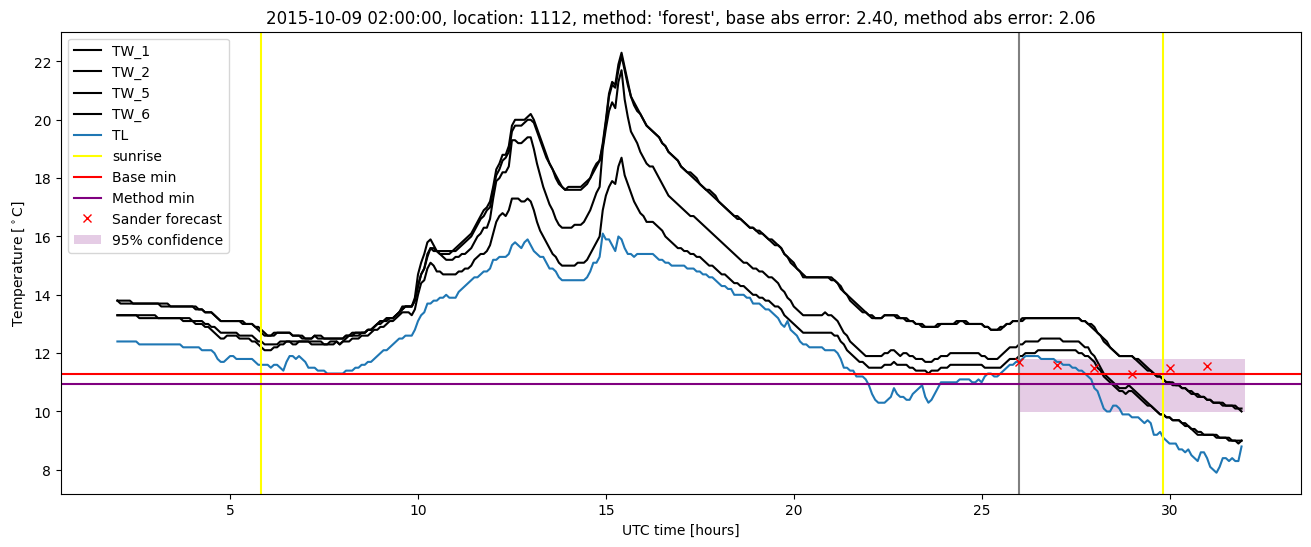
| forest |
winter 2016 |
0.988 |
0.062 |
0.283 |
0.378 |
2.058 |
0.520 |
3.701 |
| baseline |
winter 2017 |
0.991 |
0.000e+00 |
0.463 |
0.481 |
2.653 |
NaN |
NaN |
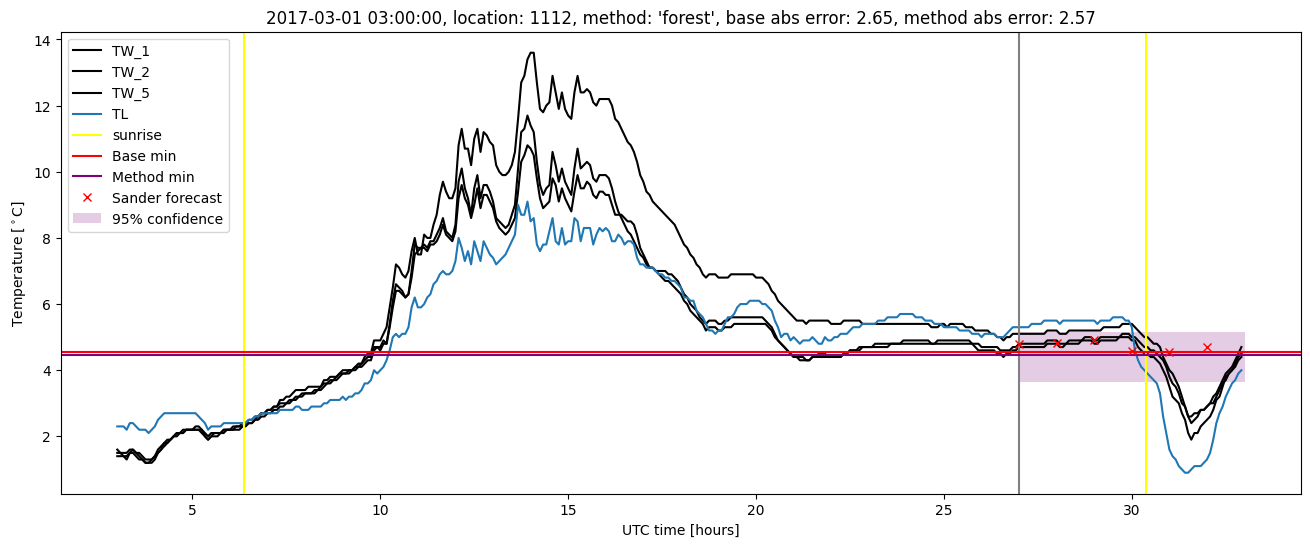
| forest |
winter 2017 |
0.991 |
0.000e+00 |
0.341 |
0.411 |
2.567 |
0.502 |
4.087 |
| baseline |
winter 2018 |
0.980 |
0.094 |
0.296 |
0.412 |
1.924 |
NaN |
NaN |
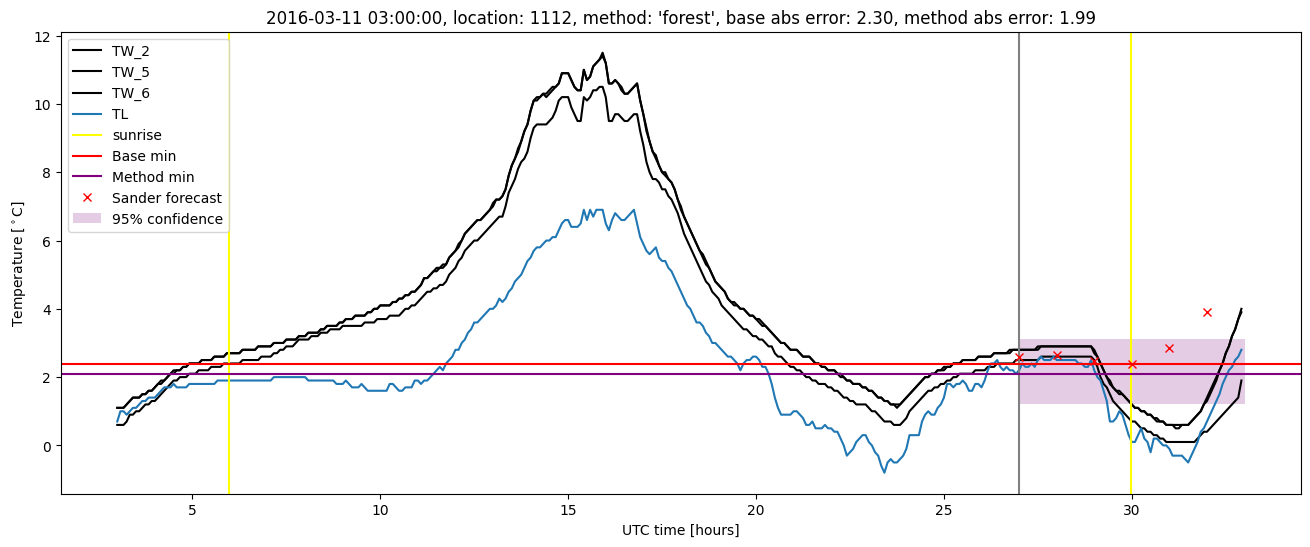
| forest |
winter 2018 |
0.993 |
0.125 |
0.264 |
0.391 |
1.894 |
0.511 |
3.039 |
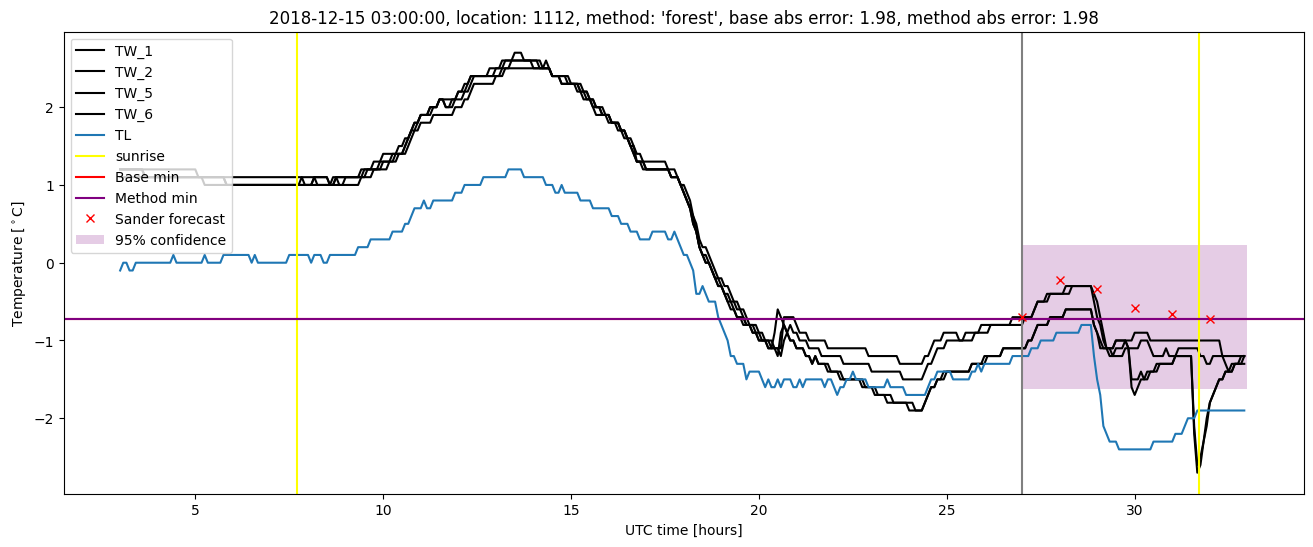
| baseline |
winter 2019 |
0.981 |
0.000e+00 |
0.342 |
0.427 |
1.981 |
NaN |
NaN |
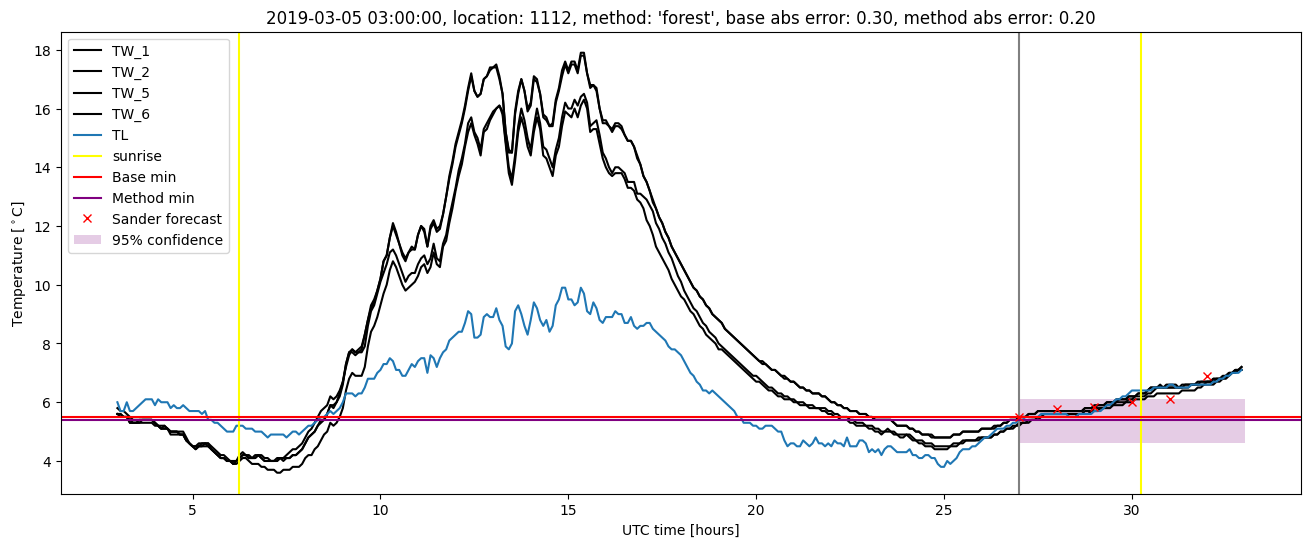
| forest |
winter 2019 |
1.000 |
0.000e+00 |
0.259 |
0.382 |
1.981 |
0.508 |
3.654 |
| baseline |
all |
0.985 |
0.053 |
0.354 |
0.428 |
2.653 |
NaN |
NaN |
| forest |
all |
0.993 |
0.053 |
0.285 |
0.389 |
2.567 |
0.511 |
3.602 |
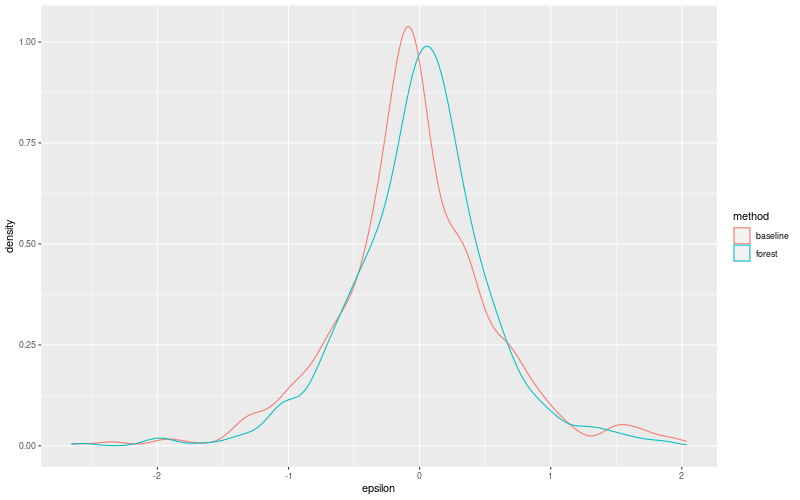
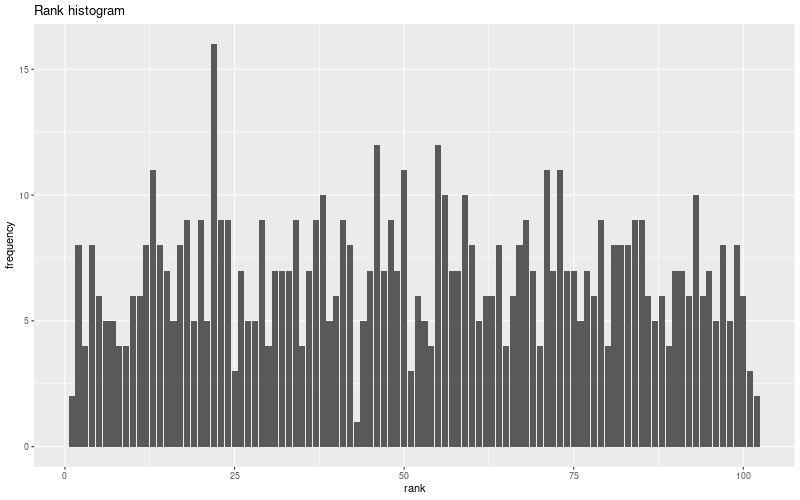
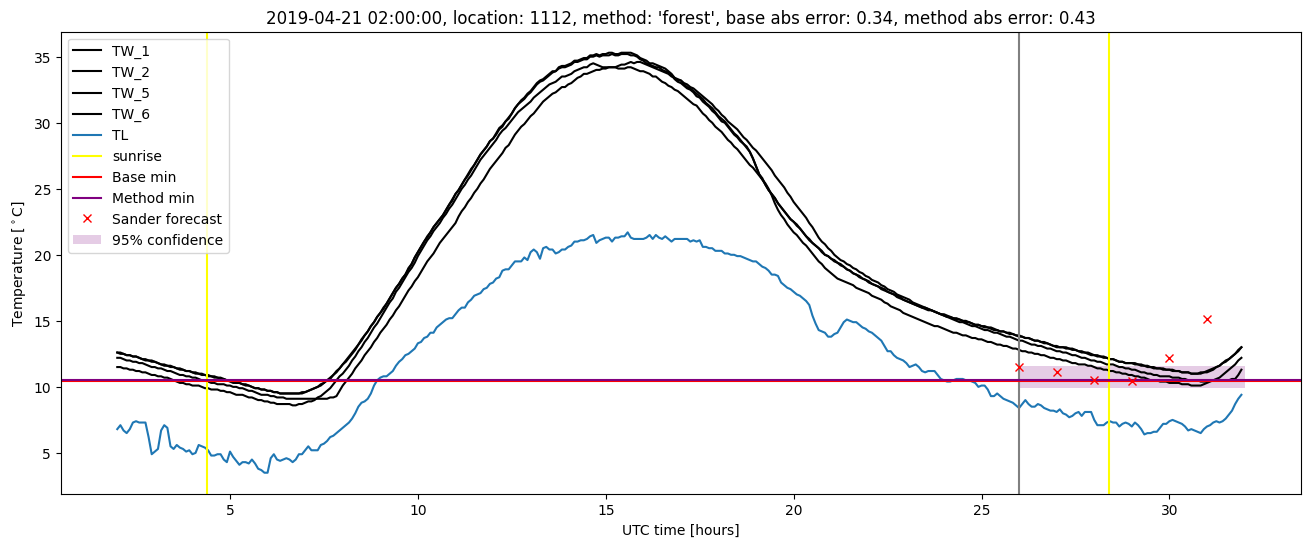
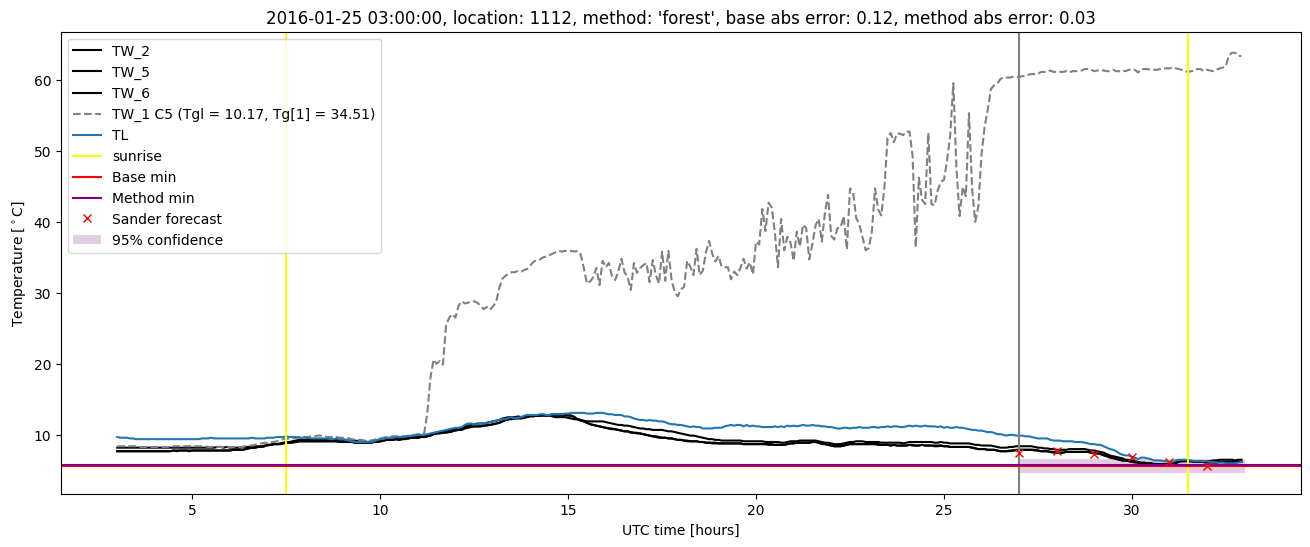
Random forest plots
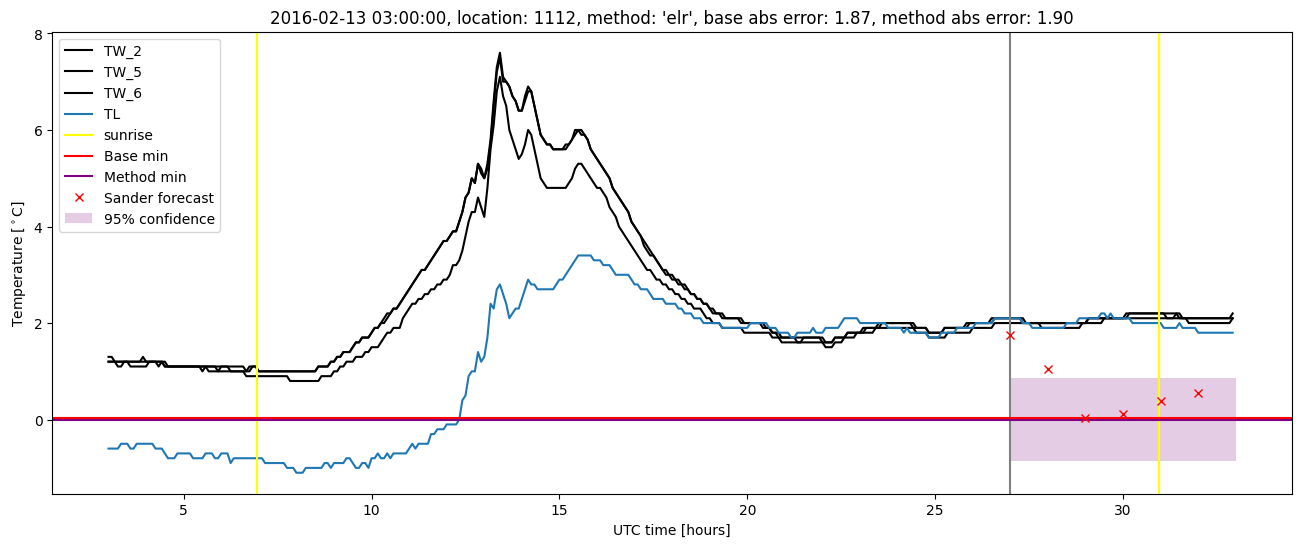
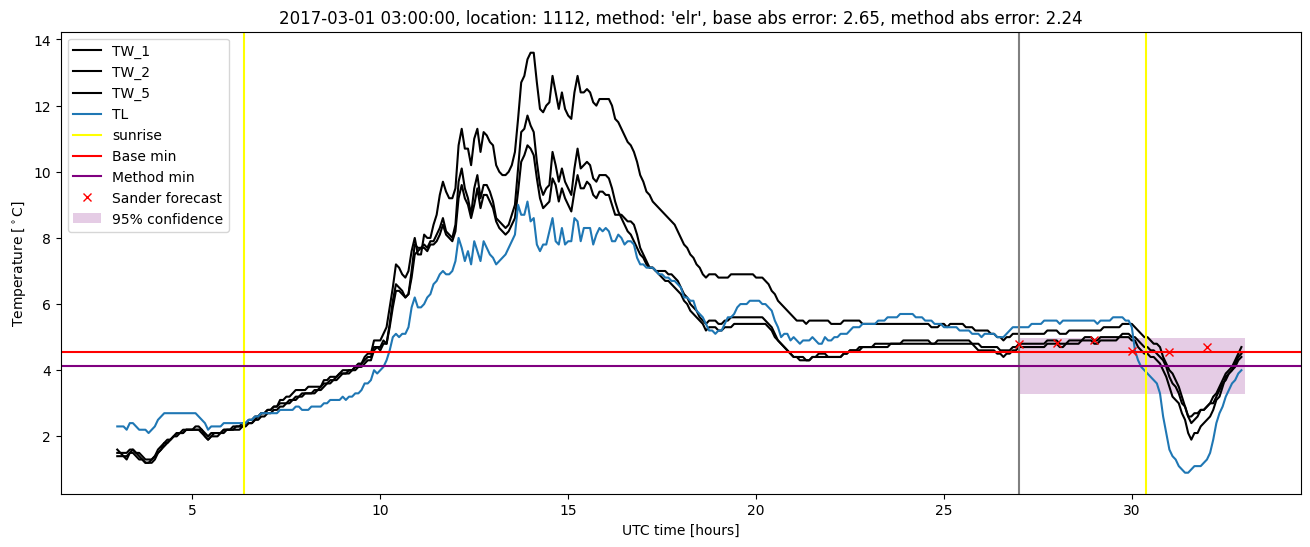
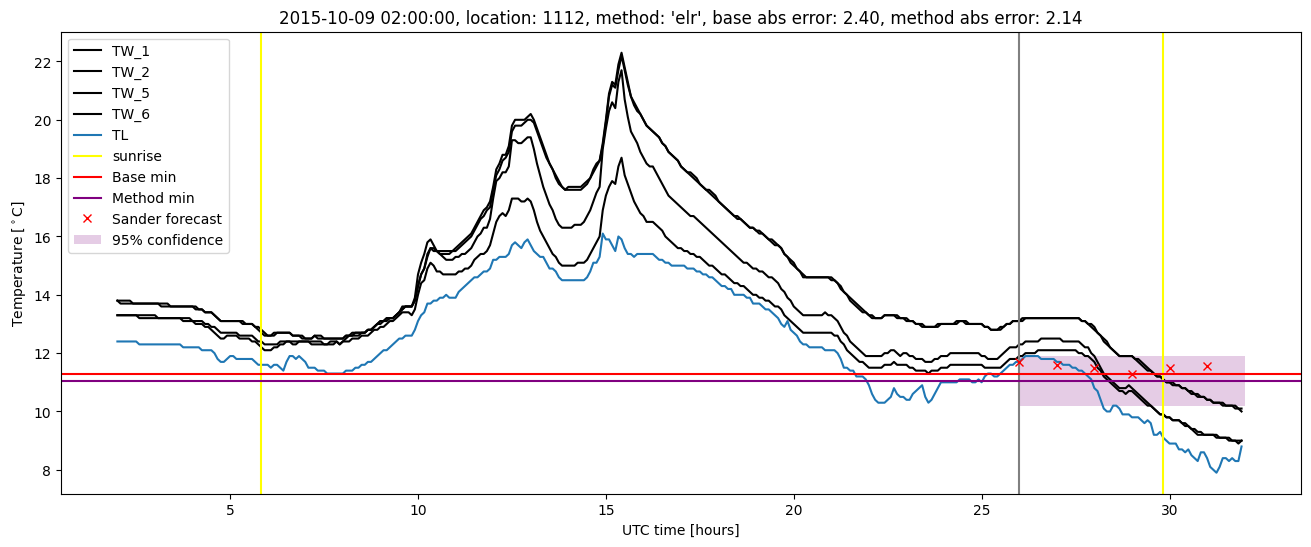
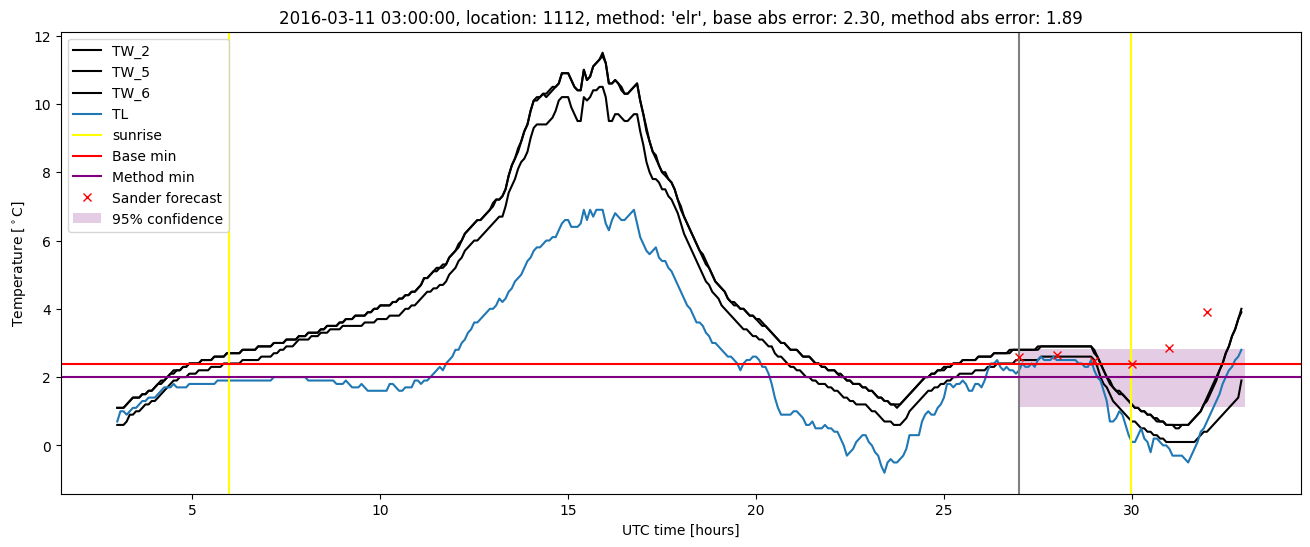
Extended logistic regression results
| names |
period |
power |
significance |
meanSquareError |
absError |
maxError |
CRPS |
IGN |
| baseline |
winter 2016 |
0.988 |
0.094 |
0.337 |
0.404 |
2.398 |
NaN |
NaN |
| elr |
winter 2016 |
0.982 |
0.031 |
0.325 |
0.419 |
2.142 |
0.623 |
6.139 |
| baseline |
winter 2017 |
0.991 |
0.000e+00 |
0.463 |
0.481 |
2.653 |
NaN |
NaN |
| elr |
winter 2017 |
0.982 |
0.028 |
0.387 |
0.446 |
2.240 |
0.564 |
5.505 |
| baseline |
winter 2018 |
0.980 |
0.094 |
0.296 |
0.412 |
1.924 |
NaN |
NaN |
| elr |
winter 2018 |
0.980 |
0.125 |
0.290 |
0.429 |
1.690 |
0.610 |
5.450 |
| baseline |
winter 2019 |
0.981 |
0.000e+00 |
0.342 |
0.427 |
1.981 |
NaN |
NaN |
| elr |
winter 2019 |
1.000 |
0.000e+00 |
0.287 |
0.407 |
1.676 |
0.543 |
4.396 |
| baseline |
all |
0.985 |
0.053 |
0.354 |
0.428 |
2.653 |
NaN |
NaN |
| elr |
all |
0.986 |
0.053 |
0.320 |
0.424 |
2.240 |
0.587 |
5.398 |
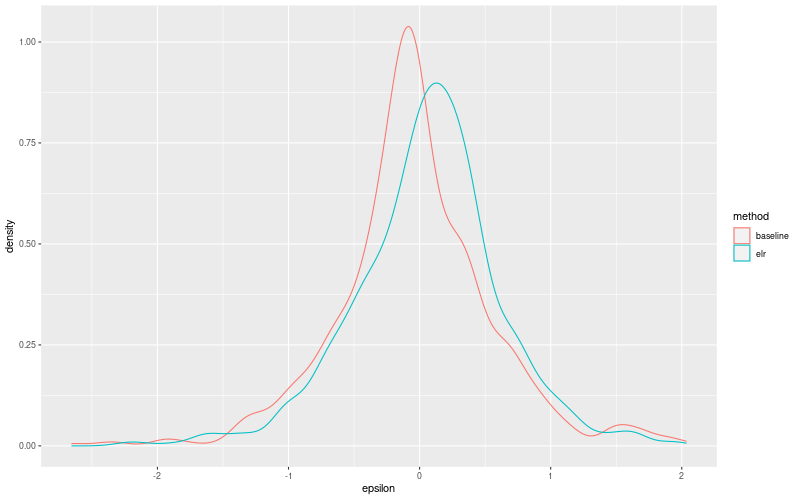
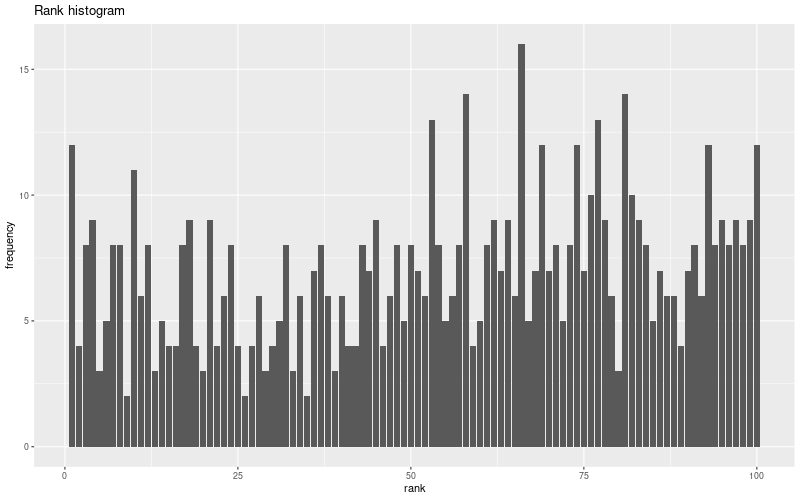
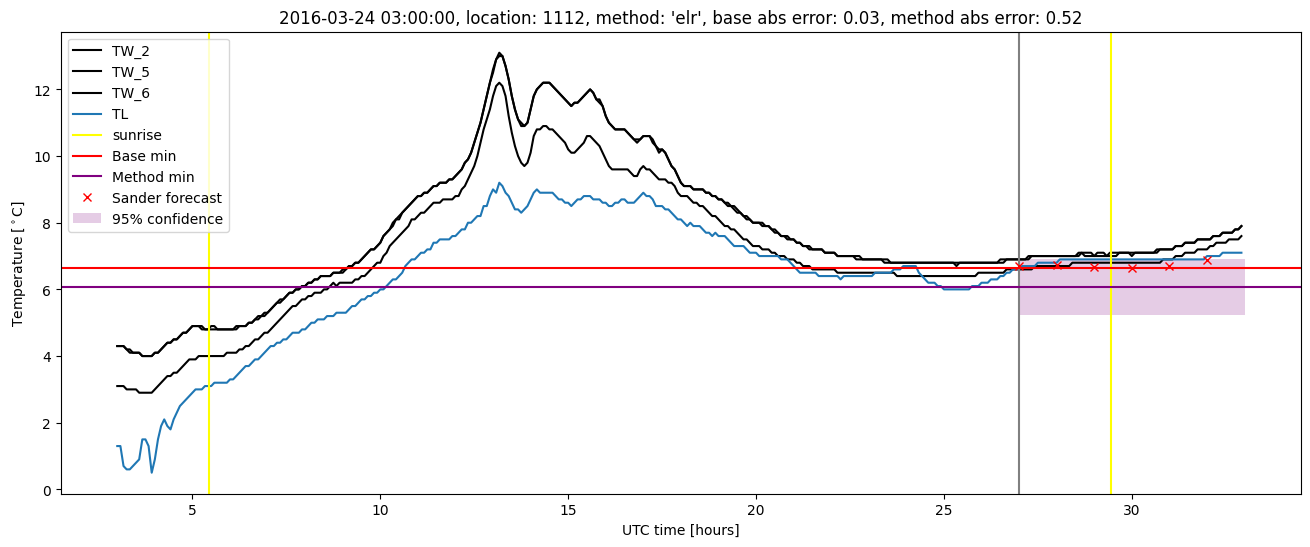
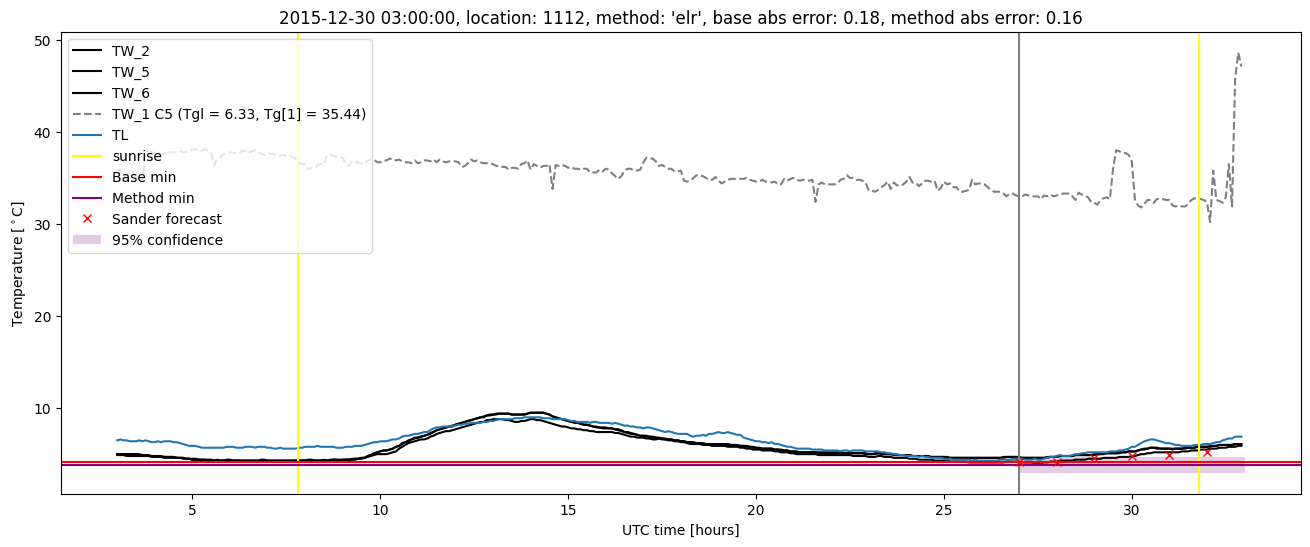
Extended logistic regression plots