GMS location: 1110
Random forest results
| names |
period |
power |
significance |
meanSquareError |
absError |
maxError |
CRPS |
IGN |
| baseline |
winter 2016 |
0.994 |
0.059 |
0.396 |
0.464 |
2.372 |
NaN |
NaN |
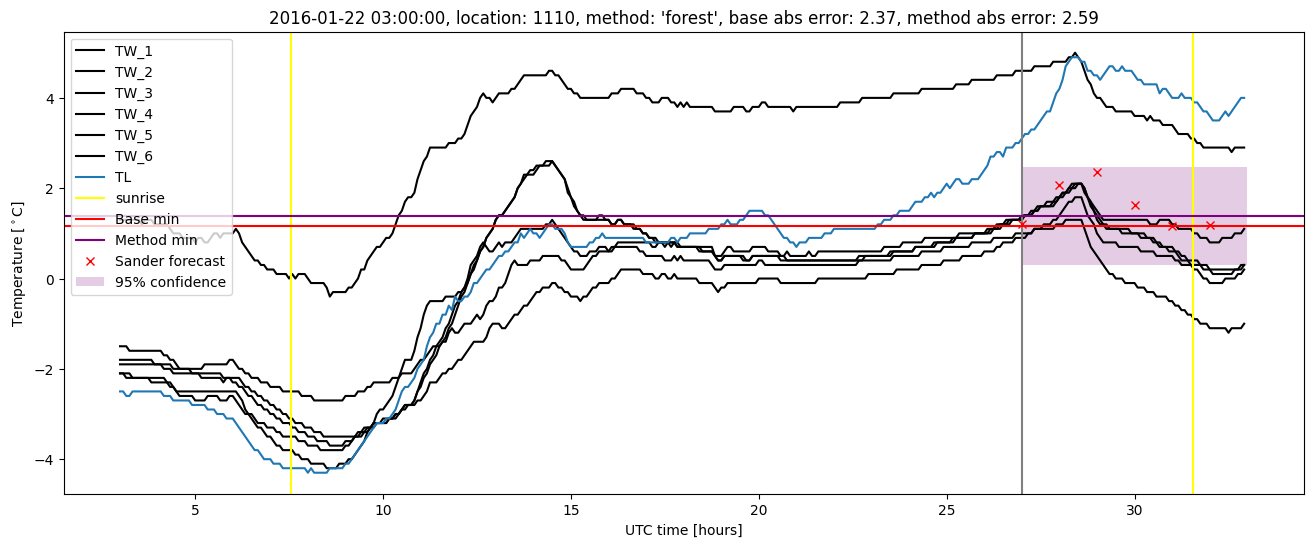
| forest |
winter 2016 |
0.971 |
0.029 |
0.372 |
0.450 |
2.586 |
0.498 |
2.448 |
| baseline |
winter 2017 |
0.953 |
0.133 |
0.495 |
0.501 |
3.640 |
NaN |
NaN |
| forest |
winter 2017 |
0.953 |
0.067 |
0.453 |
0.473 |
3.363 |
0.512 |
3.592 |
| baseline |
winter 2018 |
0.977 |
0.059 |
0.367 |
0.438 |
1.899 |
NaN |
NaN |
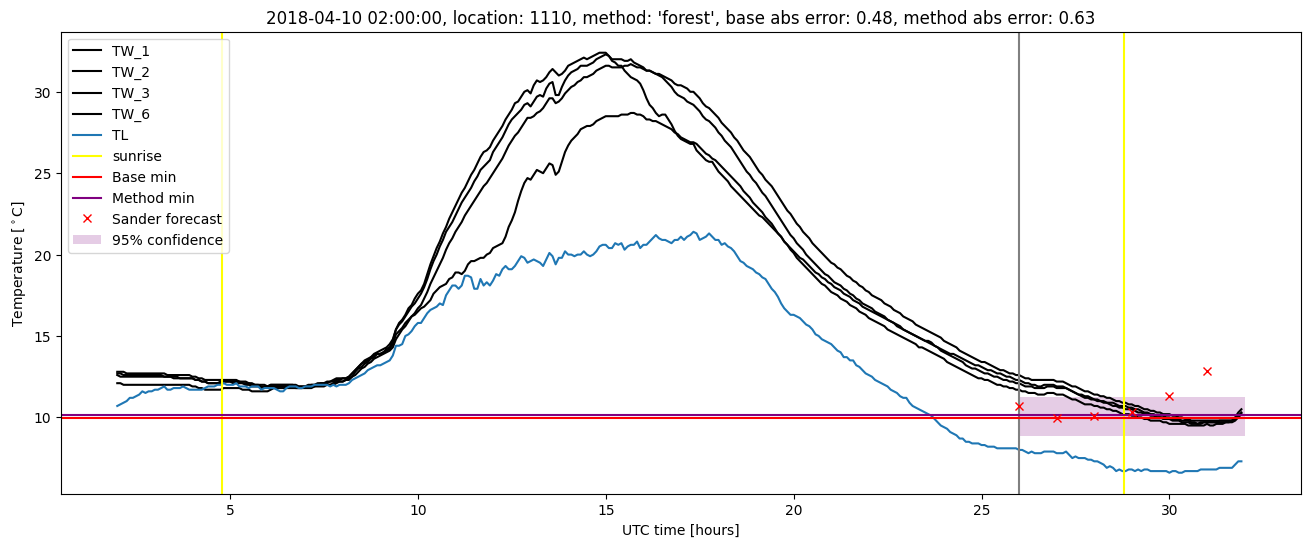
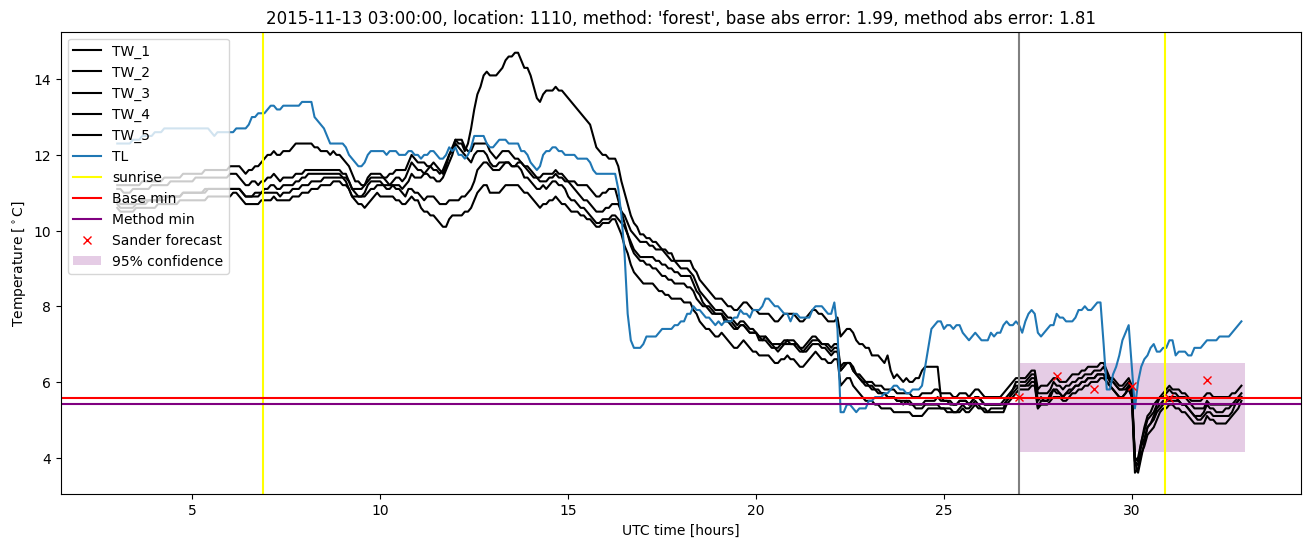
| forest |
winter 2018 |
0.977 |
0.029 |
0.322 |
0.438 |
1.629 |
0.519 |
2.819 |
| baseline |
winter 2019 |
0.993 |
0.000e+00 |
0.331 |
0.407 |
1.786 |
NaN |
NaN |
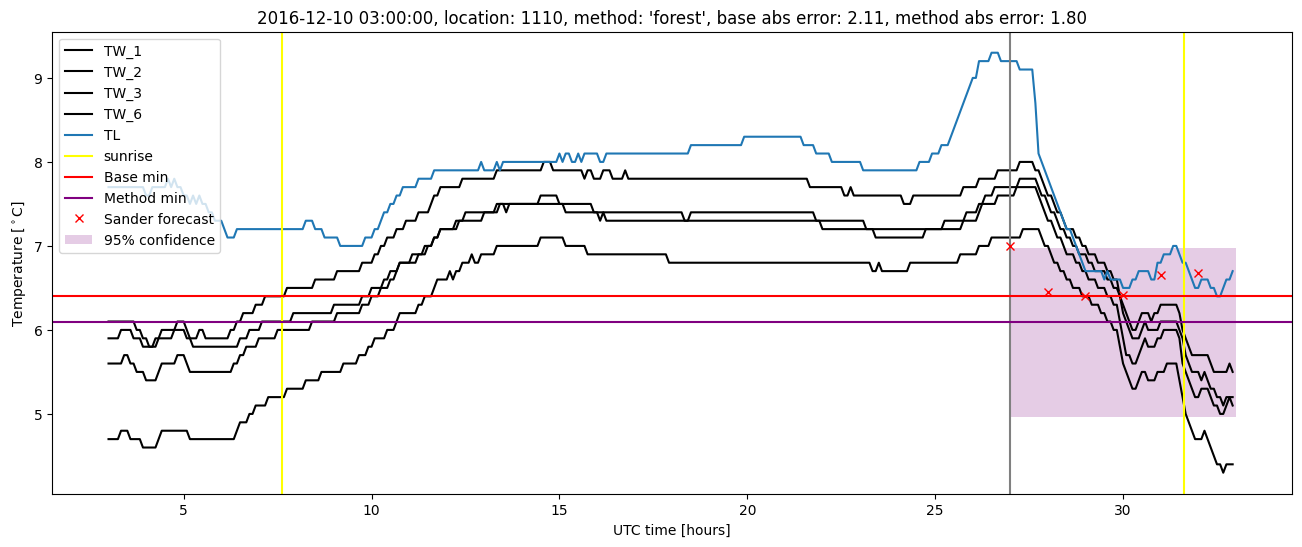
| forest |
winter 2019 |
0.985 |
0.000e+00 |
0.238 |
0.350 |
1.622 |
0.505 |
2.291 |
| baseline |
all |
0.982 |
0.076 |
0.396 |
0.453 |
3.640 |
NaN |
NaN |
| forest |
all |
0.972 |
0.038 |
0.347 |
0.429 |
3.363 |
0.508 |
2.759 |
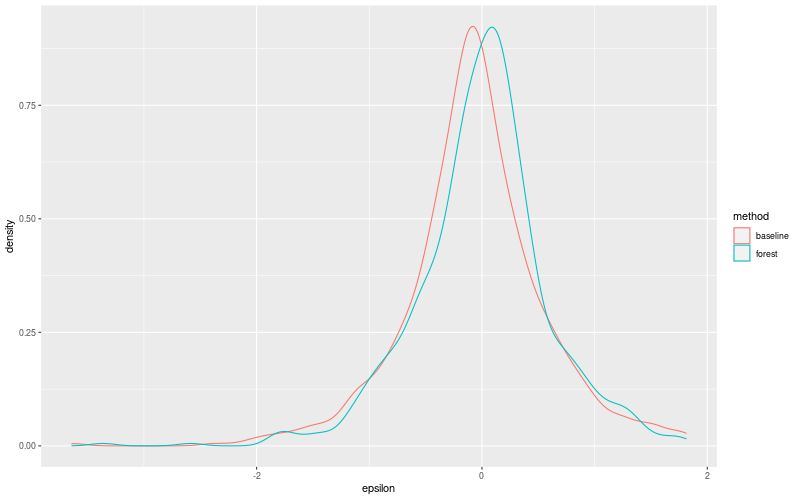
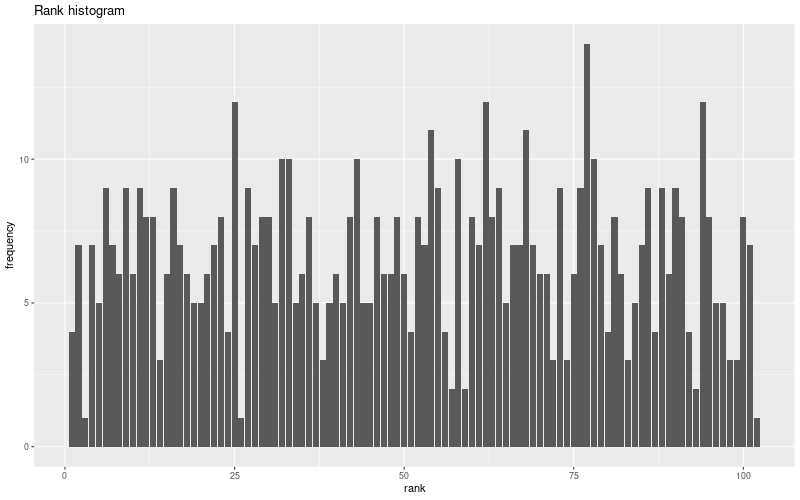
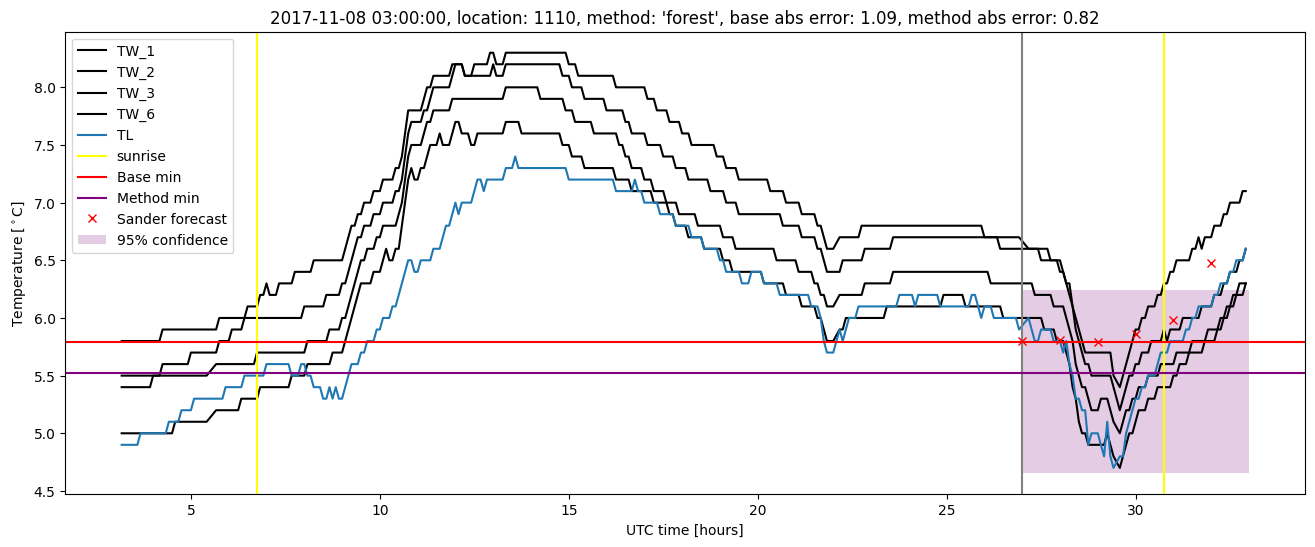
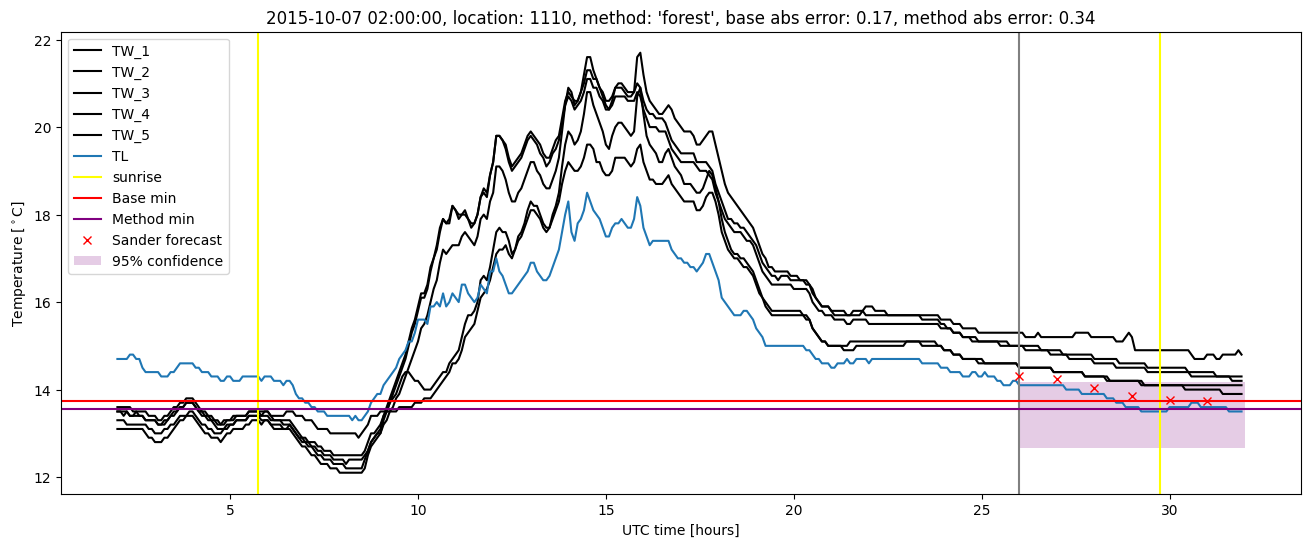
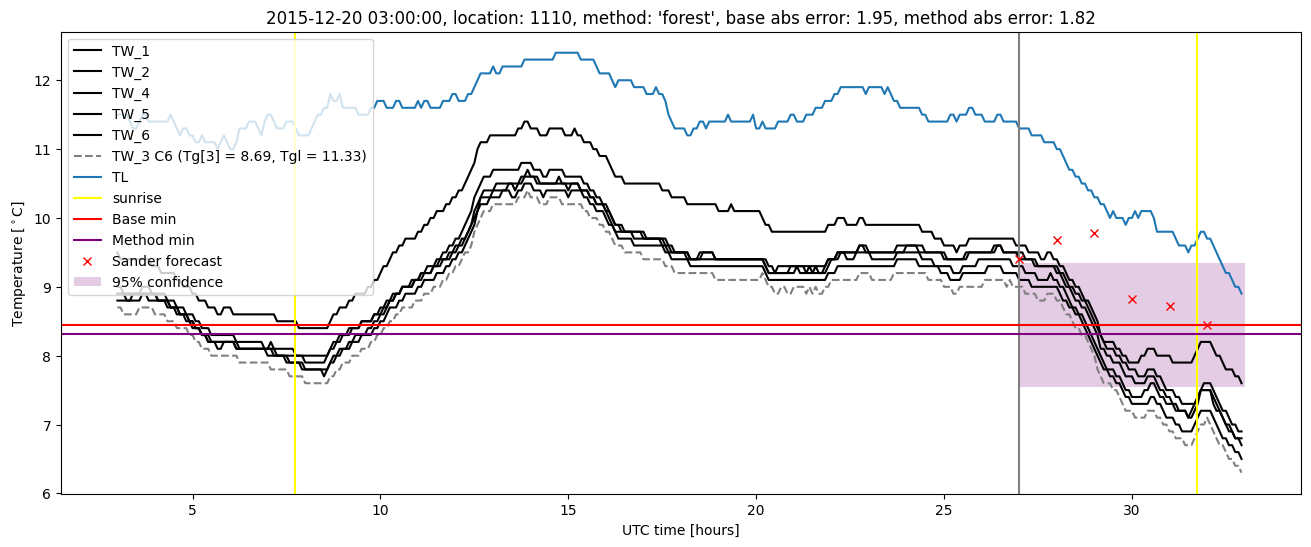
Random forest plots

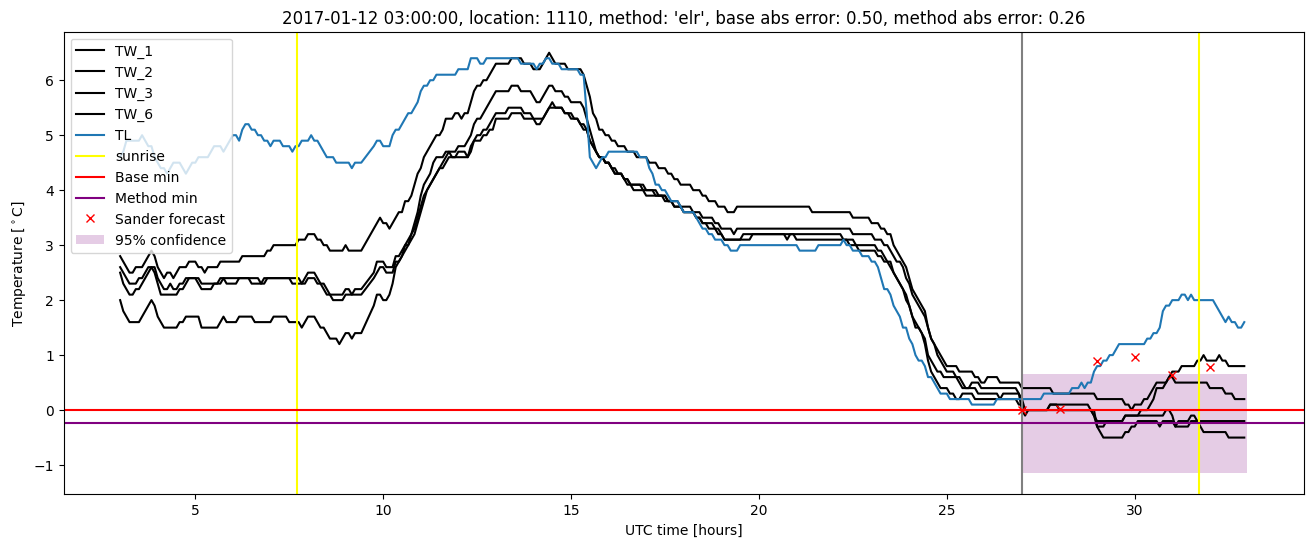
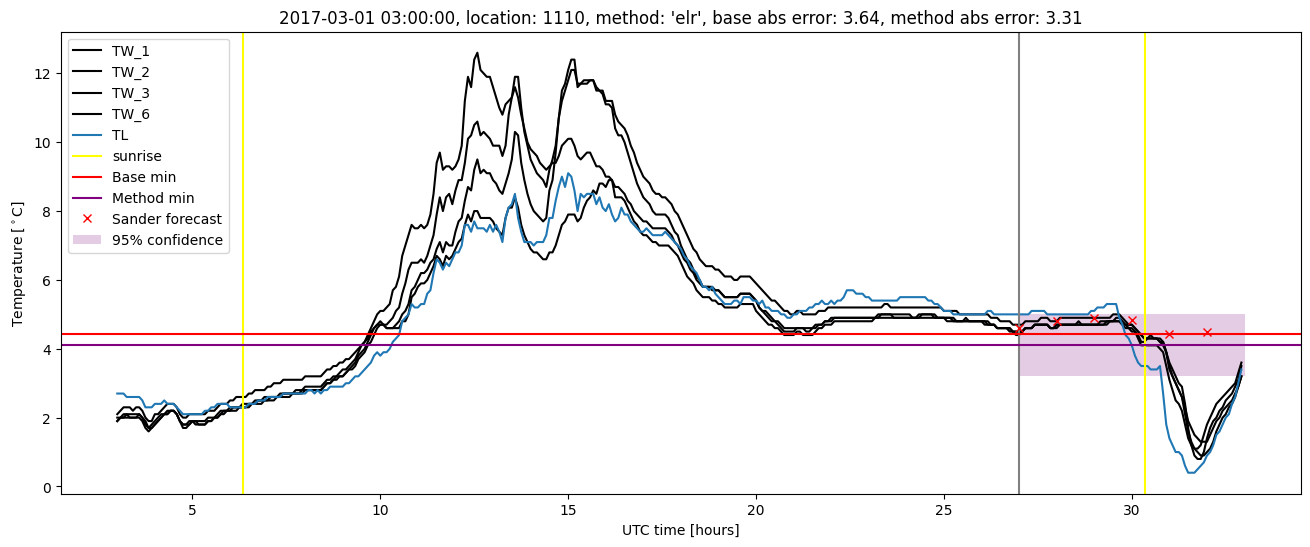
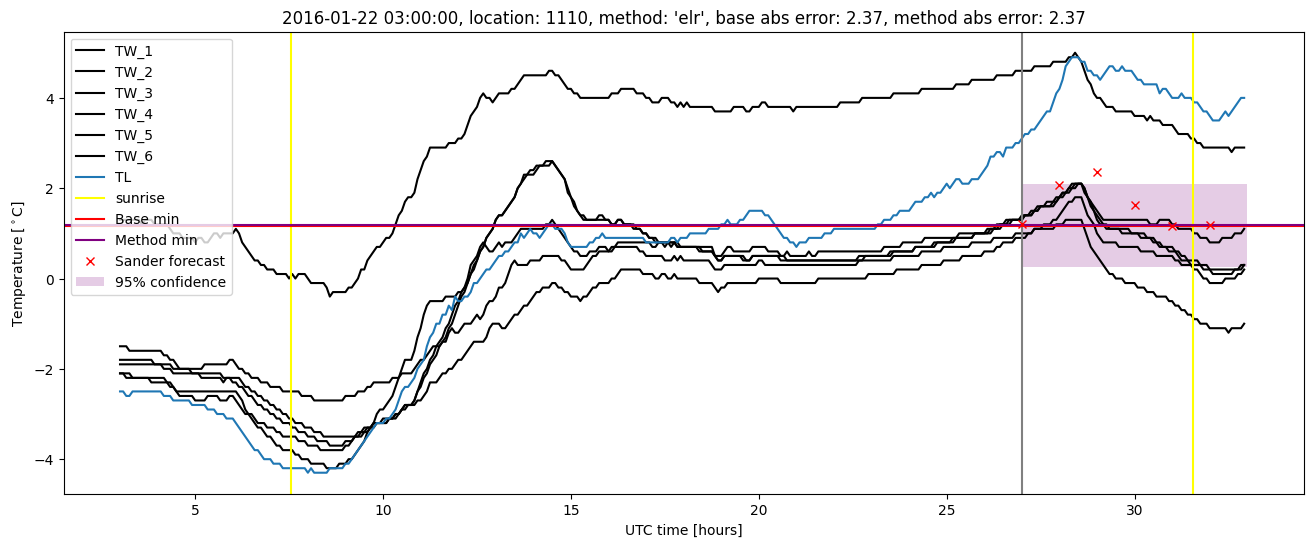
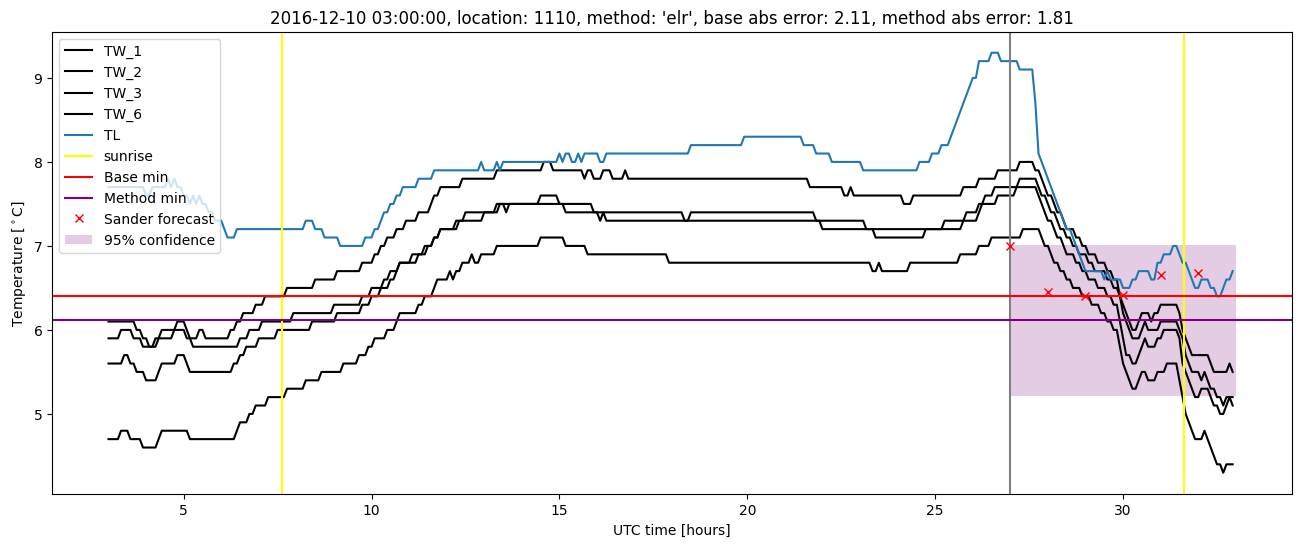
Extended logistic regression results
| names |
period |
power |
significance |
meanSquareError |
absError |
maxError |
CRPS |
IGN |
| baseline |
winter 2016 |
0.994 |
0.059 |
0.396 |
0.464 |
2.372 |
NaN |
NaN |
| elr |
winter 2016 |
0.971 |
0.029 |
0.377 |
0.466 |
2.375 |
0.563 |
3.992 |
| baseline |
winter 2017 |
0.953 |
0.133 |
0.495 |
0.501 |
3.640 |
NaN |
NaN |
| elr |
winter 2017 |
0.953 |
0.044 |
0.457 |
0.481 |
3.310 |
0.563 |
4.300 |
| baseline |
winter 2018 |
0.977 |
0.059 |
0.367 |
0.438 |
1.899 |
NaN |
NaN |
| elr |
winter 2018 |
0.954 |
0.059 |
0.334 |
0.459 |
1.752 |
0.582 |
4.013 |
| baseline |
winter 2019 |
0.993 |
0.000e+00 |
0.331 |
0.407 |
1.786 |
NaN |
NaN |
| elr |
winter 2019 |
1.000 |
0.053 |
0.254 |
0.365 |
1.737 |
0.530 |
3.065 |
| baseline |
all |
0.982 |
0.076 |
0.396 |
0.453 |
3.640 |
NaN |
NaN |
| elr |
all |
0.971 |
0.045 |
0.357 |
0.445 |
3.310 |
0.560 |
3.856 |
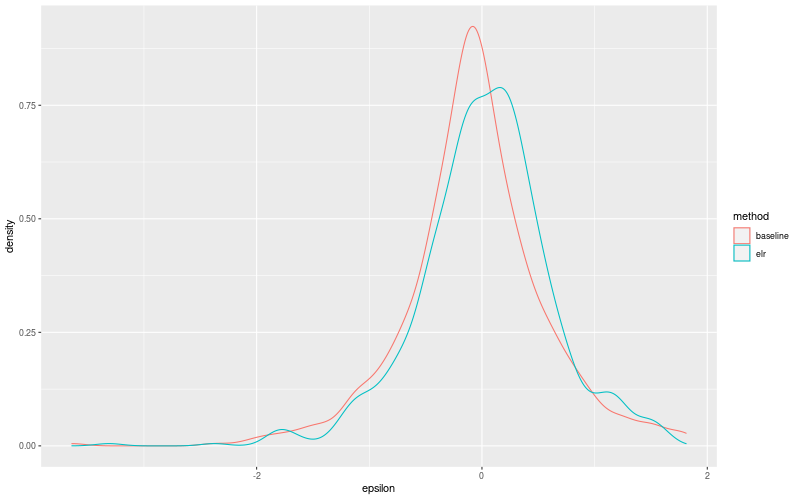
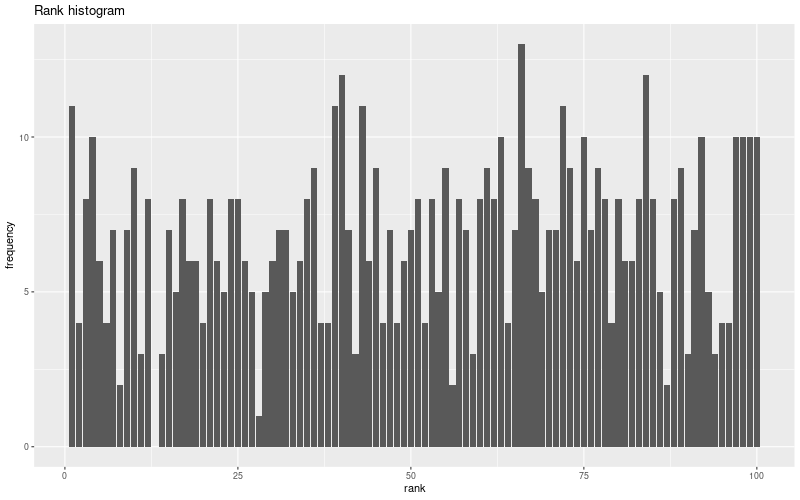
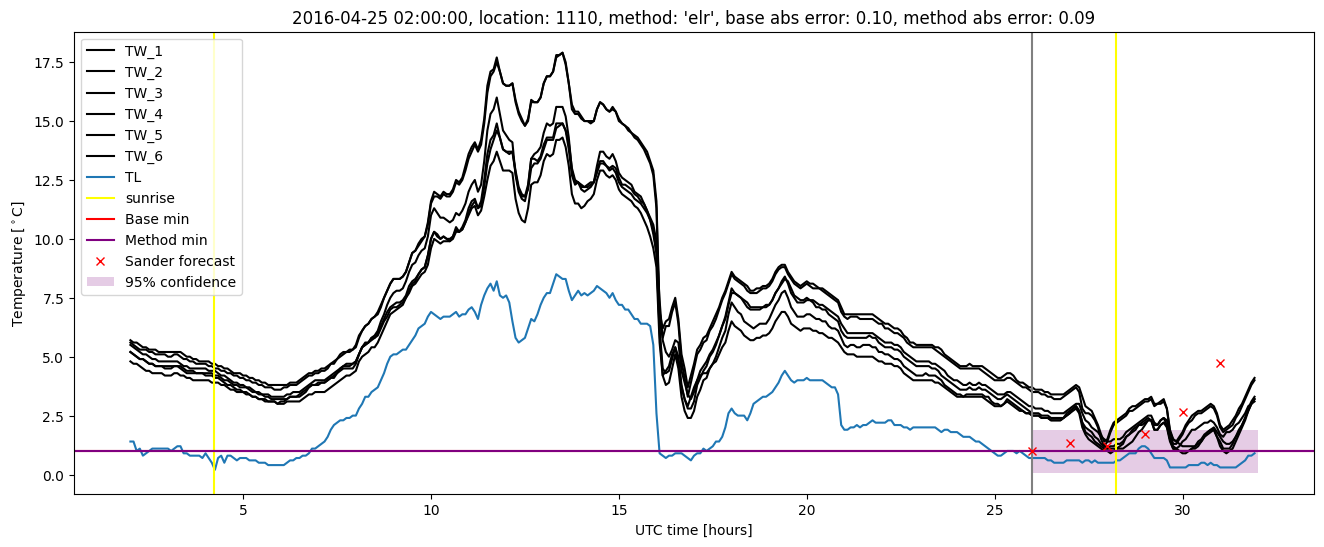
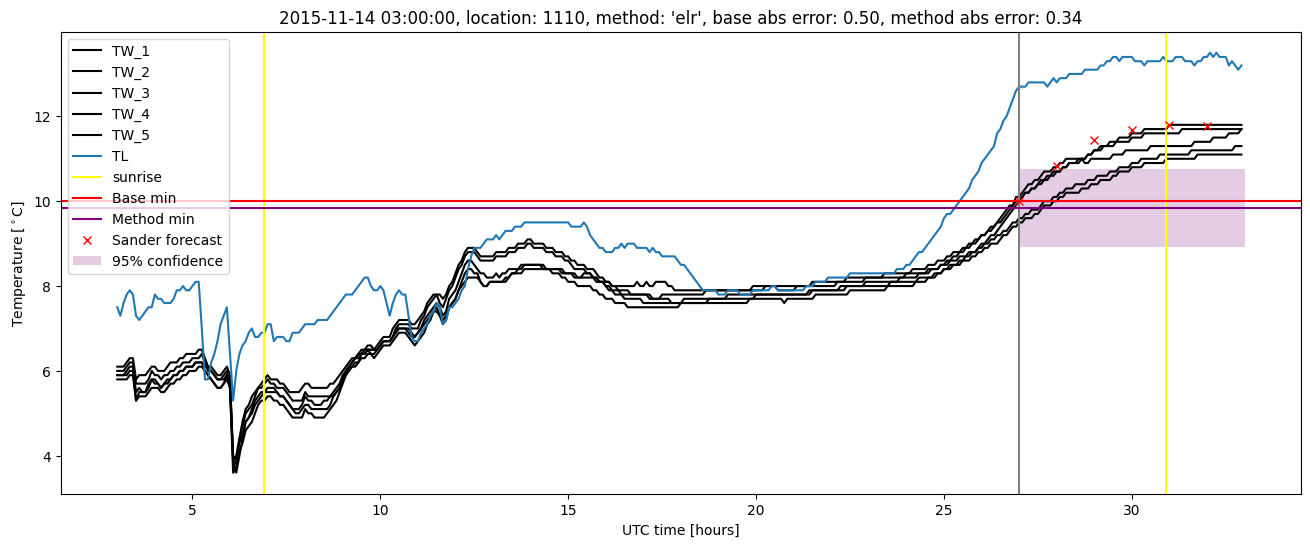
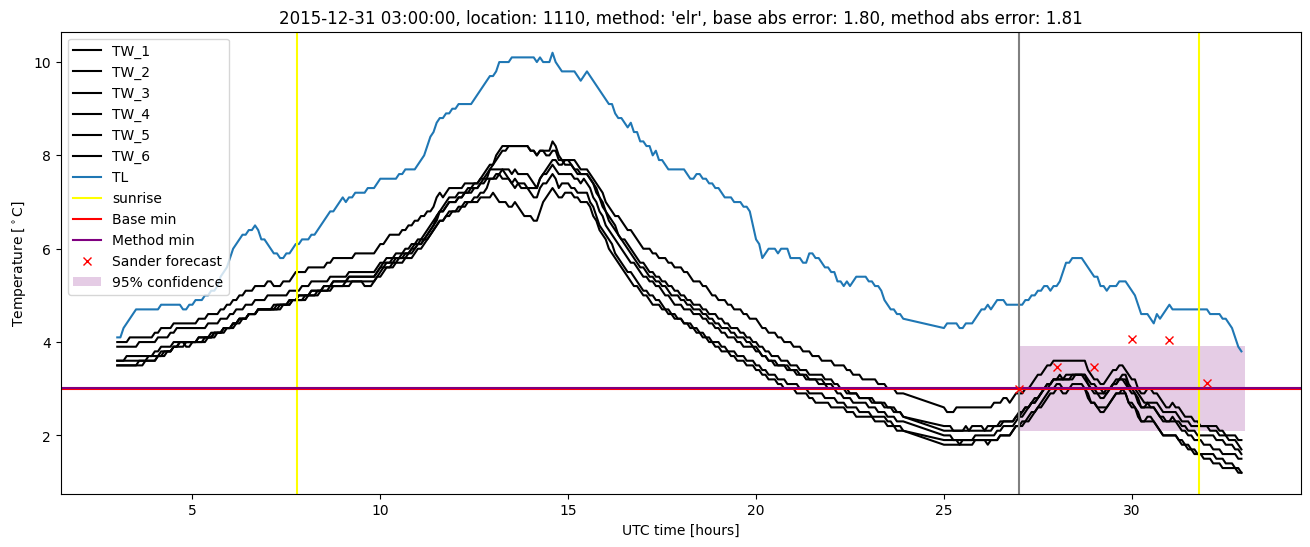
Extended logistic regression plots