GMS location: 111
Random forest results
| names |
period |
power |
significance |
meanSquareError |
absError |
maxError |
CRPS |
IGN |
| baseline |
winter 2016 |
0.984 |
0.125 |
0.389 |
0.471 |
2.508 |
NaN |
NaN |
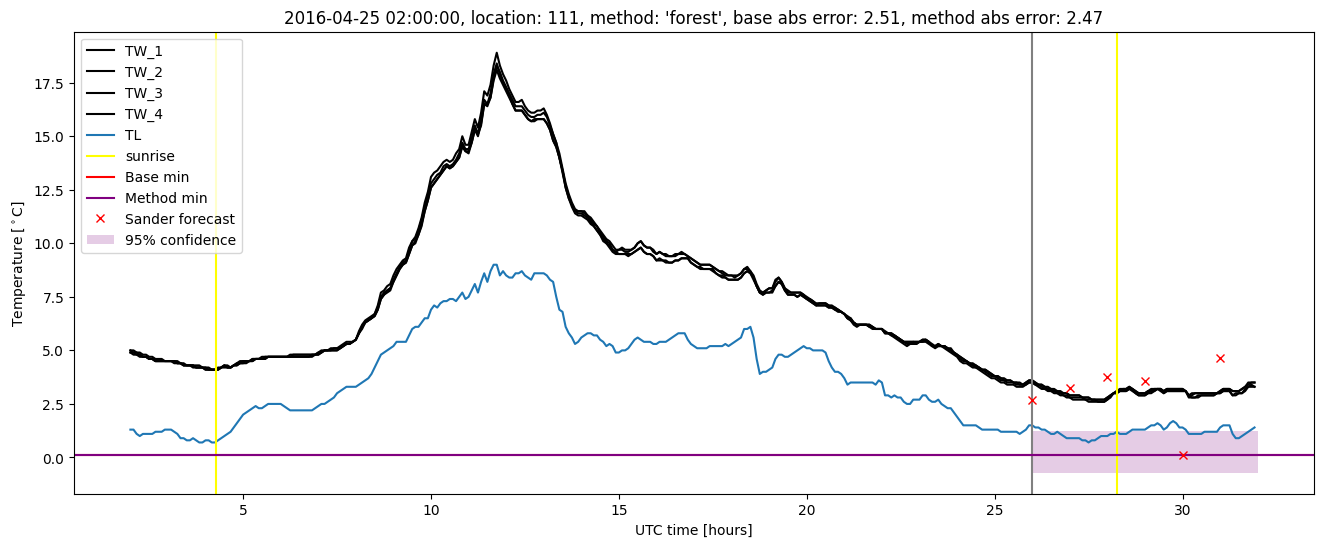
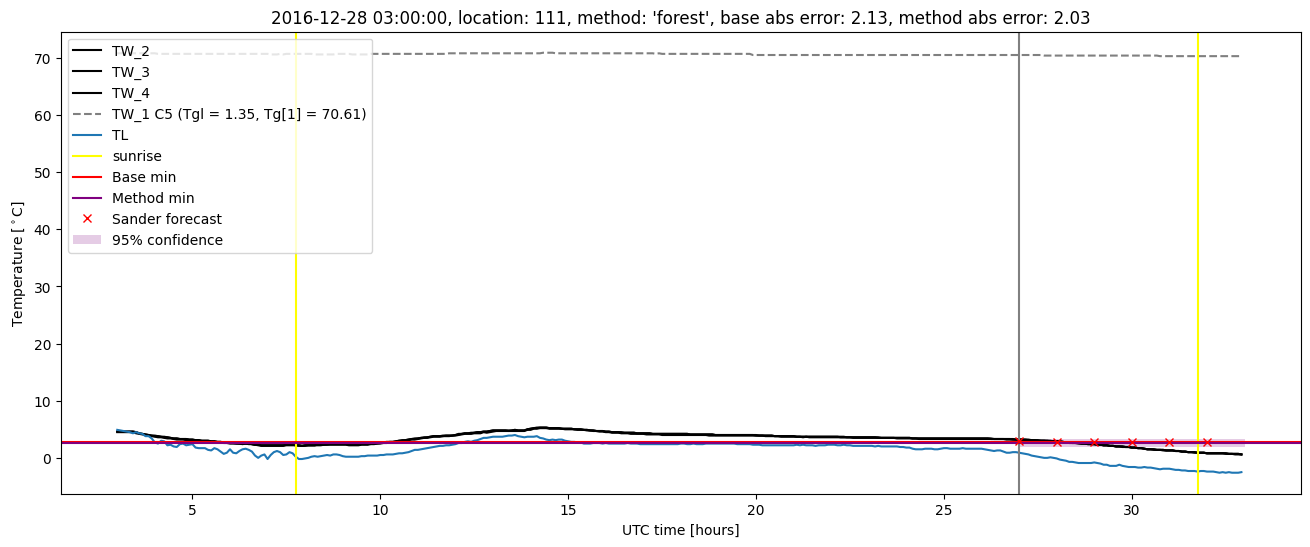
| forest |
winter 2016 |
0.989 |
0.083 |
0.289 |
0.403 |
2.474 |
0.427 |
2.665 |
| baseline |
winter 2017 |
0.973 |
0.053 |
0.529 |
0.516 |
2.877 |
NaN |
NaN |
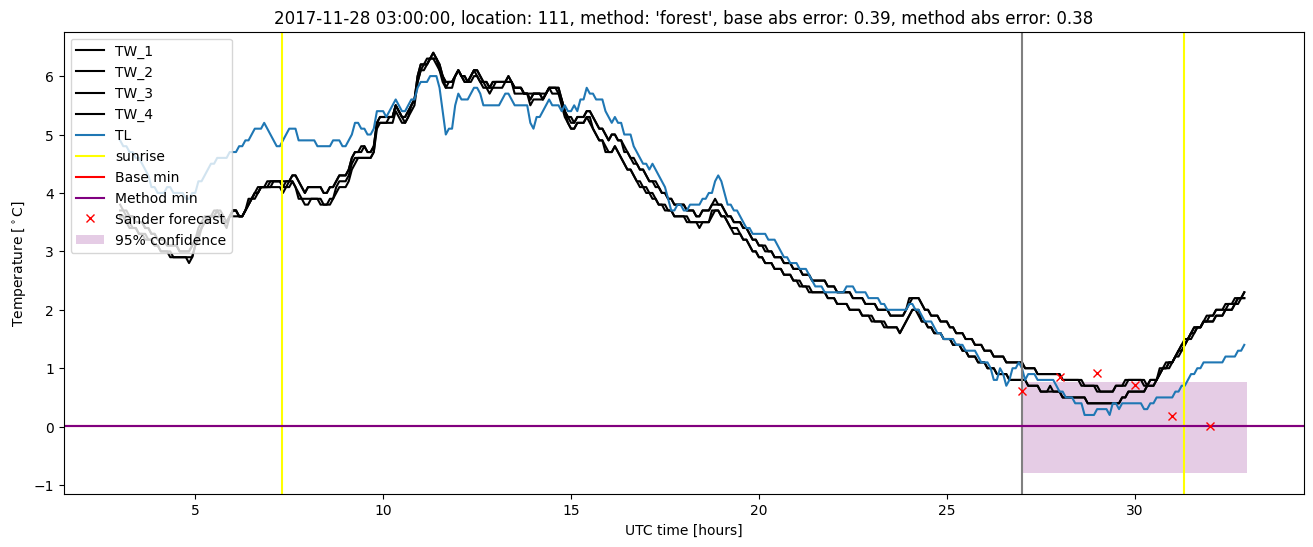
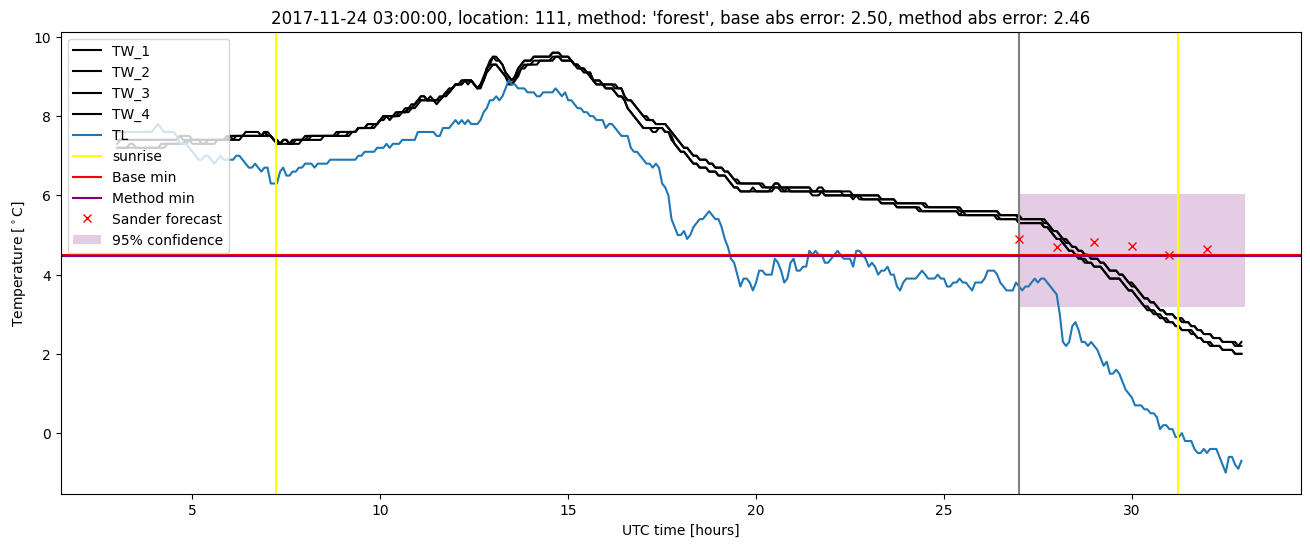
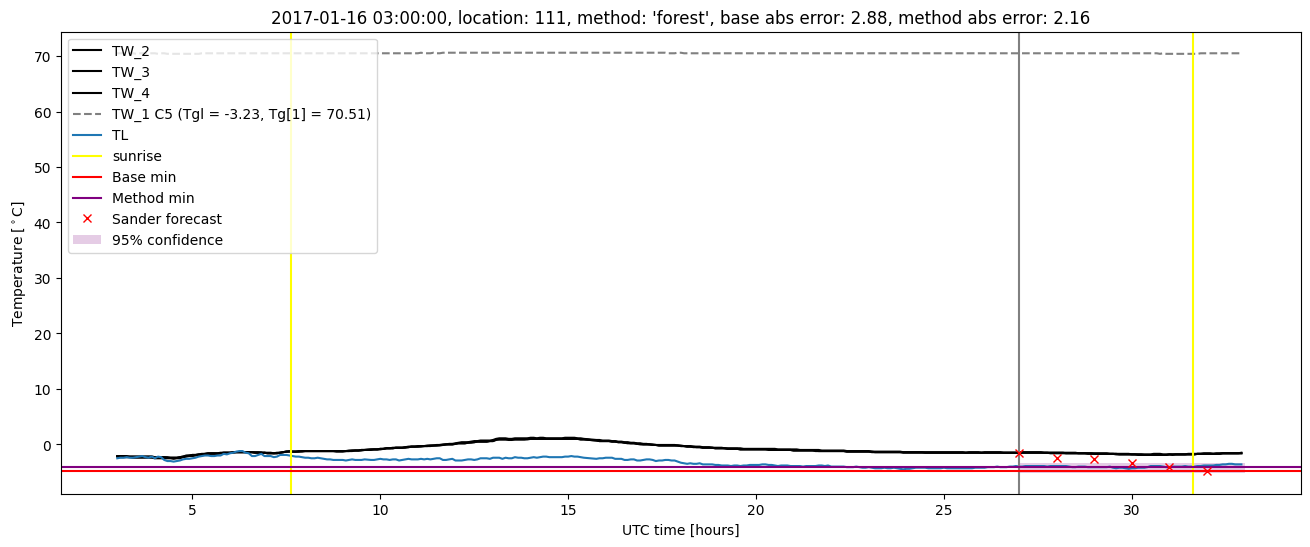
| forest |
winter 2017 |
0.991 |
0.026 |
0.361 |
0.423 |
2.162 |
0.440 |
3.199 |
| baseline |
winter 2018 |
1.000 |
0.040 |
0.331 |
0.418 |
2.502 |
NaN |
NaN |
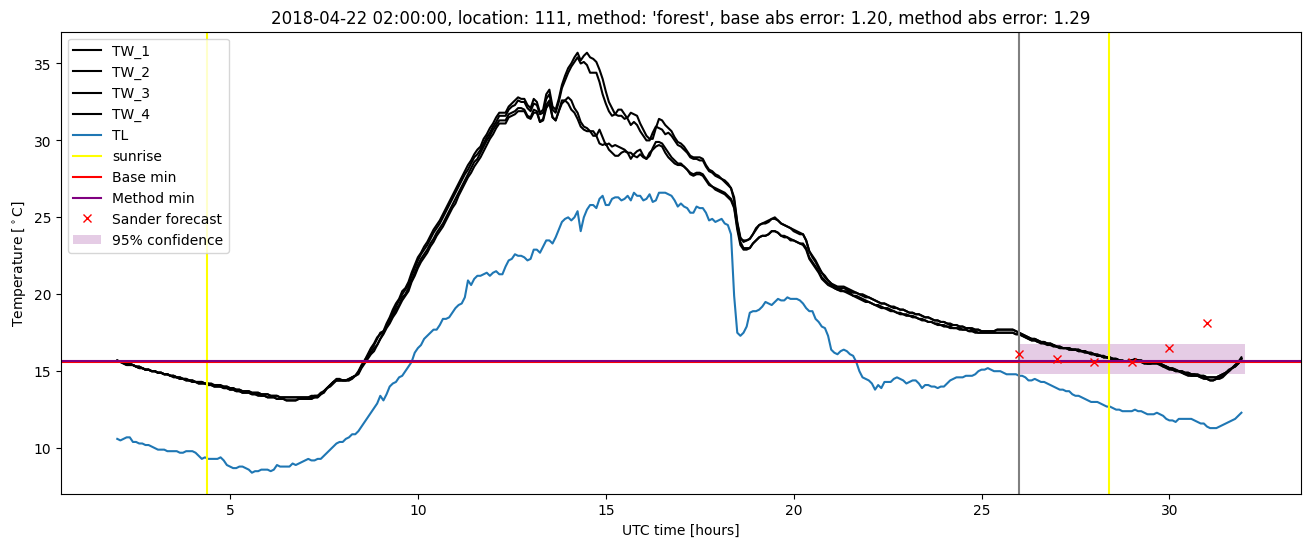
| forest |
winter 2018 |
1.000 |
0.080 |
0.289 |
0.393 |
2.460 |
0.422 |
2.860 |
| baseline |
winter 2019 |
0.992 |
0.000e+00 |
0.305 |
0.405 |
1.626 |
NaN |
NaN |
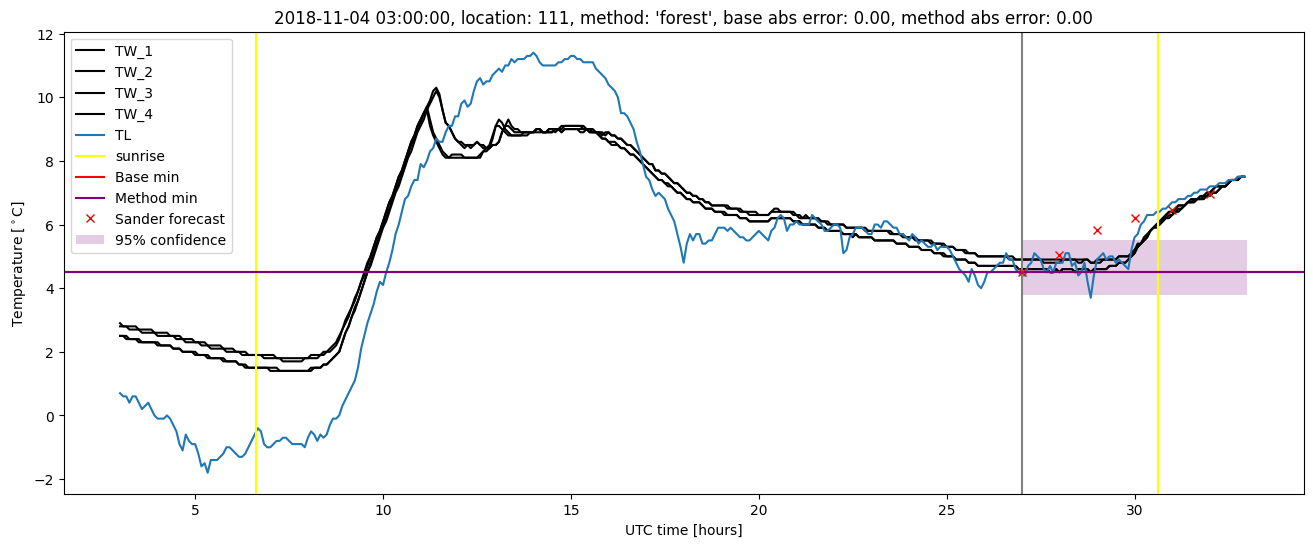
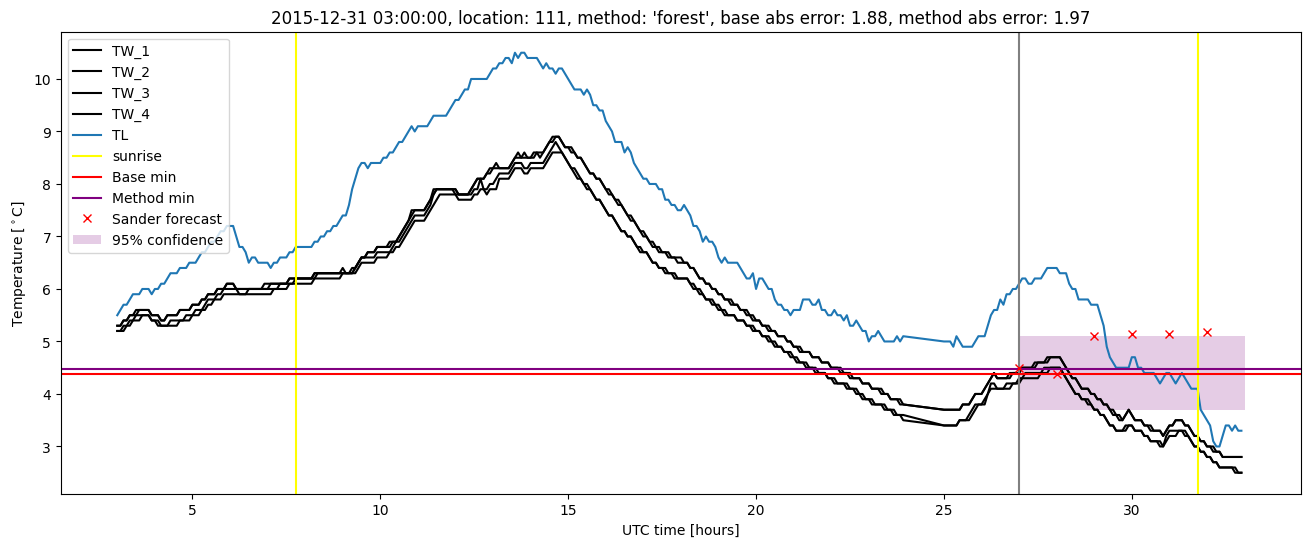
| forest |
winter 2019 |
1.000 |
0.000e+00 |
0.231 |
0.369 |
1.334 |
0.421 |
2.884 |
| baseline |
all |
0.988 |
0.065 |
0.389 |
0.455 |
2.877 |
NaN |
NaN |
| forest |
all |
0.995 |
0.054 |
0.294 |
0.398 |
2.474 |
0.427 |
2.880 |
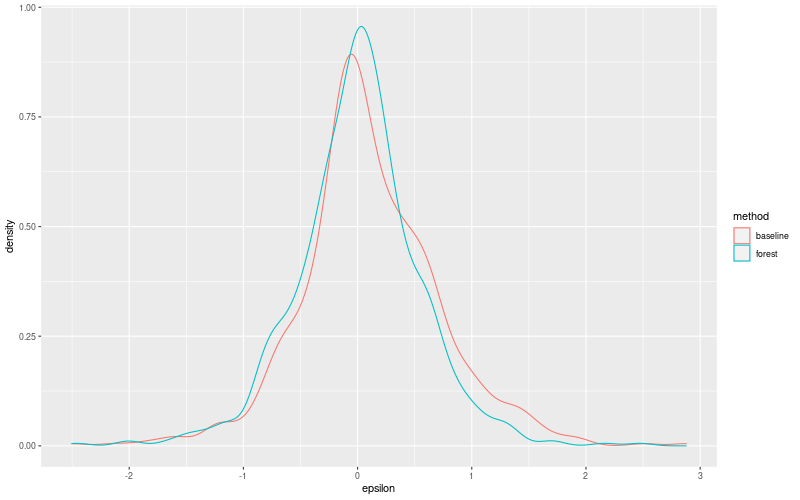
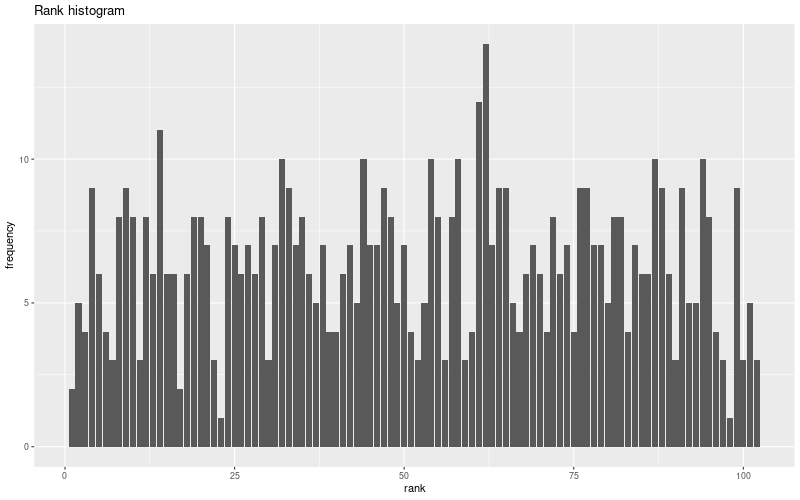
Random forest plots
Extended logistic regression results
| names |
period |
power |
significance |
meanSquareError |
absError |
maxError |
CRPS |
IGN |
| baseline |
winter 2016 |
0.984 |
0.125 |
0.389 |
0.471 |
2.508 |
NaN |
NaN |
| elr |
winter 2016 |
0.984 |
0.083 |
0.316 |
0.423 |
2.821 |
0.489 |
3.434 |
| baseline |
winter 2017 |
0.973 |
0.053 |
0.529 |
0.516 |
2.877 |
NaN |
NaN |
| elr |
winter 2017 |
0.982 |
0.053 |
0.406 |
0.463 |
2.266 |
0.475 |
3.452 |
| baseline |
winter 2018 |
1.000 |
0.040 |
0.331 |
0.418 |
2.502 |
NaN |
NaN |
| elr |
winter 2018 |
0.986 |
0.080 |
0.320 |
0.420 |
2.752 |
0.478 |
3.376 |
| baseline |
winter 2019 |
0.992 |
0.000e+00 |
0.305 |
0.405 |
1.626 |
NaN |
NaN |
| elr |
winter 2019 |
1.000 |
0.000e+00 |
0.280 |
0.421 |
1.626 |
0.469 |
2.970 |
| baseline |
all |
0.988 |
0.065 |
0.389 |
0.455 |
2.877 |
NaN |
NaN |
| elr |
all |
0.988 |
0.065 |
0.331 |
0.431 |
2.821 |
0.479 |
3.333 |
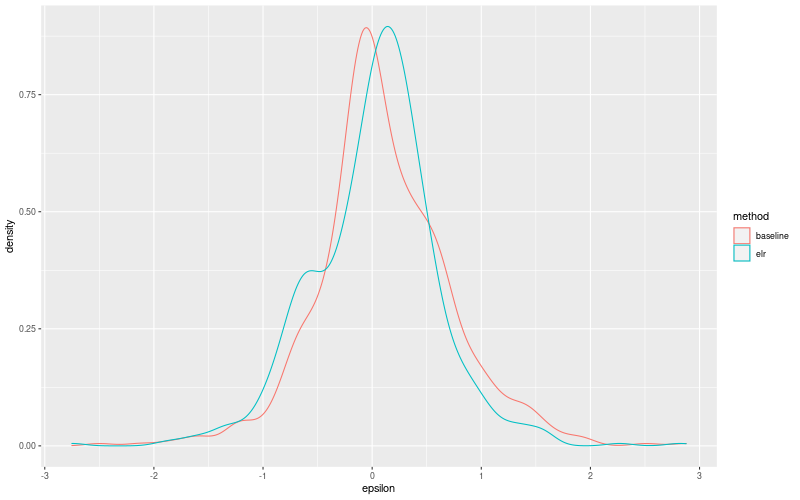
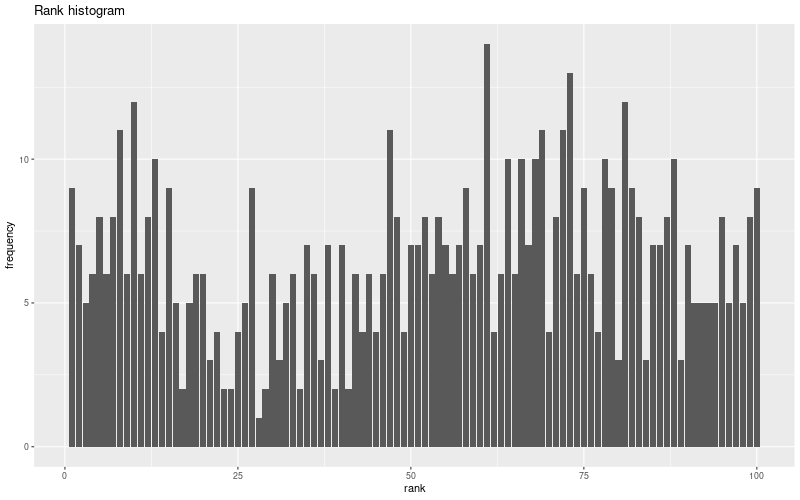
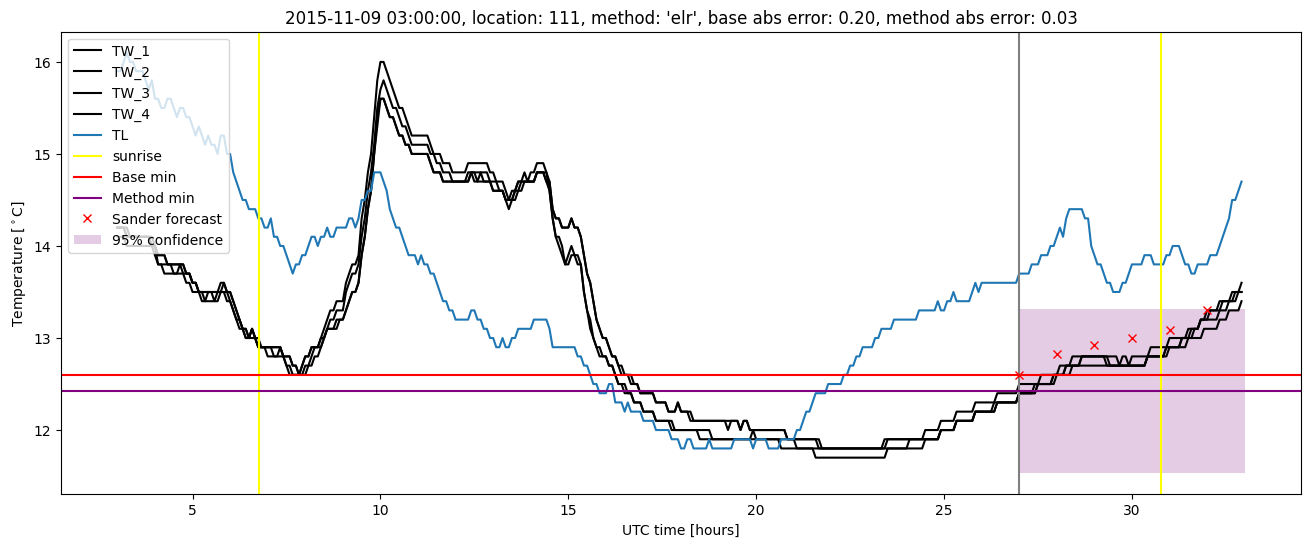
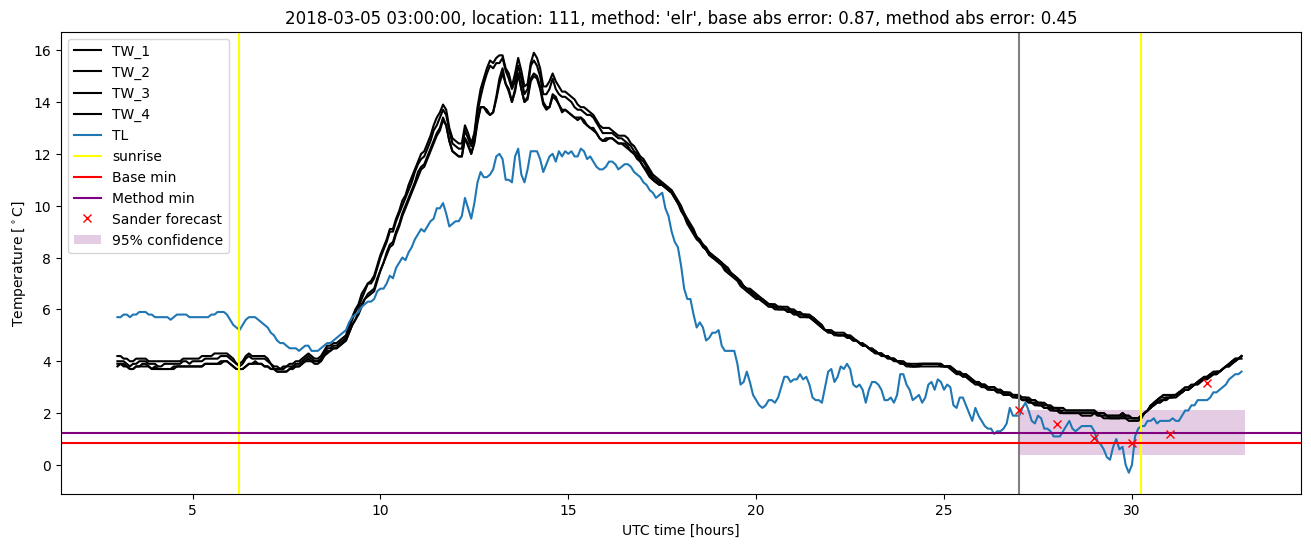
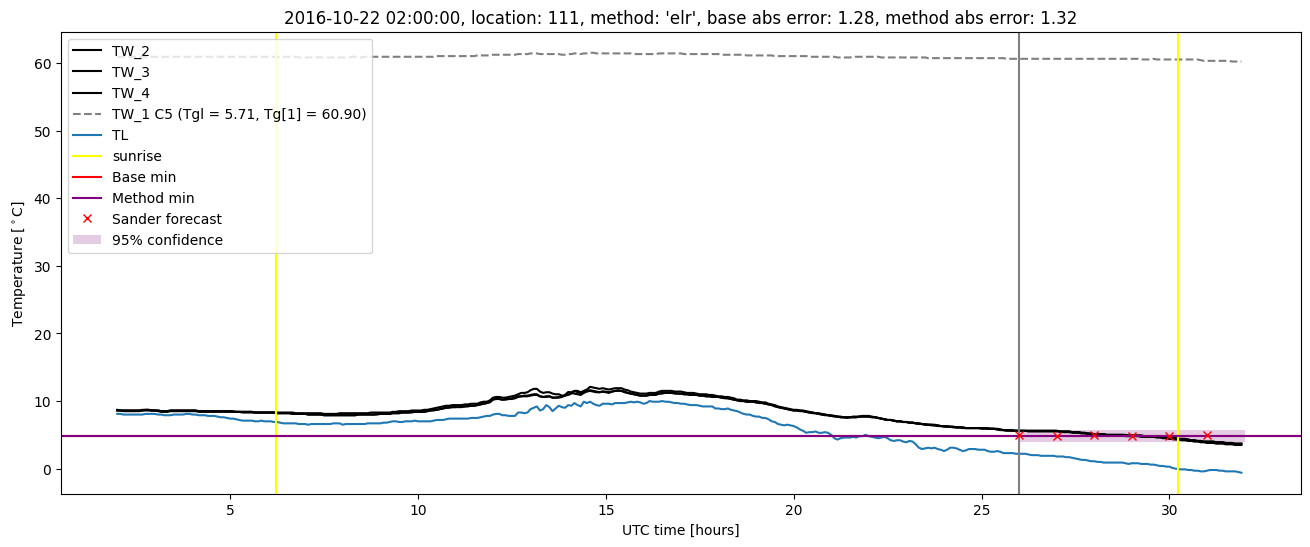
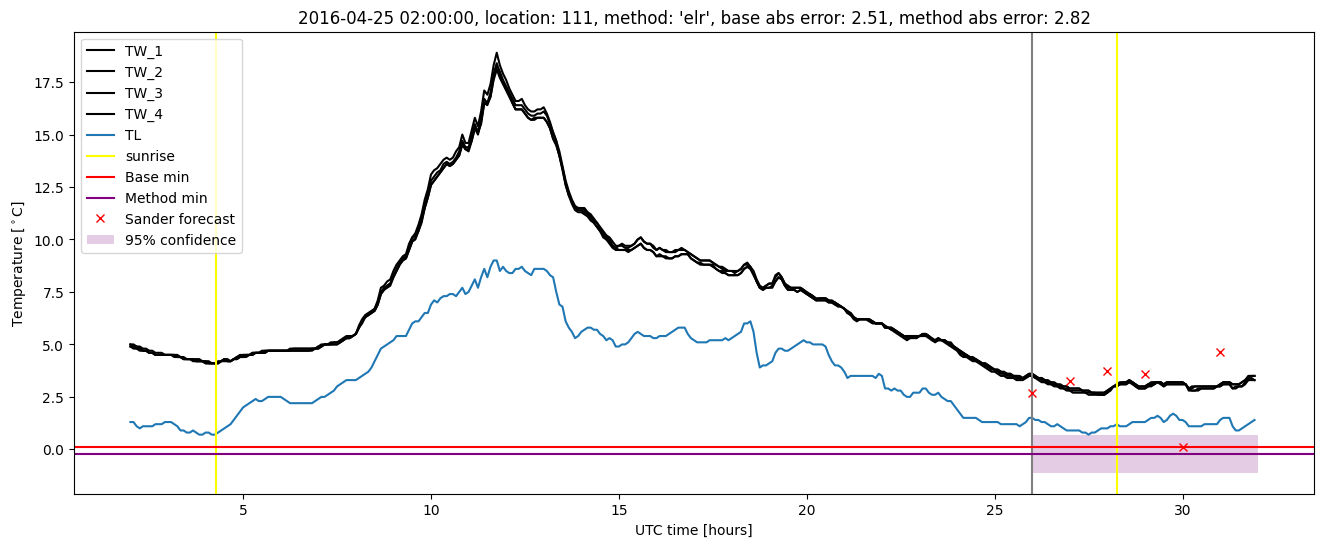
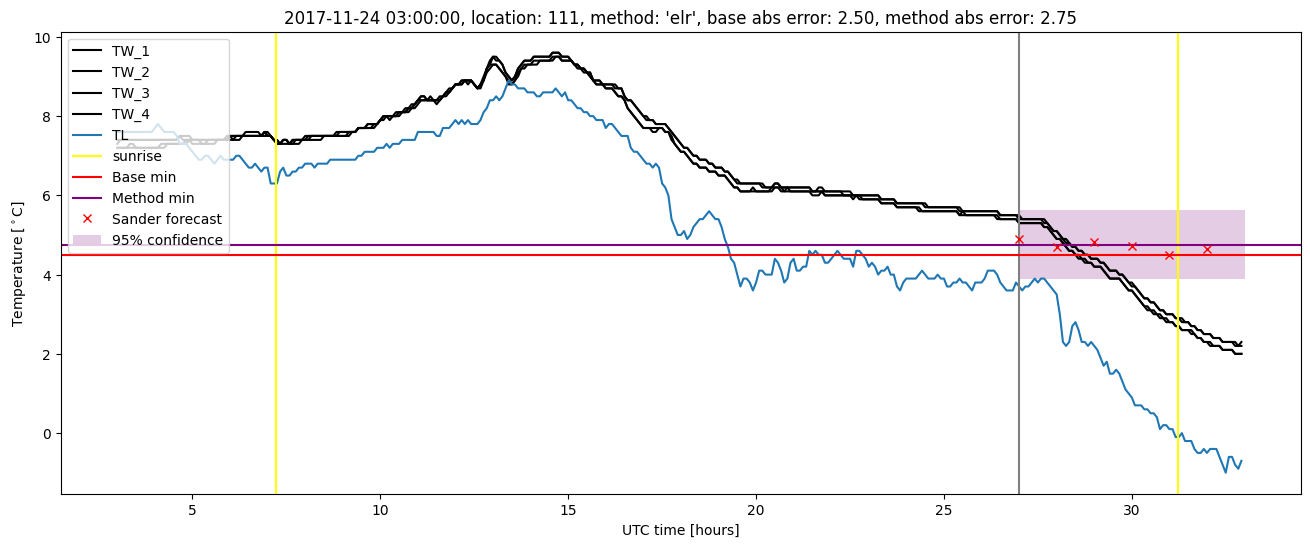
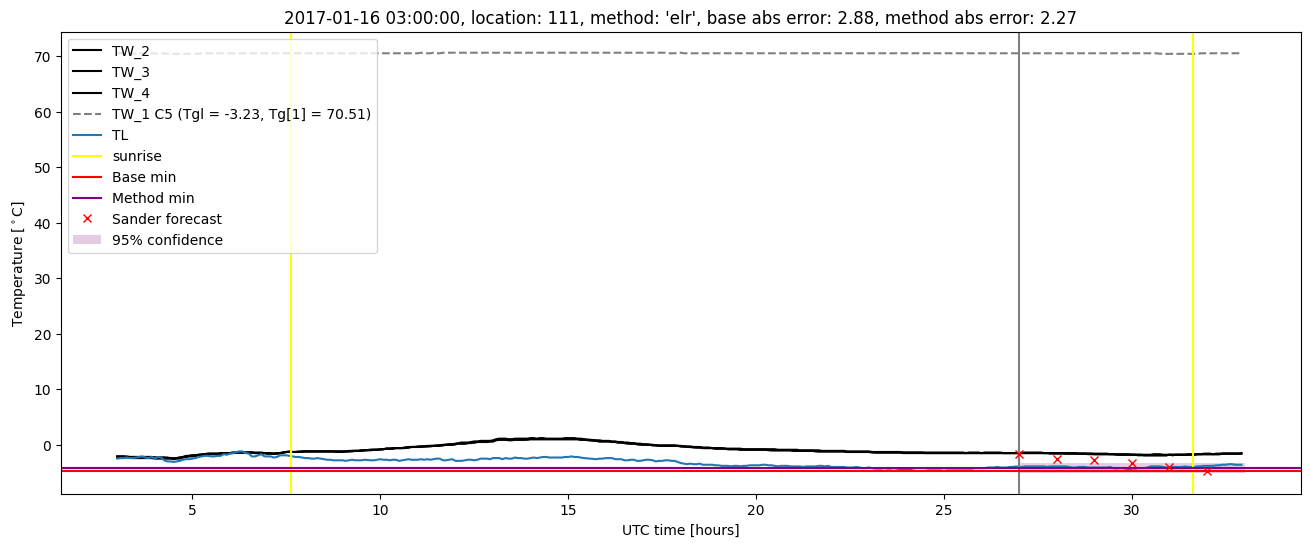
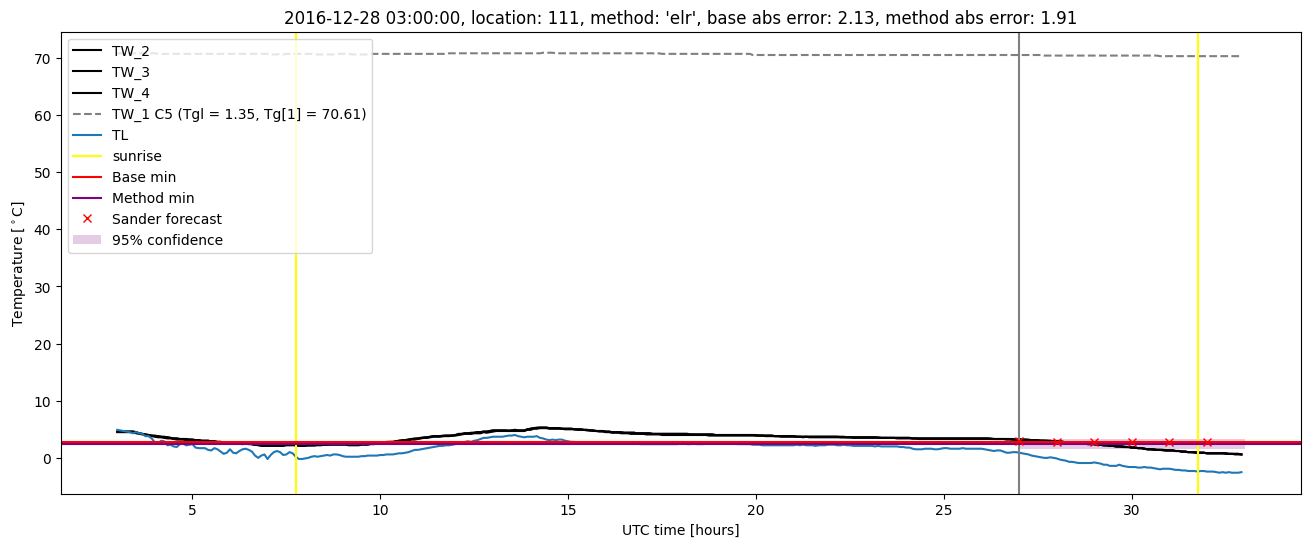
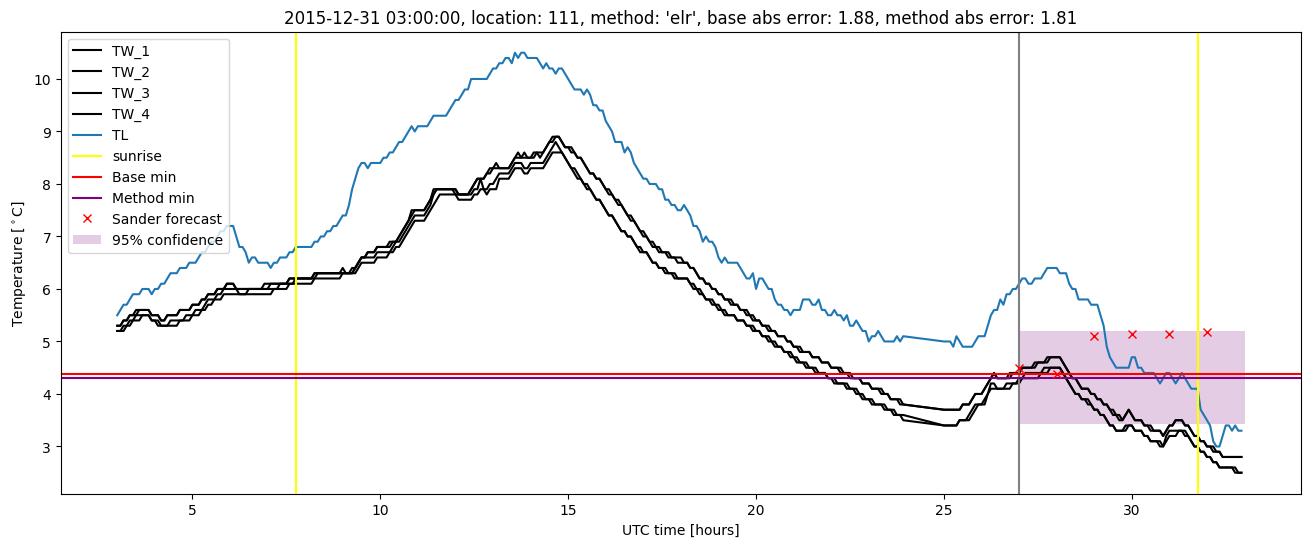
Extended logistic regression plots