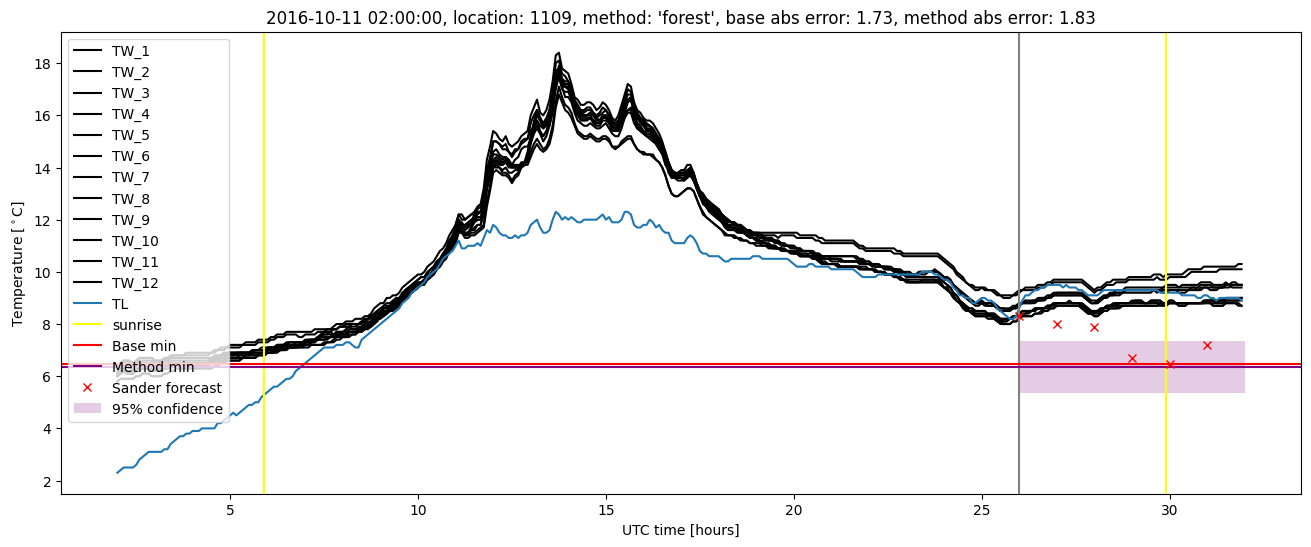
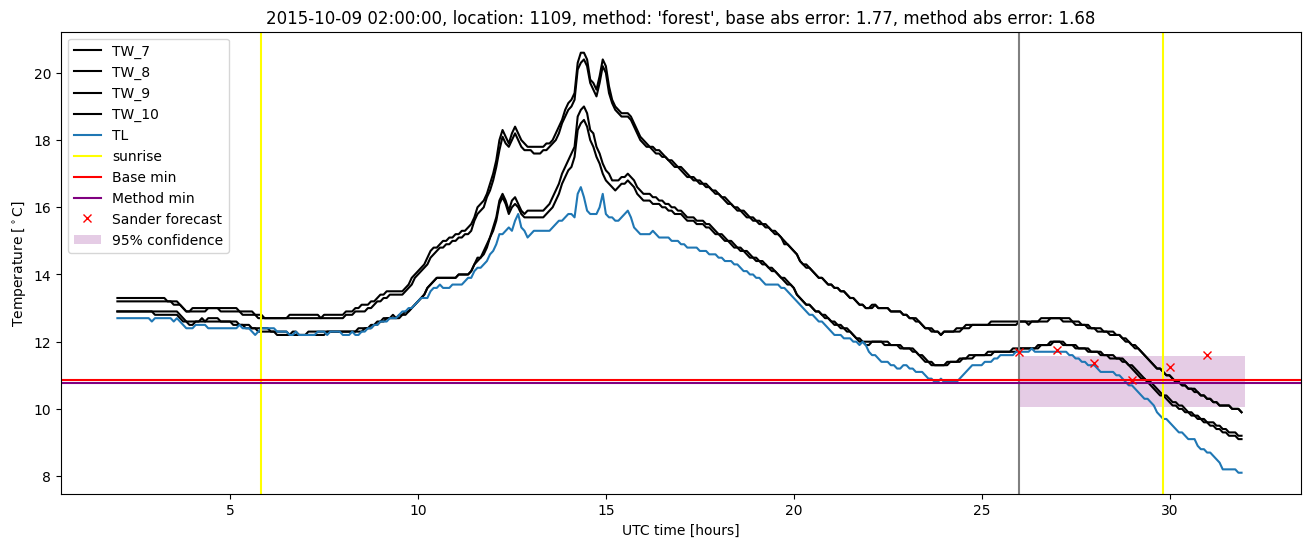
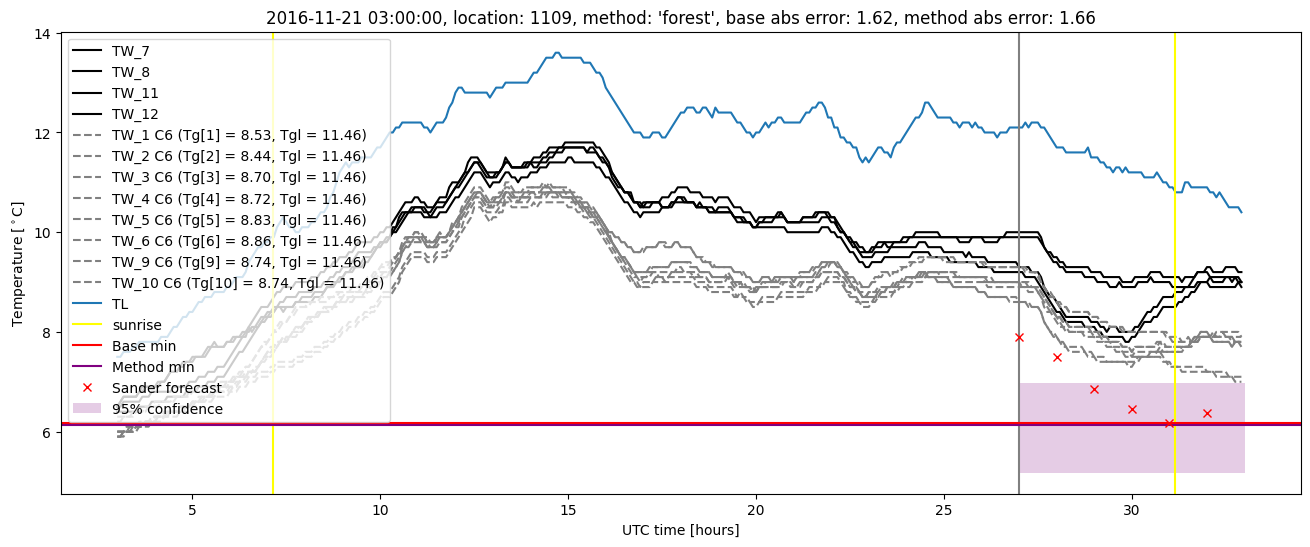
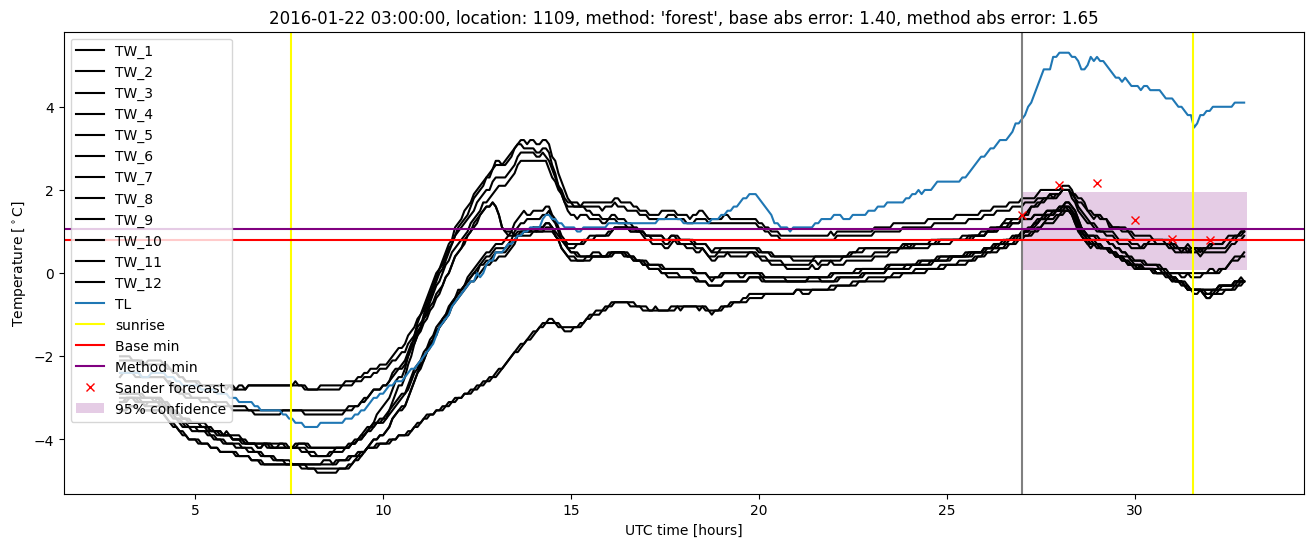
GMS location: 1109
Random forest results
| names |
period |
power |
significance |
meanSquareError |
absError |
maxError |
CRPS |
IGN |
| baseline |
winter 2016 |
1.000 |
0.105 |
0.279 |
0.397 |
1.770 |
NaN |
NaN |
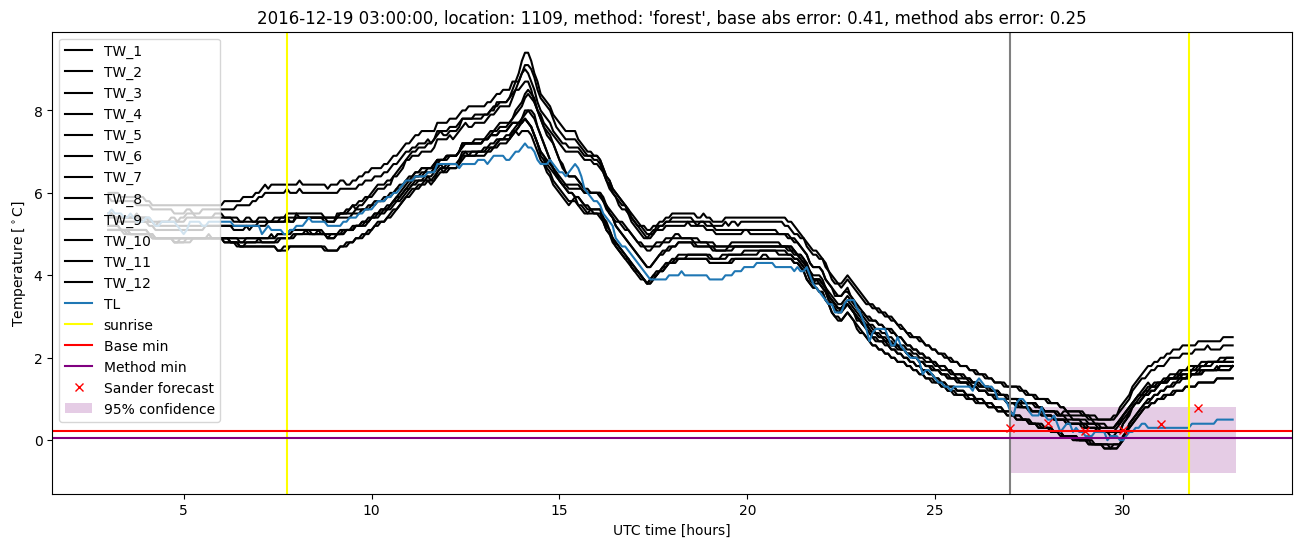
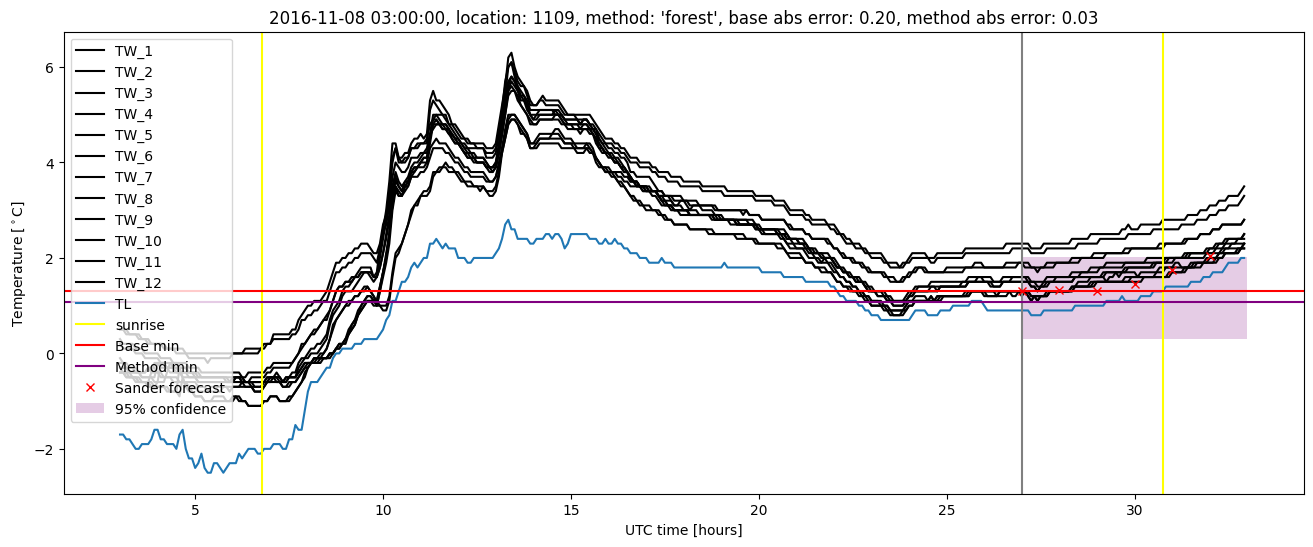
| forest |
winter 2016 |
0.994 |
0.053 |
0.248 |
0.367 |
1.684 |
0.496 |
3.774 |
| baseline |
winter 2017 |
0.963 |
0.091 |
0.467 |
0.495 |
3.382 |
NaN |
NaN |
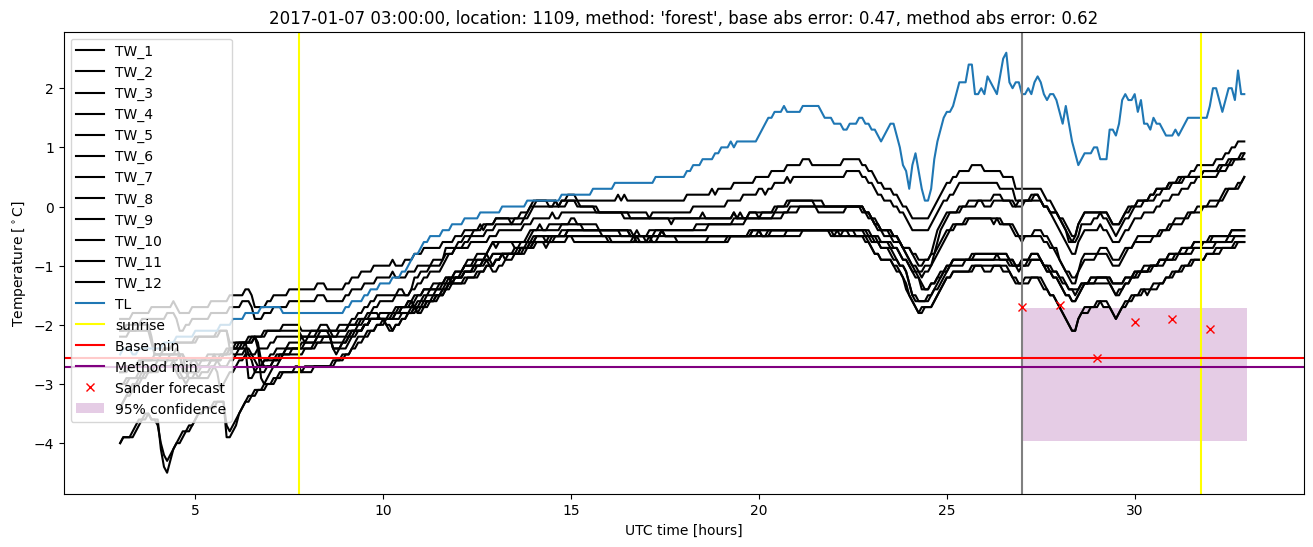
| forest |
winter 2017 |
0.973 |
0.068 |
0.396 |
0.444 |
3.144 |
0.517 |
6.180 |
| baseline |
winter 2018 |
0.992 |
0.119 |
0.295 |
0.392 |
1.873 |
NaN |
NaN |
| forest |
winter 2018 |
1.000 |
0.119 |
0.269 |
0.386 |
1.497 |
0.502 |
3.759 |
| baseline |
winter 2019 |
0.992 |
0.133 |
0.324 |
0.406 |
1.636 |
NaN |
NaN |
| forest |
winter 2019 |
0.992 |
0.133 |
0.242 |
0.362 |
1.565 |
0.501 |
4.205 |
| baseline |
all |
0.989 |
0.108 |
0.335 |
0.420 |
3.382 |
NaN |
NaN |
| forest |
all |
0.991 |
0.086 |
0.286 |
0.388 |
3.144 |
0.504 |
4.412 |
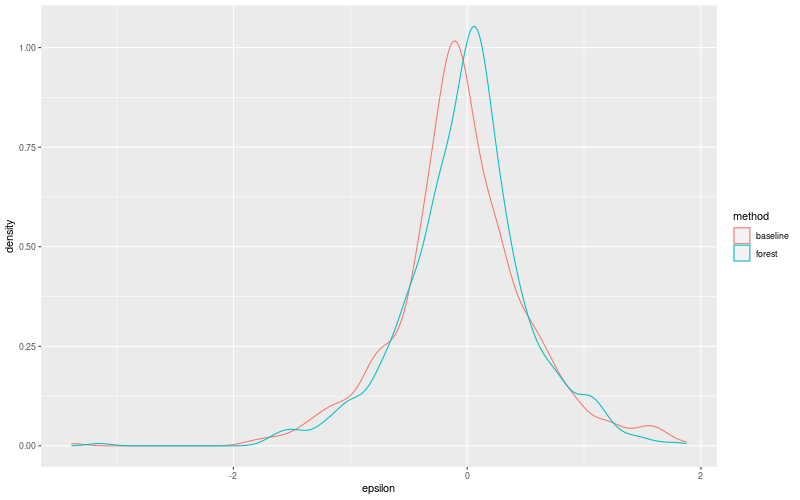
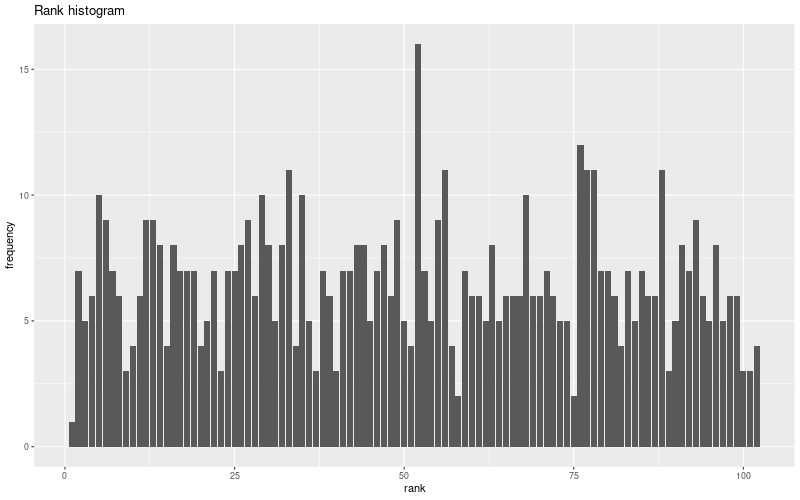
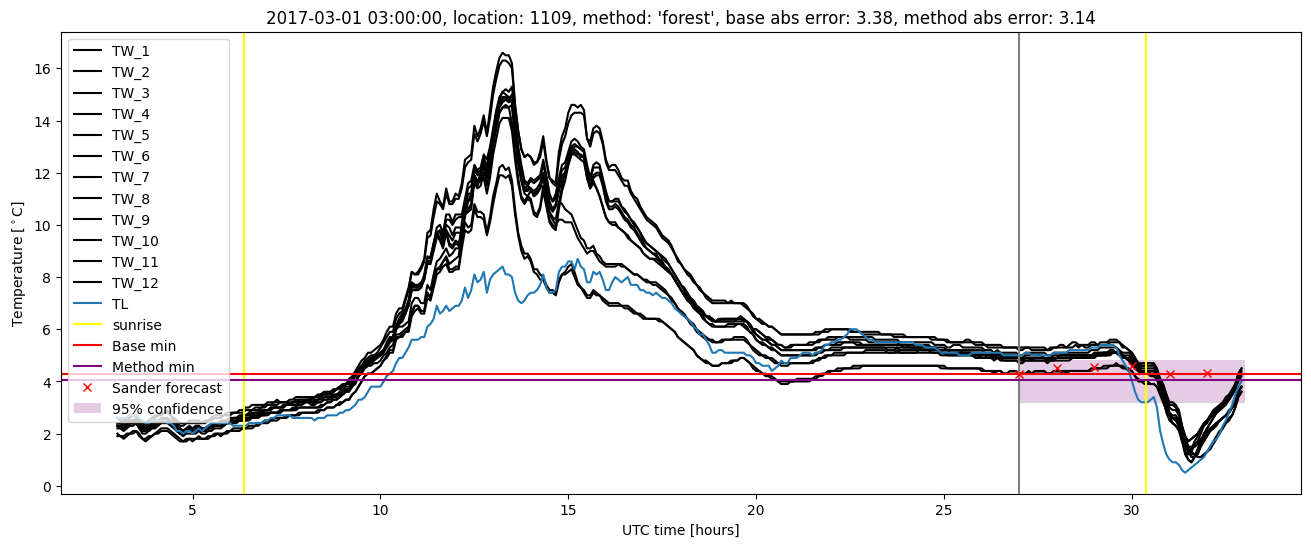
Random forest plots
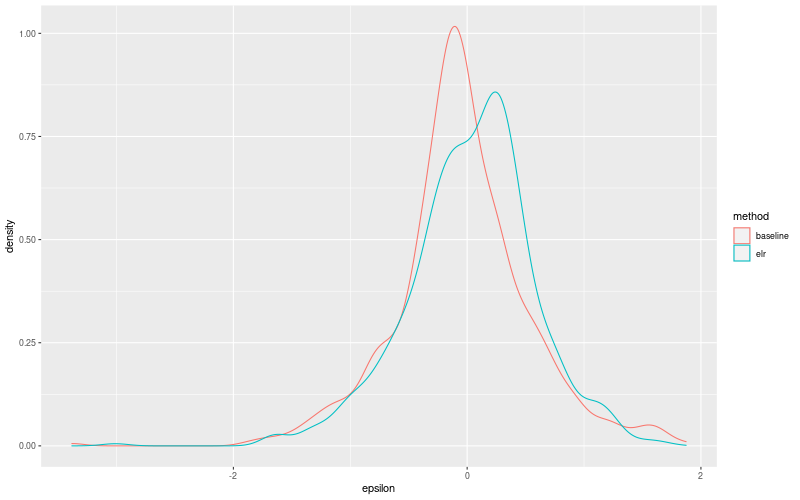
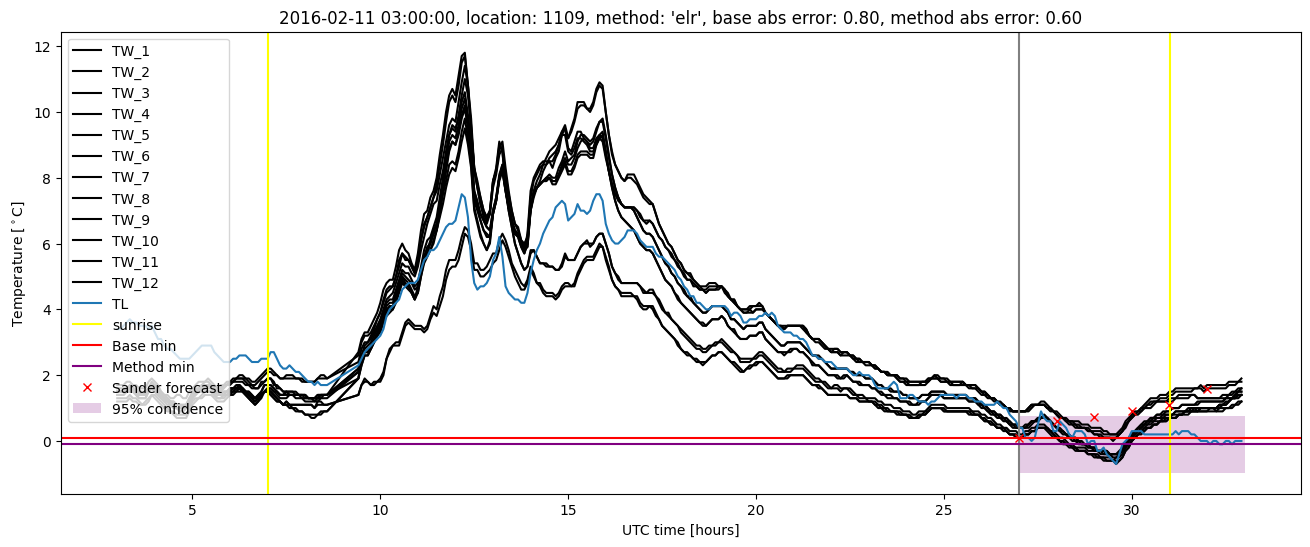
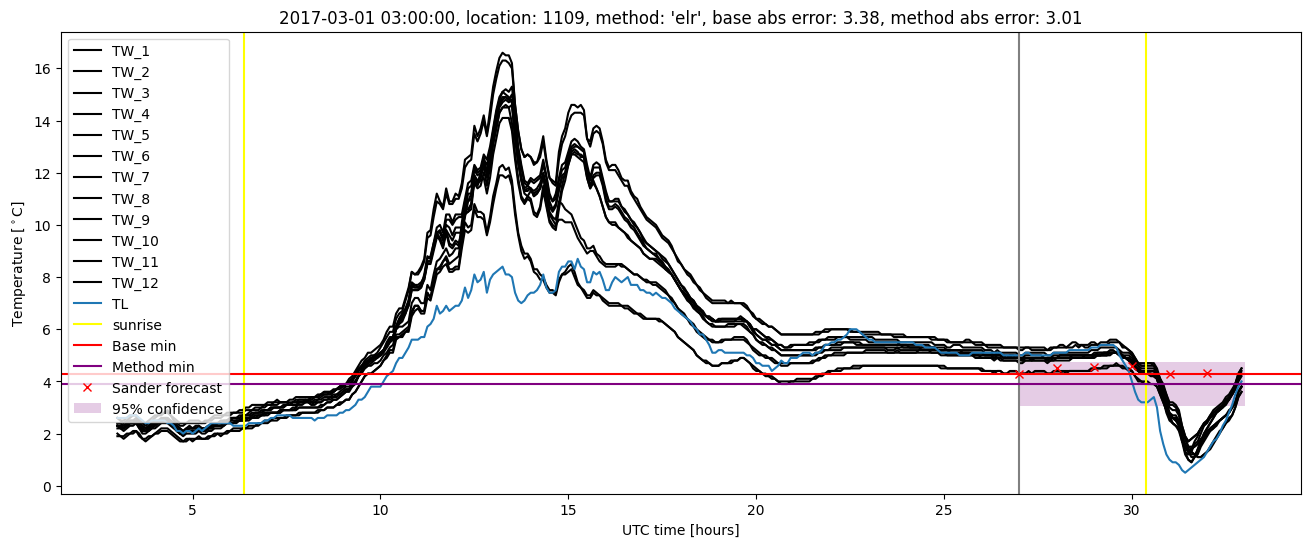
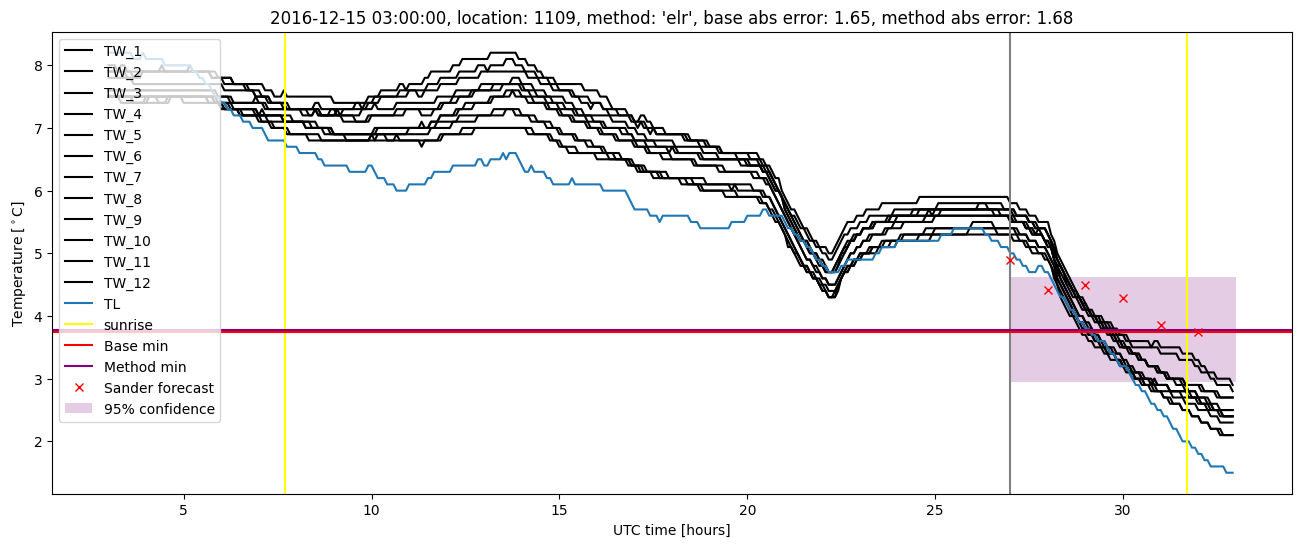
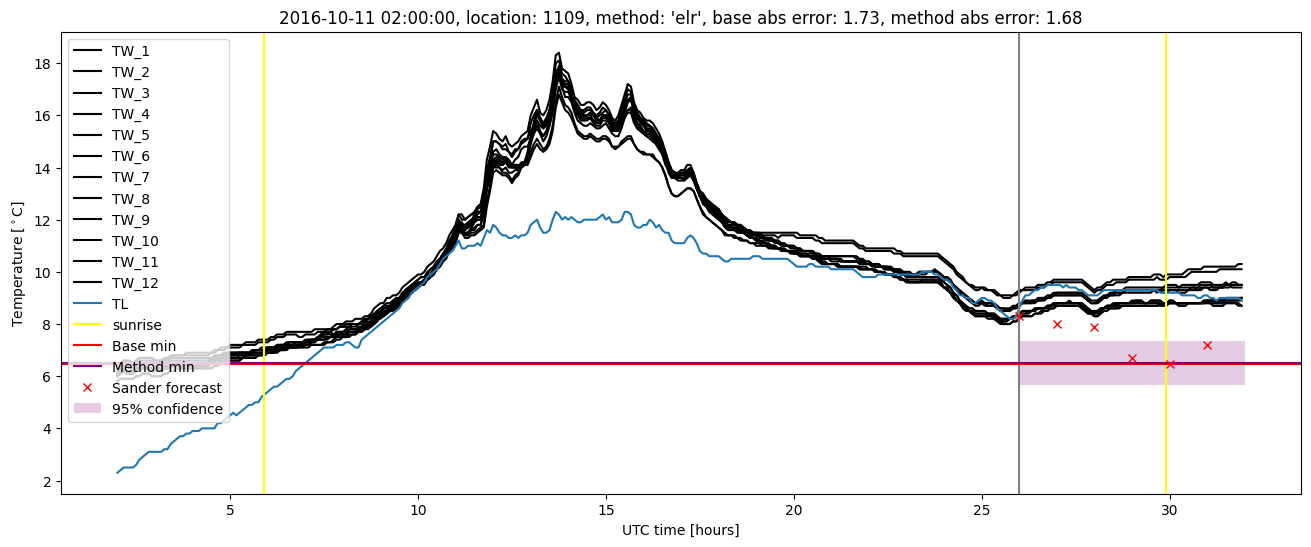
Extended logistic regression results
| names |
period |
power |
significance |
meanSquareError |
absError |
maxError |
CRPS |
IGN |
| baseline |
winter 2016 |
1.000 |
0.105 |
0.279 |
0.397 |
1.770 |
NaN |
NaN |
| elr |
winter 2016 |
0.988 |
0.053 |
0.254 |
0.395 |
1.639 |
0.569 |
5.030 |
| baseline |
winter 2017 |
0.963 |
0.091 |
0.467 |
0.495 |
3.382 |
NaN |
NaN |
| elr |
winter 2017 |
0.963 |
0.068 |
0.387 |
0.450 |
3.010 |
0.552 |
5.290 |
| baseline |
winter 2018 |
0.992 |
0.119 |
0.295 |
0.392 |
1.873 |
NaN |
NaN |
| elr |
winter 2018 |
0.992 |
0.119 |
0.293 |
0.424 |
1.637 |
0.579 |
5.314 |
| baseline |
winter 2019 |
0.992 |
0.133 |
0.324 |
0.406 |
1.636 |
NaN |
NaN |
| elr |
winter 2019 |
0.992 |
0.133 |
0.268 |
0.412 |
1.643 |
0.571 |
5.054 |
| baseline |
all |
0.989 |
0.108 |
0.335 |
0.420 |
3.382 |
NaN |
NaN |
| elr |
all |
0.985 |
0.086 |
0.297 |
0.418 |
3.010 |
0.568 |
5.166 |
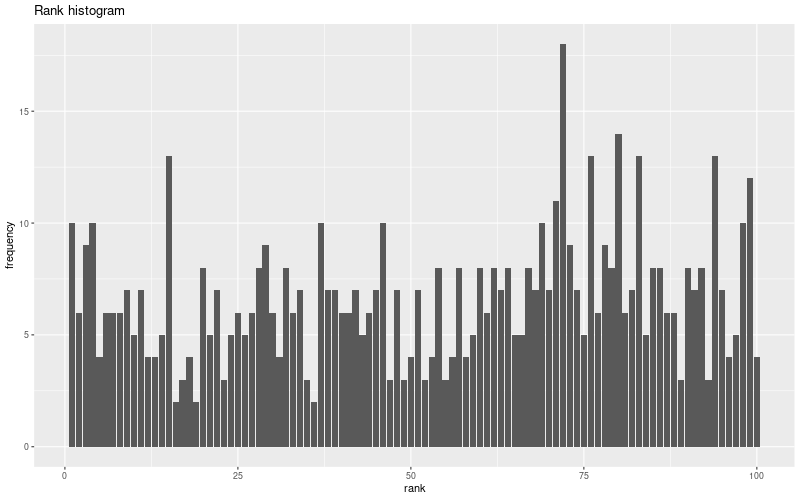
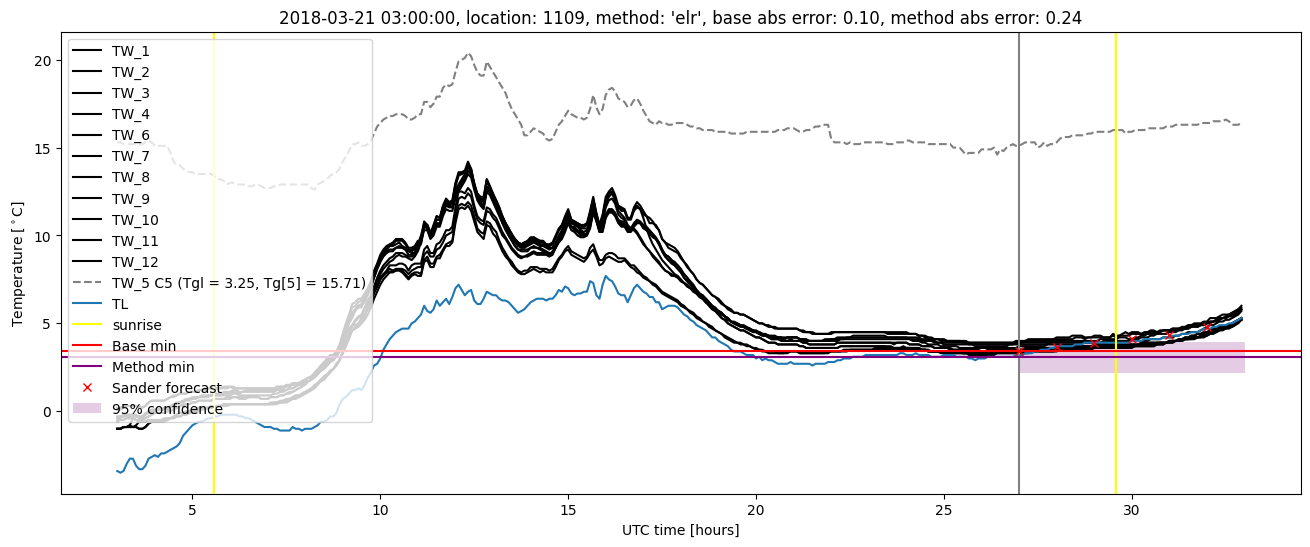
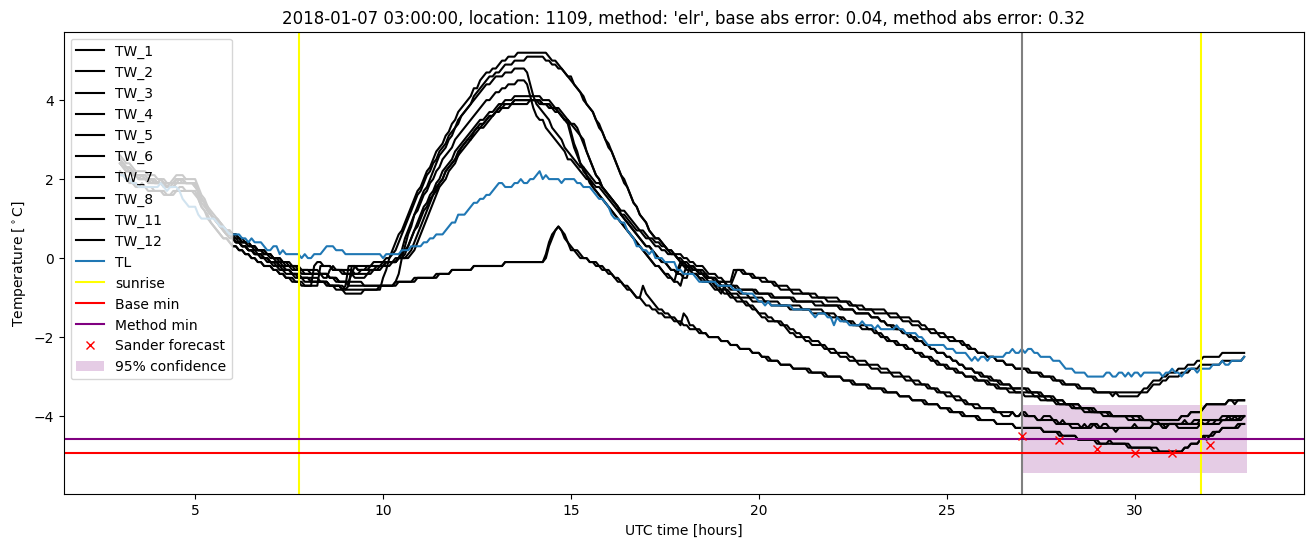
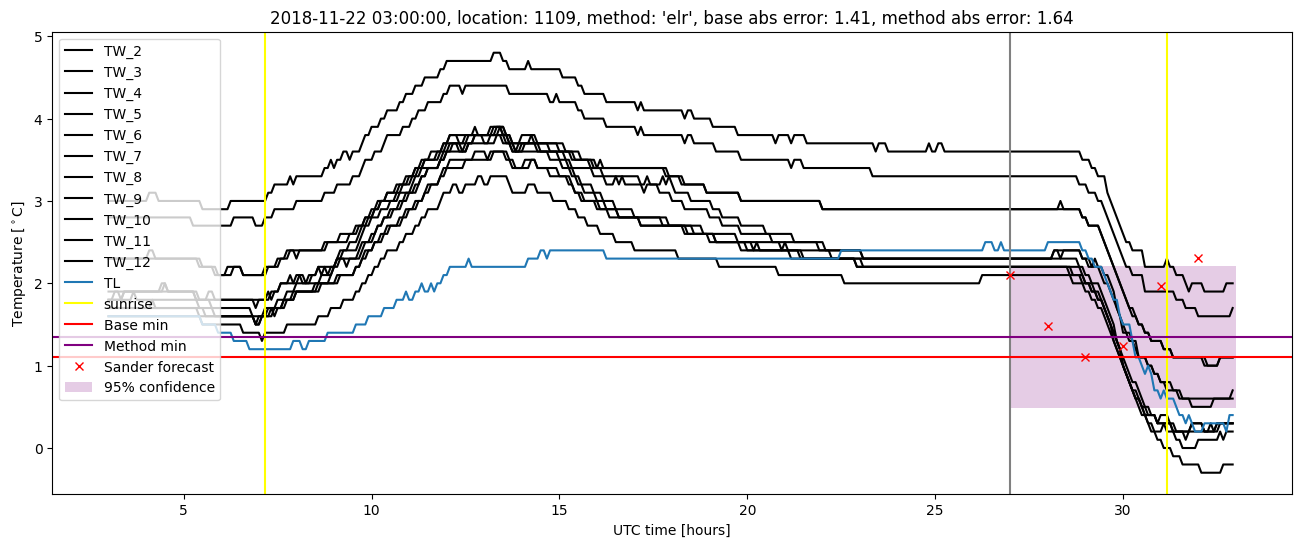
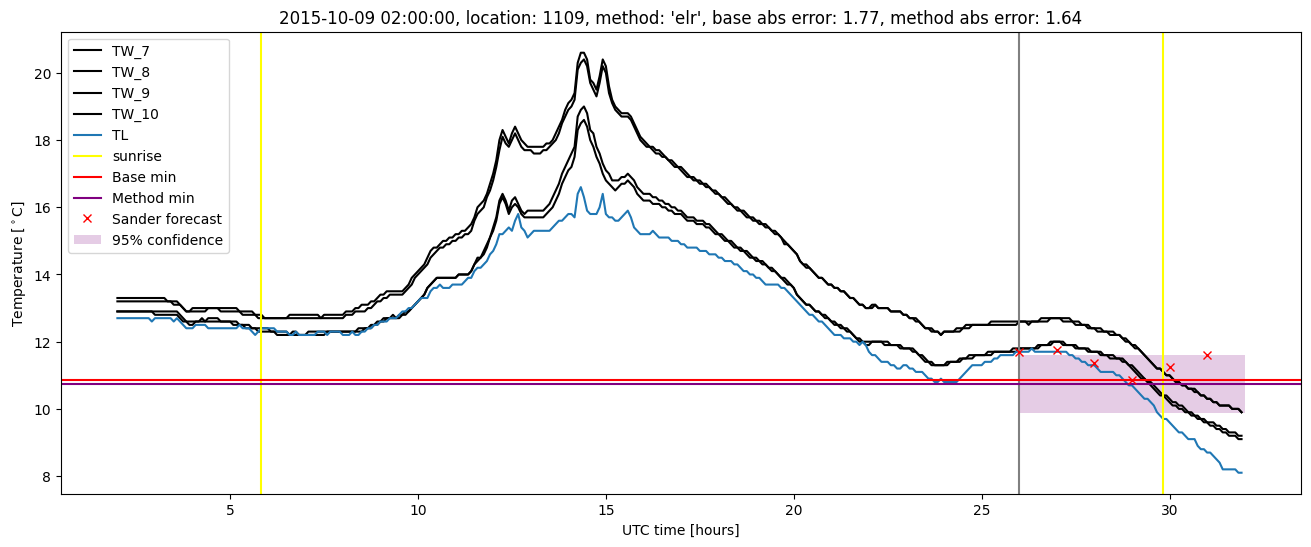
Extended logistic regression plots