GMS location: 1108
Random forest results
| names |
period |
power |
significance |
meanSquareError |
absError |
maxError |
CRPS |
IGN |
| baseline |
winter 2016 |
0.981 |
0.062 |
0.395 |
0.422 |
2.550 |
NaN |
NaN |
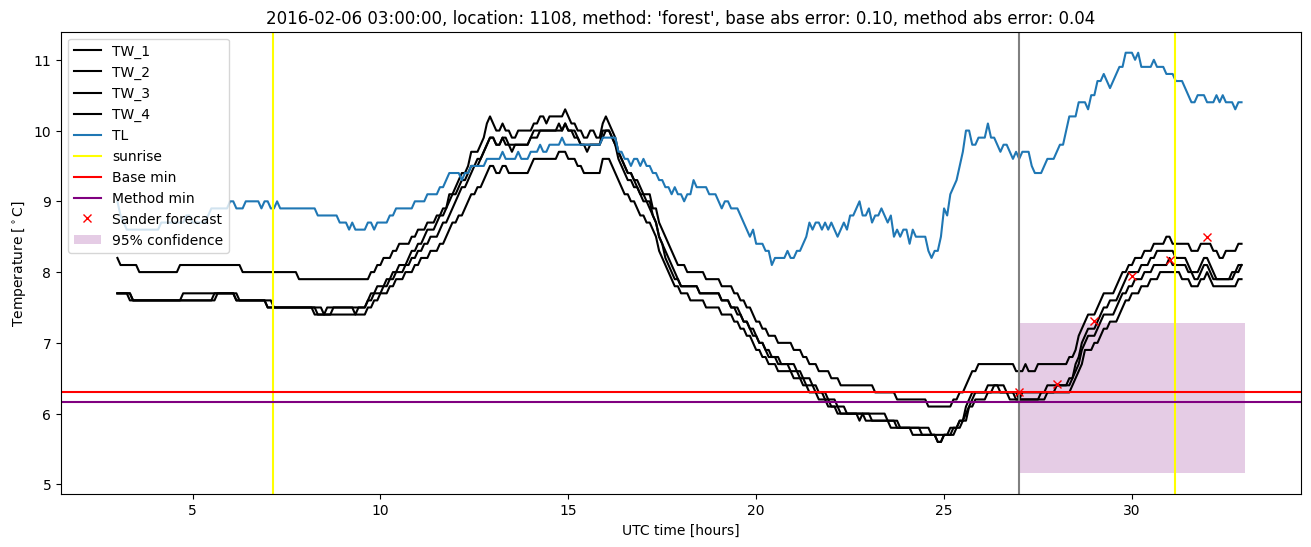
| forest |
winter 2016 |
0.962 |
0.031 |
0.341 |
0.401 |
2.405 |
0.541 |
3.062 |
| baseline |
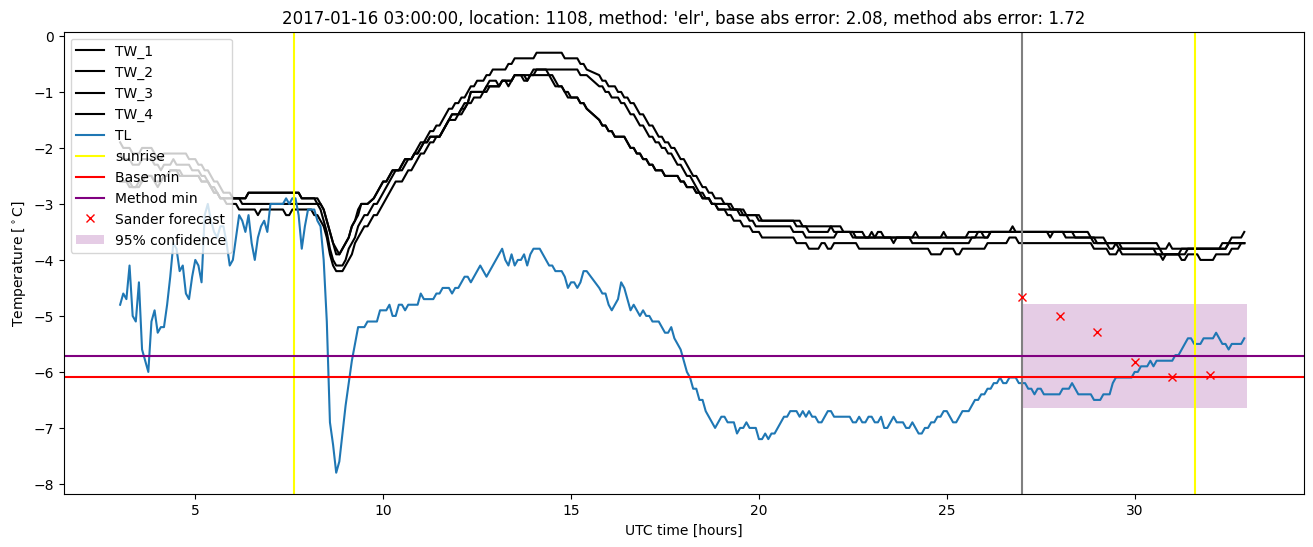
winter 2017 |
0.964 |
0.048 |
0.465 |
0.471 |
2.101 |
NaN |
NaN |
| forest |
winter 2017 |
0.964 |
0.048 |
0.347 |
0.411 |
2.186 |
0.509 |
3.342 |
| baseline |
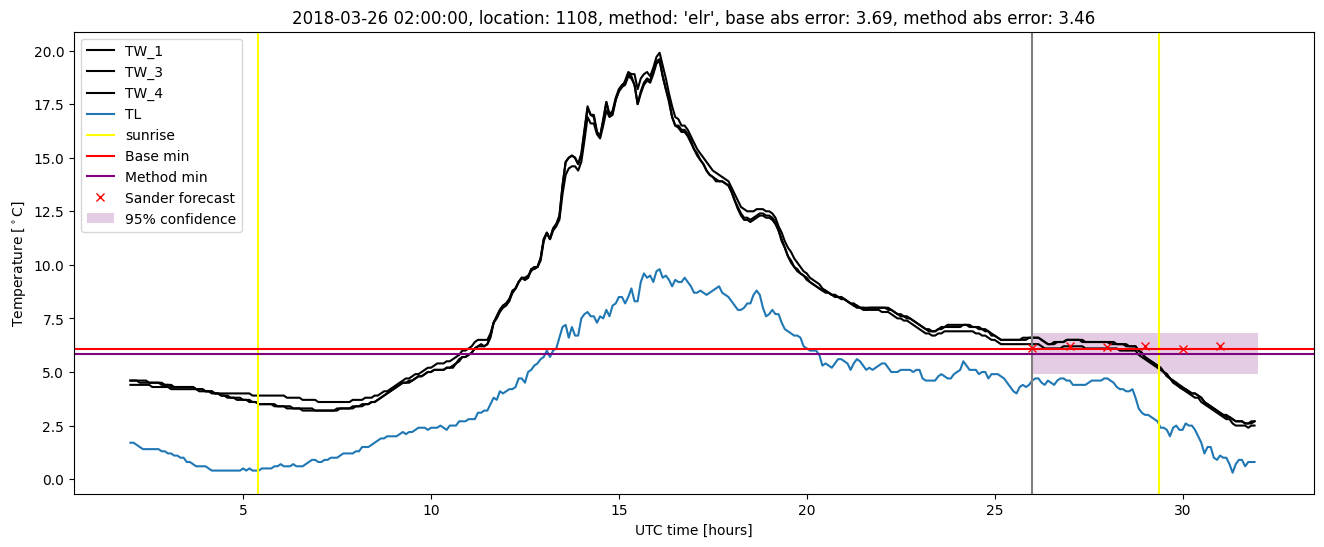
winter 2018 |
0.977 |
0.186 |
0.399 |
0.434 |
3.692 |
NaN |
NaN |
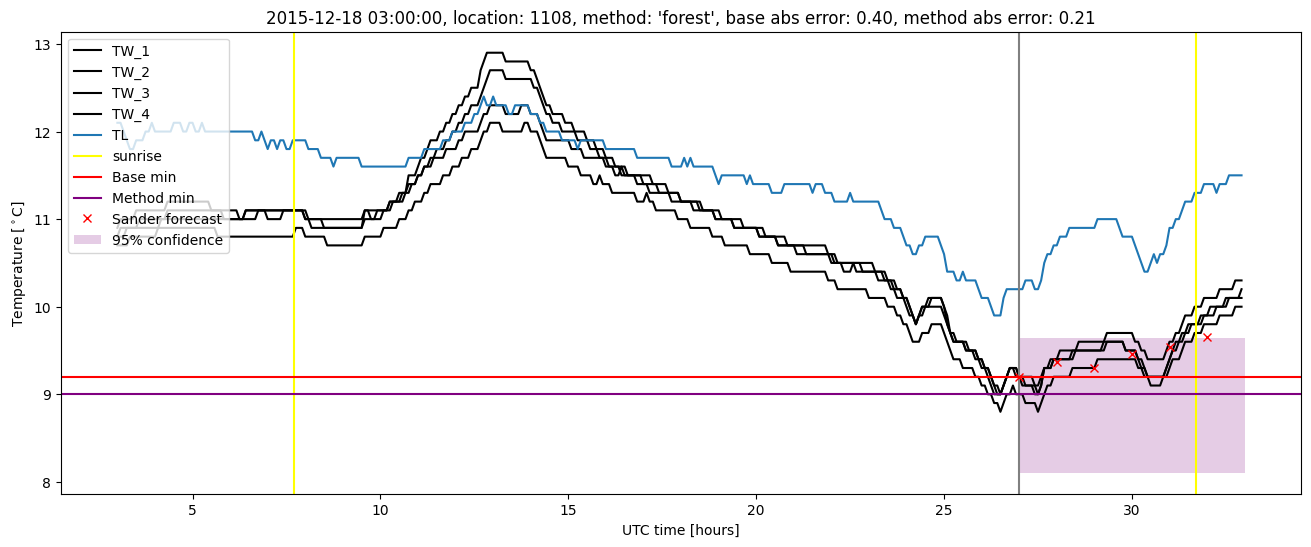
| forest |
winter 2018 |
0.977 |
0.116 |
0.338 |
0.413 |
3.447 |
0.532 |
3.667 |
| baseline |
winter 2019 |
0.993 |
0.000e+00 |
0.302 |
0.399 |
2.147 |
NaN |
NaN |
| forest |
winter 2019 |
0.986 |
0.000e+00 |
0.240 |
0.371 |
1.888 |
0.530 |
3.281 |
| baseline |
all |
0.980 |
0.092 |
0.390 |
0.431 |
3.692 |
NaN |
NaN |
| forest |
all |
0.973 |
0.061 |
0.318 |
0.399 |
3.447 |
0.529 |
3.334 |
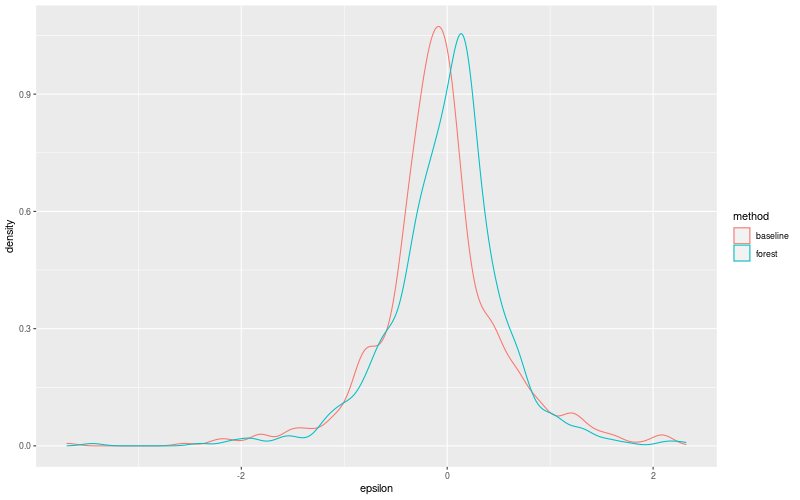
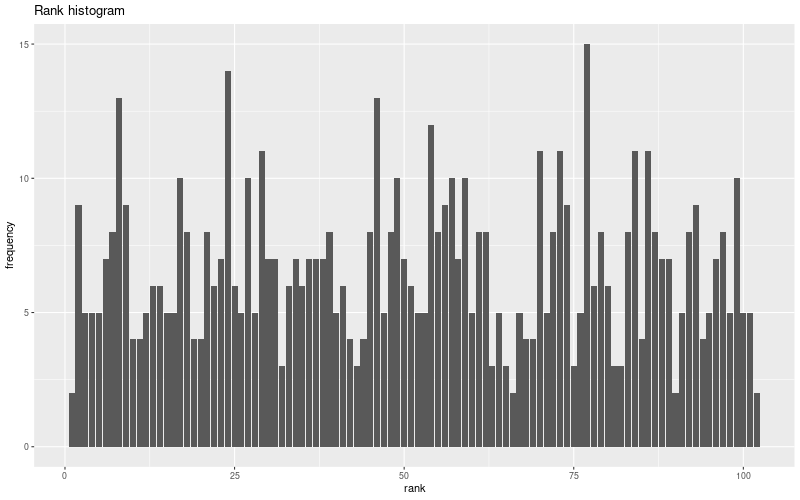
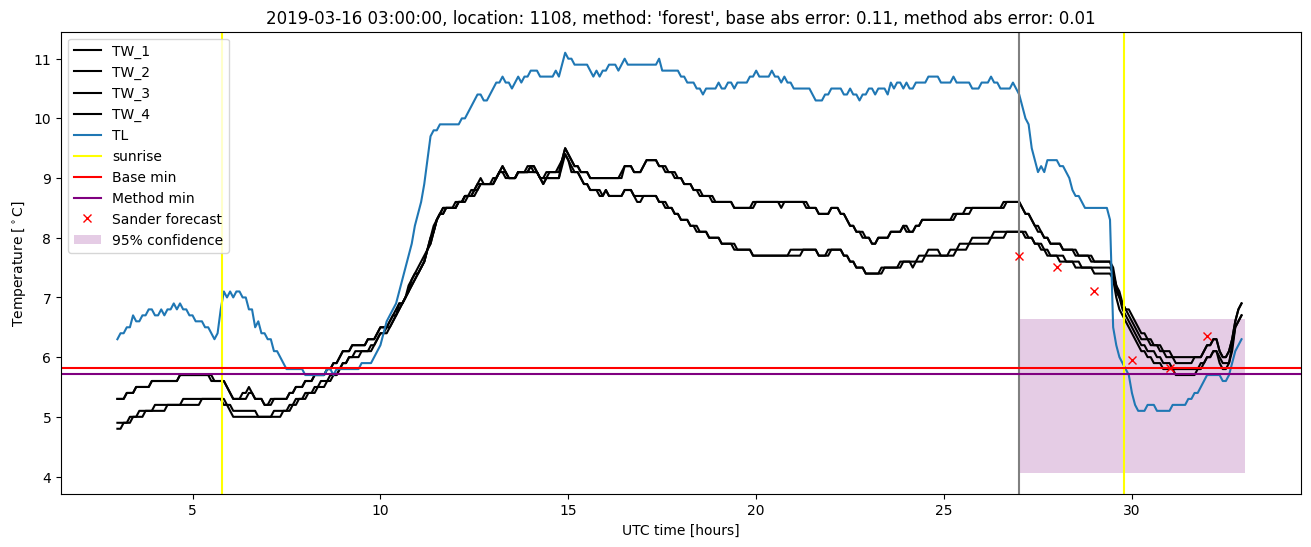
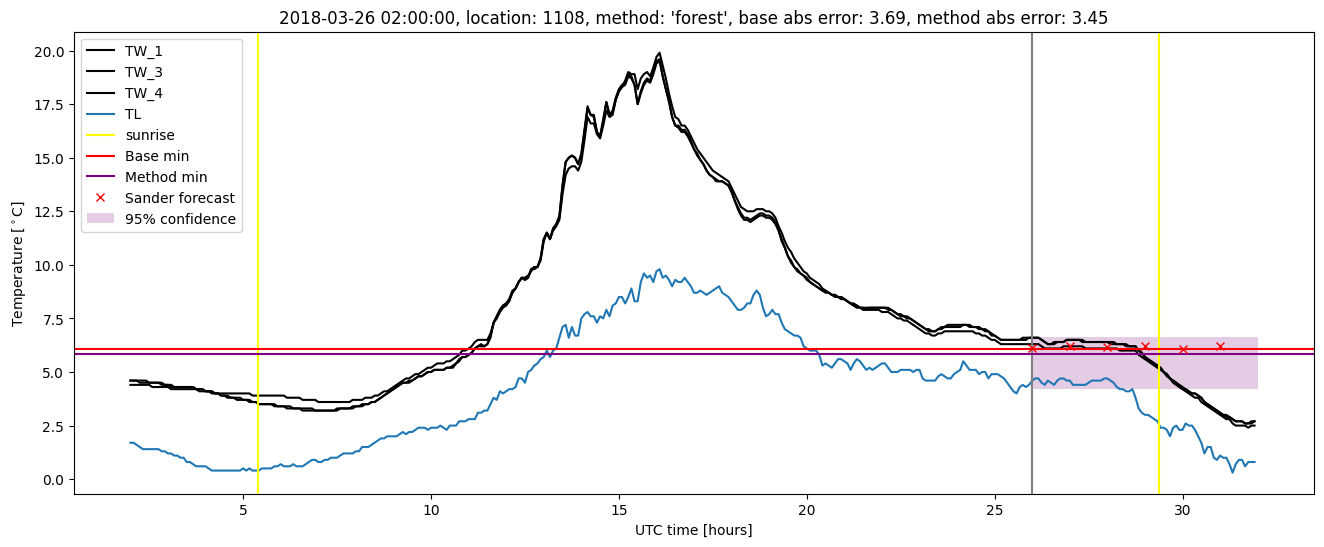
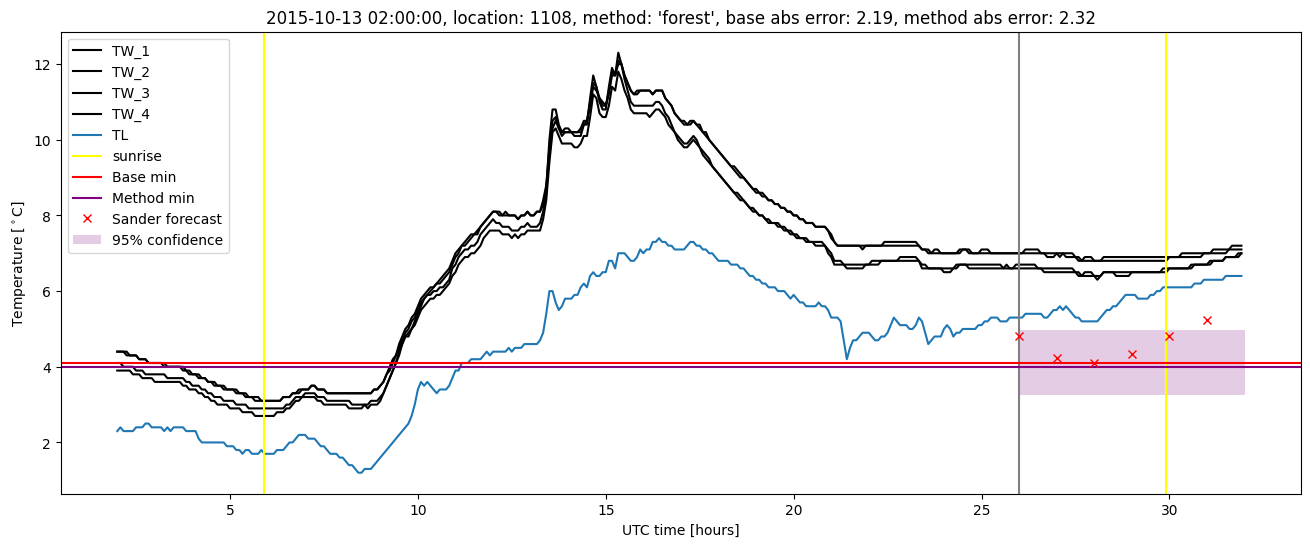
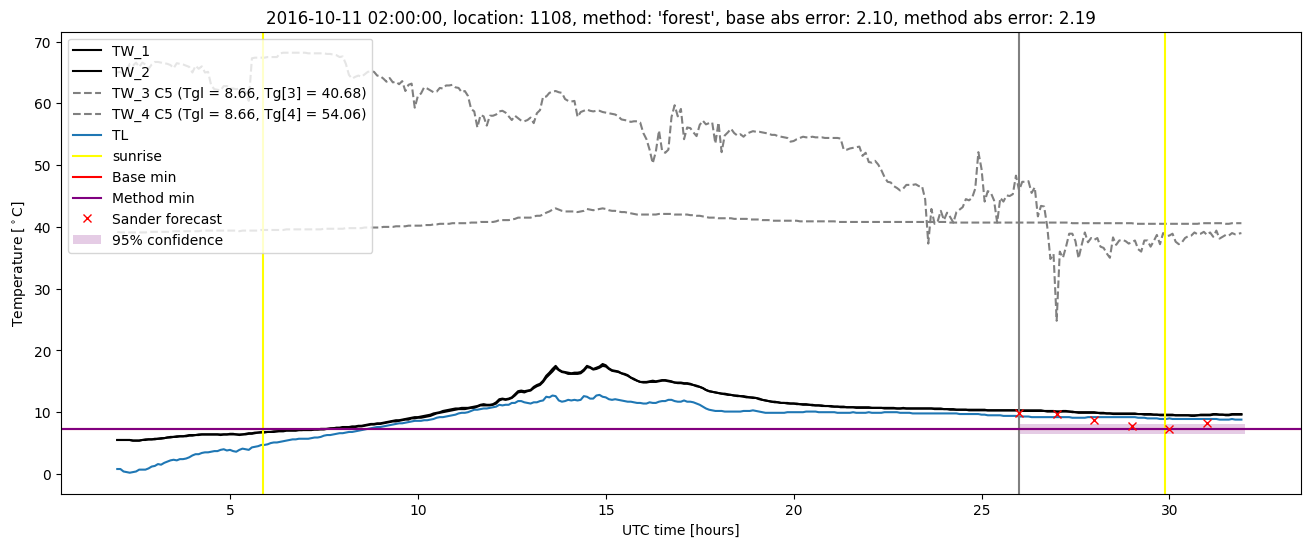
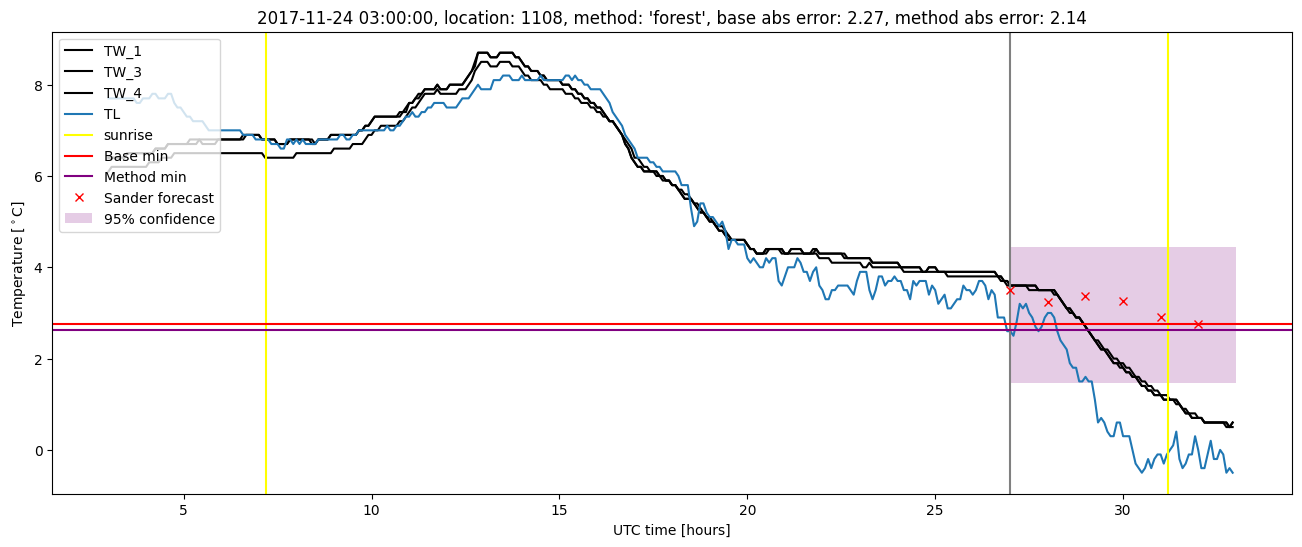
Random forest plots

Extended logistic regression results
| names |
period |
power |
significance |
meanSquareError |
absError |
maxError |
CRPS |
IGN |
| baseline |
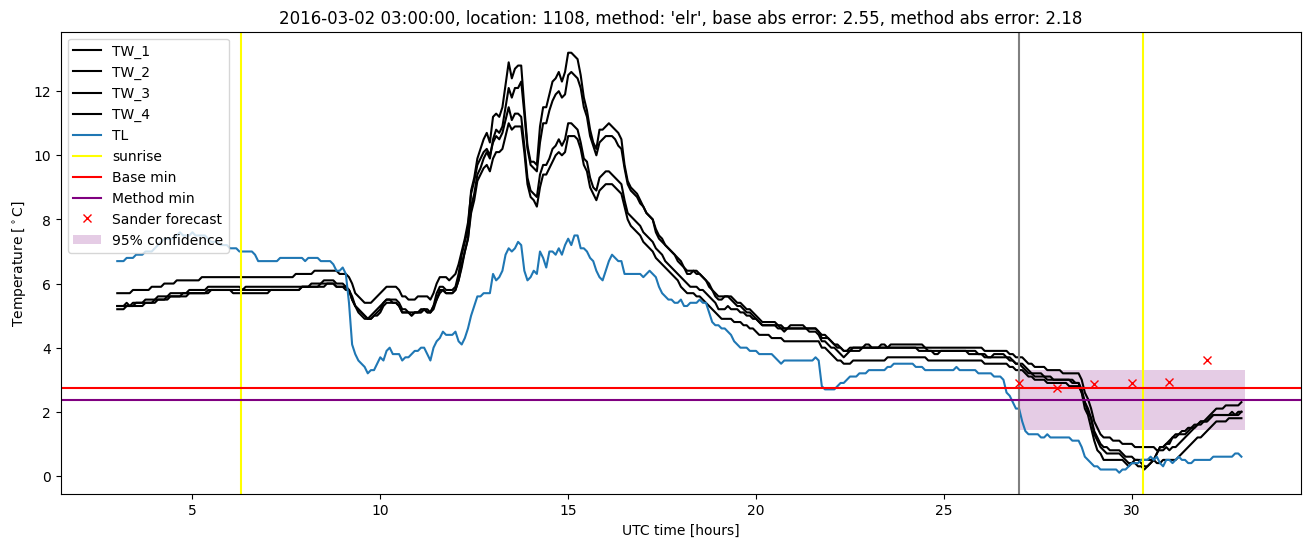
winter 2016 |
0.981 |
0.062 |
0.395 |
0.422 |
2.550 |
NaN |
NaN |
| elr |
winter 2016 |
0.975 |
0.031 |
0.352 |
0.432 |
2.258 |
0.618 |
4.498 |
| baseline |
winter 2017 |
0.964 |
0.048 |
0.465 |
0.471 |
2.101 |
NaN |
NaN |
| elr |
winter 2017 |
0.964 |
0.048 |
0.381 |
0.445 |
2.155 |
0.529 |
3.431 |
| baseline |
winter 2018 |
0.977 |
0.186 |
0.399 |
0.434 |
3.692 |
NaN |
NaN |
| elr |
winter 2018 |
0.977 |
0.186 |
0.366 |
0.434 |
3.462 |
0.591 |
3.890 |
| baseline |
winter 2019 |
0.993 |
0.000e+00 |
0.302 |
0.399 |
2.147 |
NaN |
NaN |
| elr |
winter 2019 |
0.993 |
0.000e+00 |
0.276 |
0.419 |
1.739 |
0.557 |
3.073 |
| baseline |
all |
0.980 |
0.092 |
0.390 |
0.431 |
3.692 |
NaN |
NaN |
| elr |
all |
0.978 |
0.085 |
0.344 |
0.433 |
3.462 |
0.577 |
3.766 |
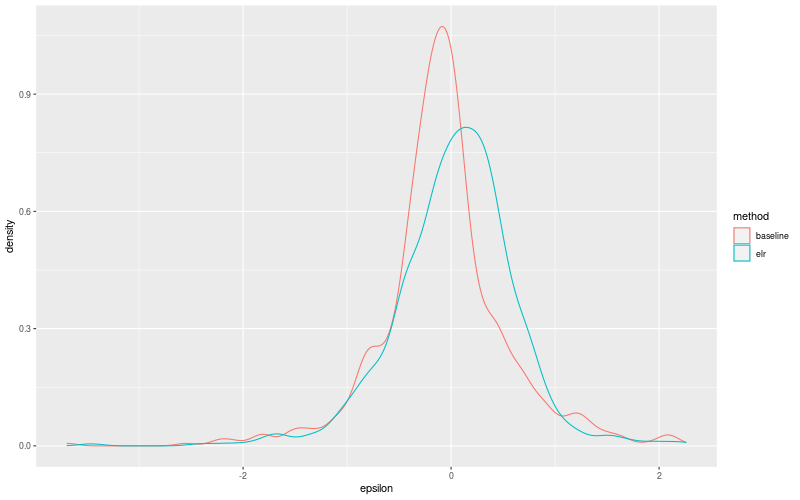
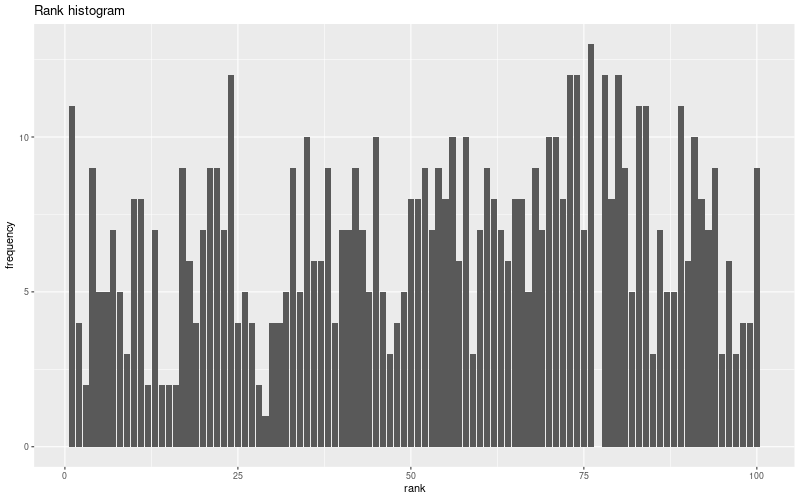
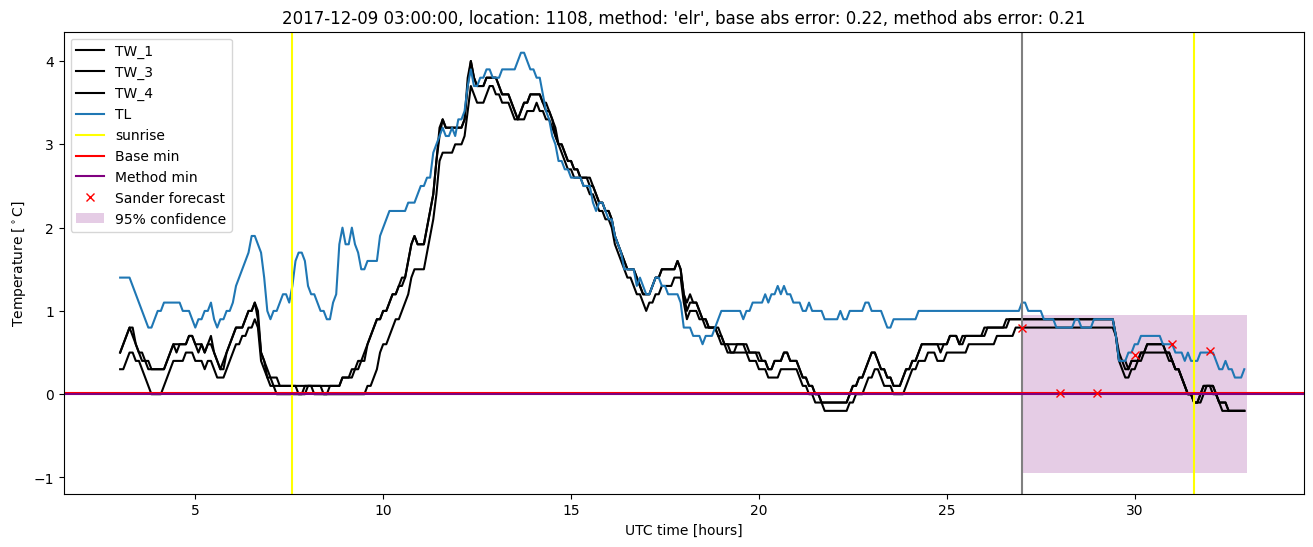
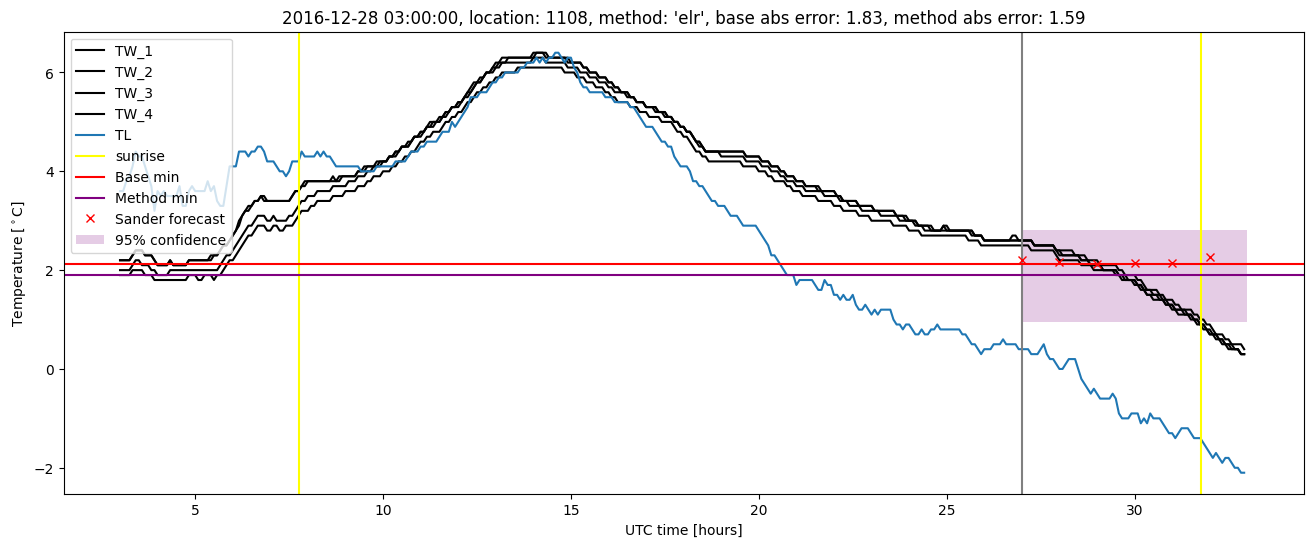
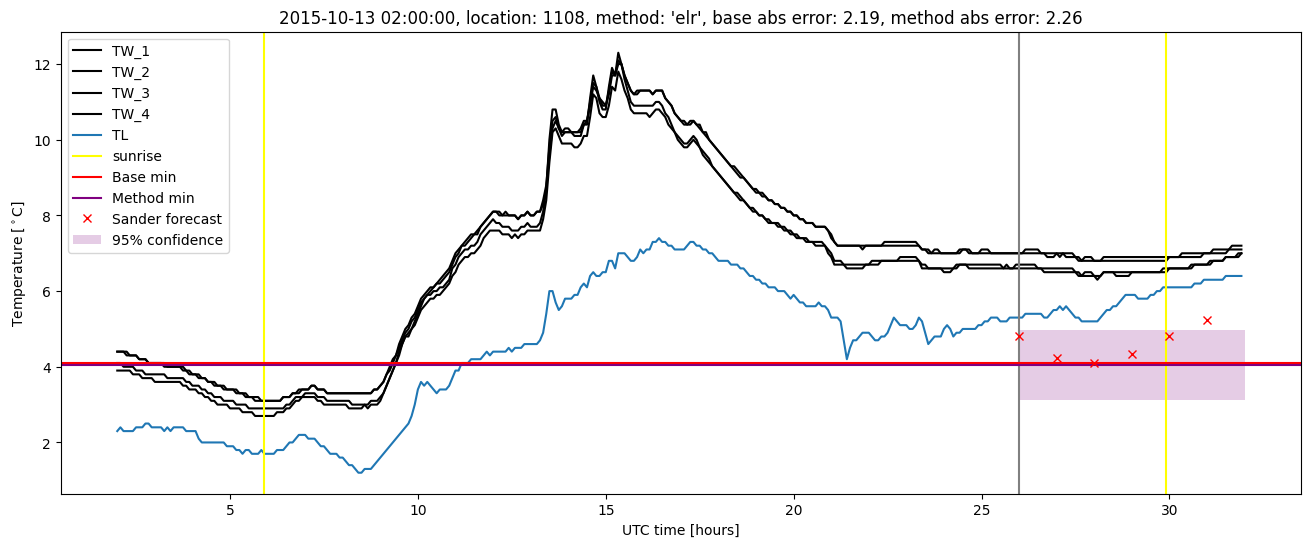
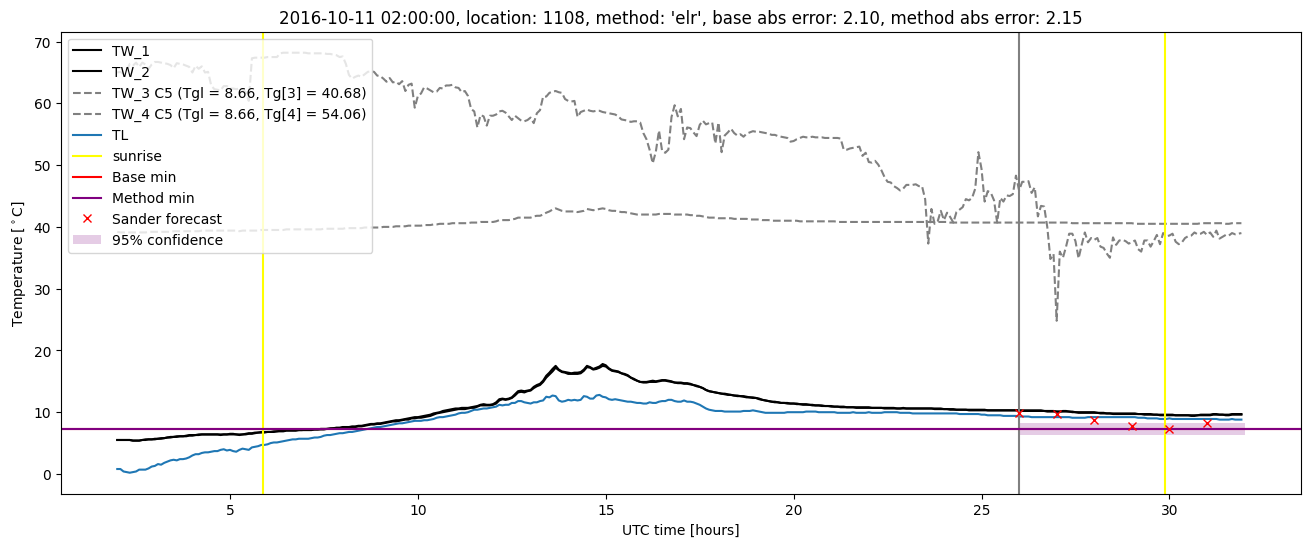
Extended logistic regression plots