GMS location: 1107
Random forest results
| names |
period |
power |
significance |
meanSquareError |
absError |
maxError |
CRPS |
IGN |
| baseline |
winter 2016 |
0.982 |
0.097 |
0.338 |
0.410 |
2.394 |
NaN |
NaN |
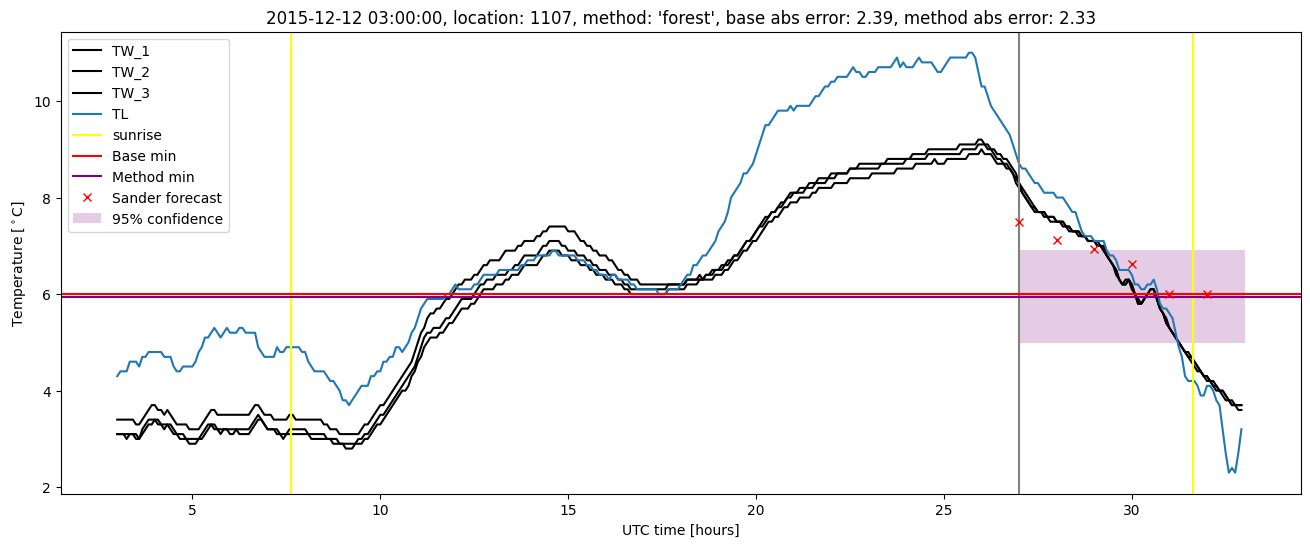
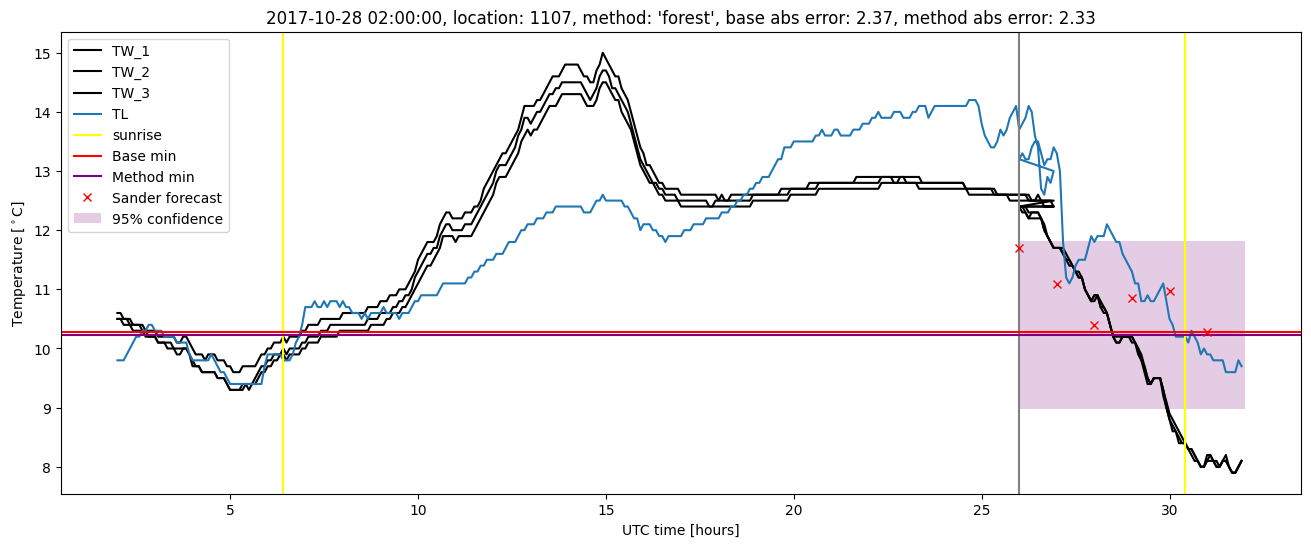
| forest |
winter 2016 |
0.959 |
0.065 |
0.317 |
0.388 |
2.332 |
0.490 |
3.281 |
| baseline |
winter 2017 |
0.982 |
0.049 |
0.492 |
0.473 |
2.773 |
NaN |
NaN |
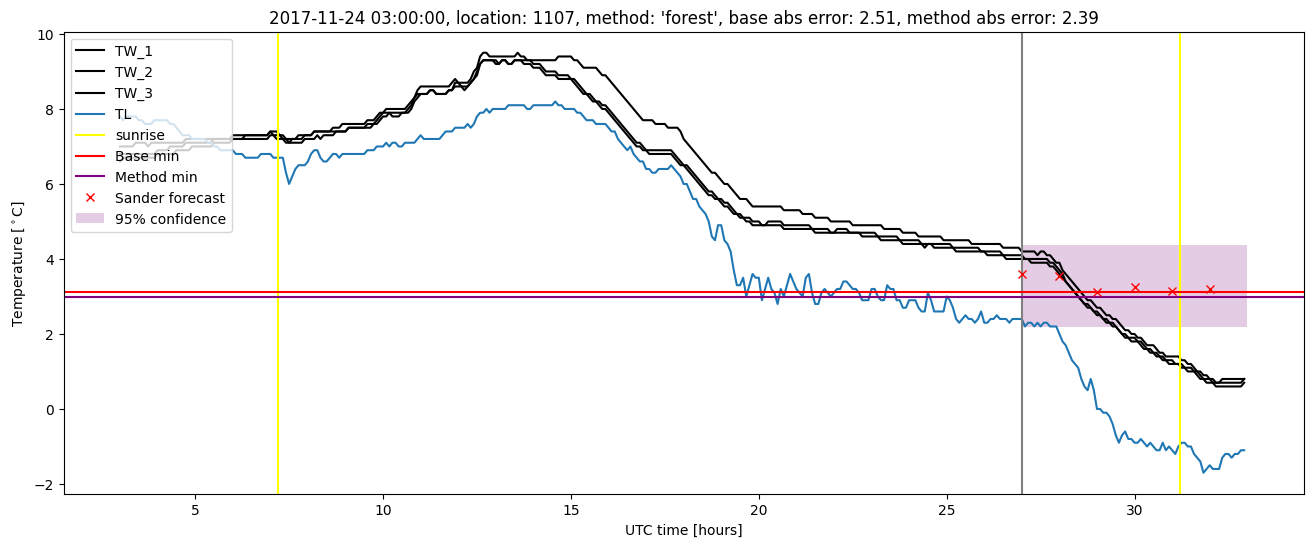
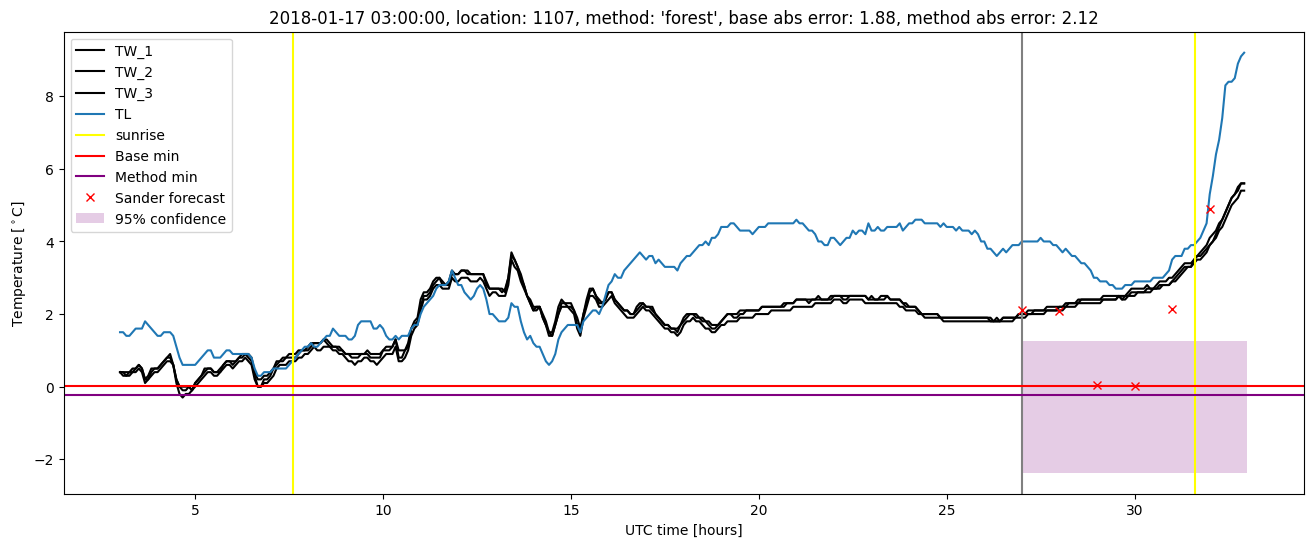
| forest |
winter 2017 |
0.991 |
0.000e+00 |
0.382 |
0.424 |
2.100 |
0.497 |
3.744 |
| baseline |
winter 2018 |
0.993 |
0.184 |
0.453 |
0.476 |
2.509 |
NaN |
NaN |
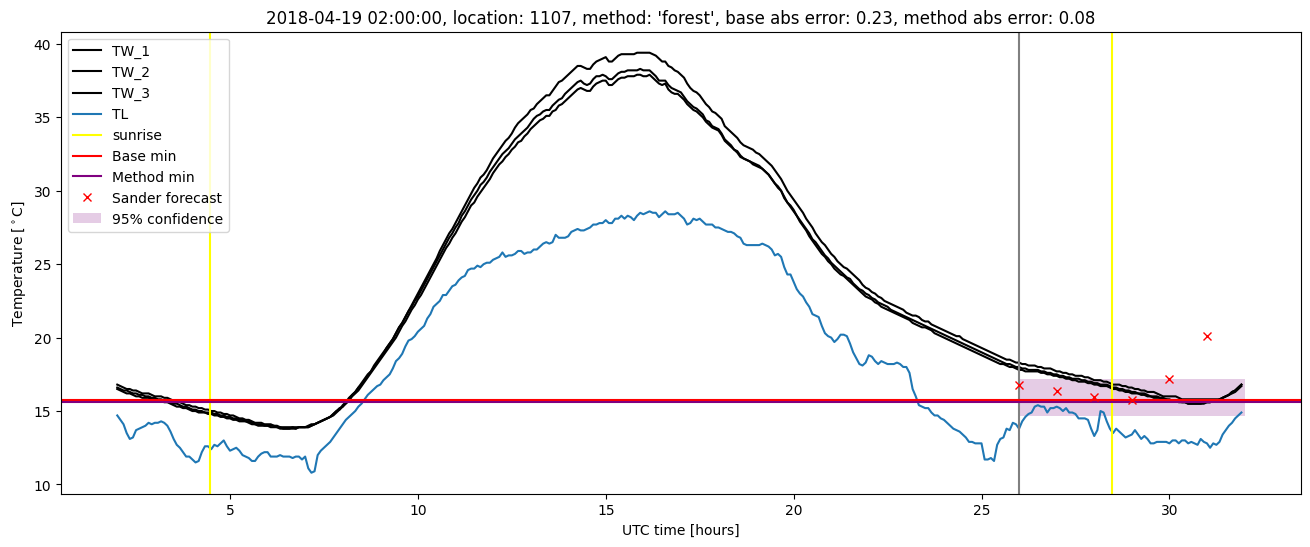
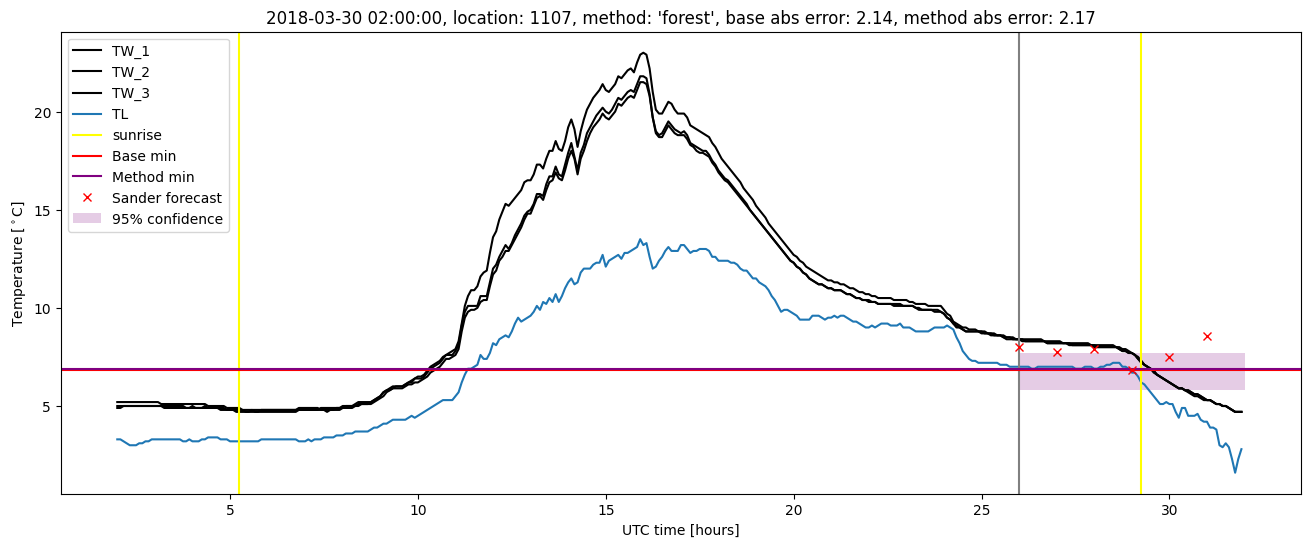
| forest |
winter 2018 |
0.986 |
0.184 |
0.402 |
0.450 |
2.393 |
0.481 |
3.404 |
| baseline |
winter 2019 |
0.993 |
0.000e+00 |
0.269 |
0.368 |
1.992 |
NaN |
NaN |
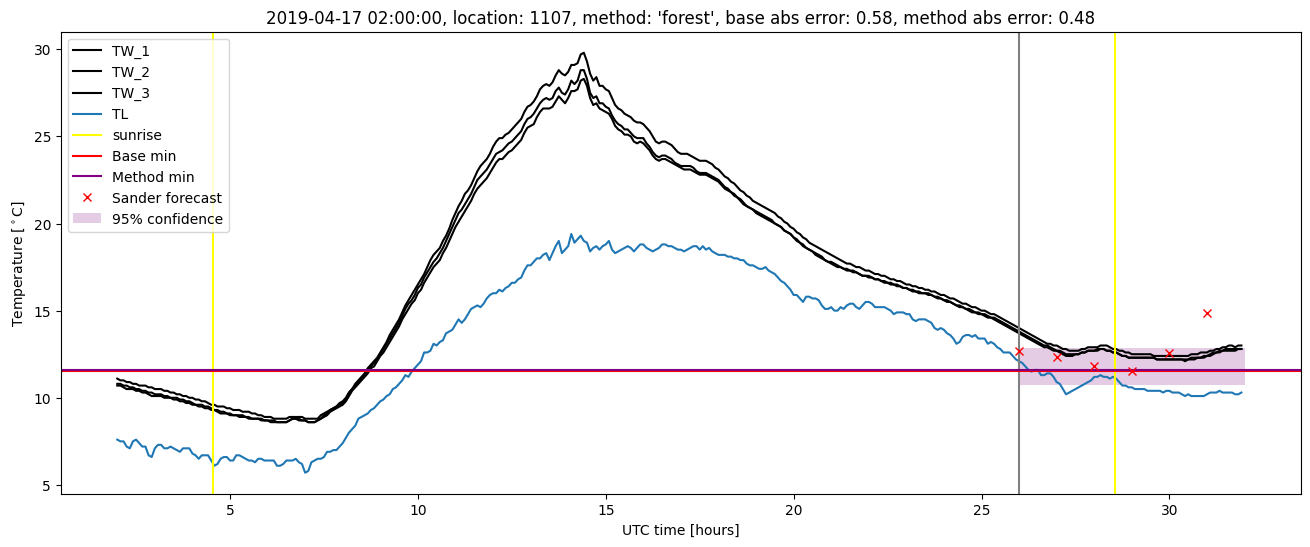
| forest |
winter 2019 |
0.993 |
0.000e+00 |
0.220 |
0.353 |
1.489 |
0.482 |
3.331 |
| baseline |
all |
0.988 |
0.098 |
0.388 |
0.432 |
2.773 |
NaN |
NaN |
| forest |
all |
0.980 |
0.074 |
0.333 |
0.405 |
2.393 |
0.488 |
3.428 |
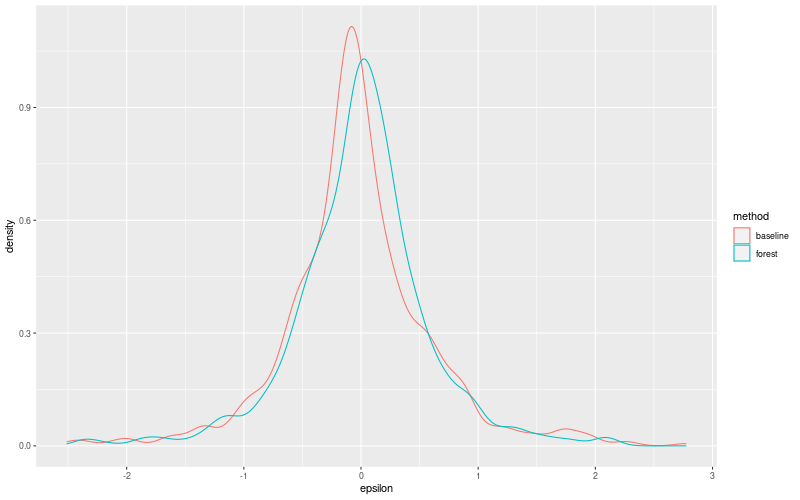
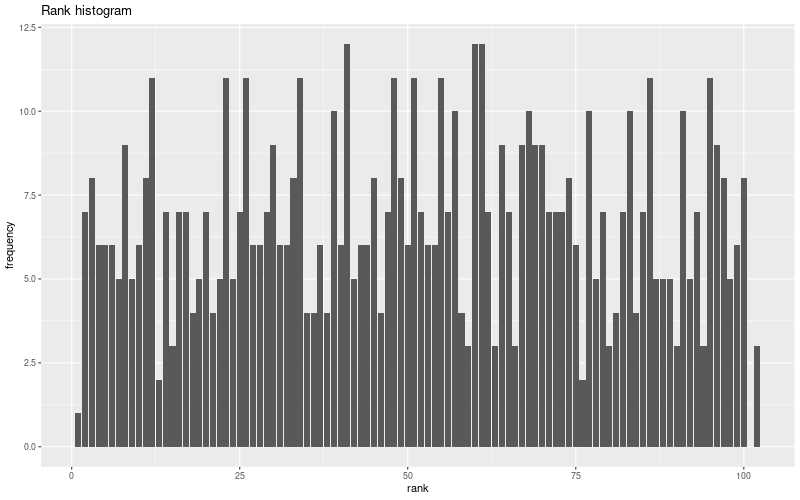
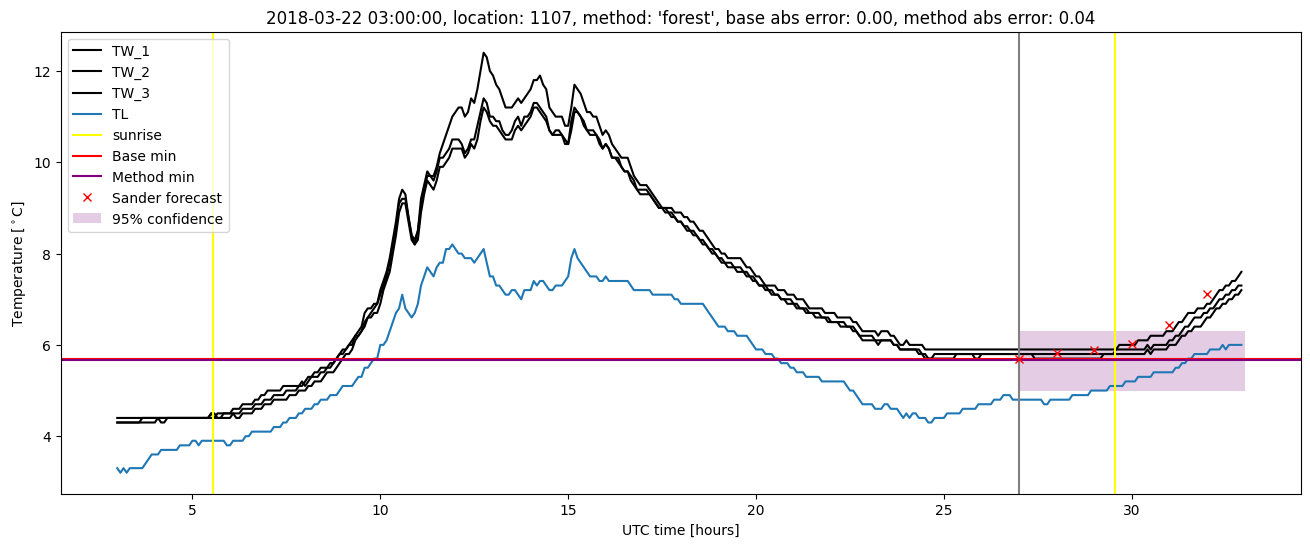
Random forest plots
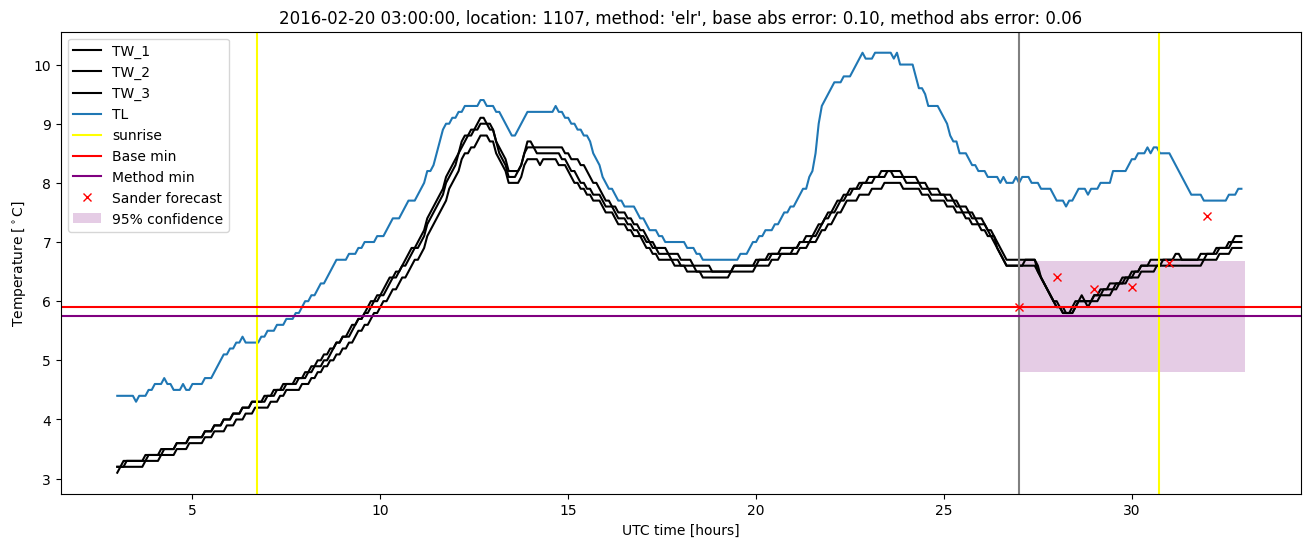
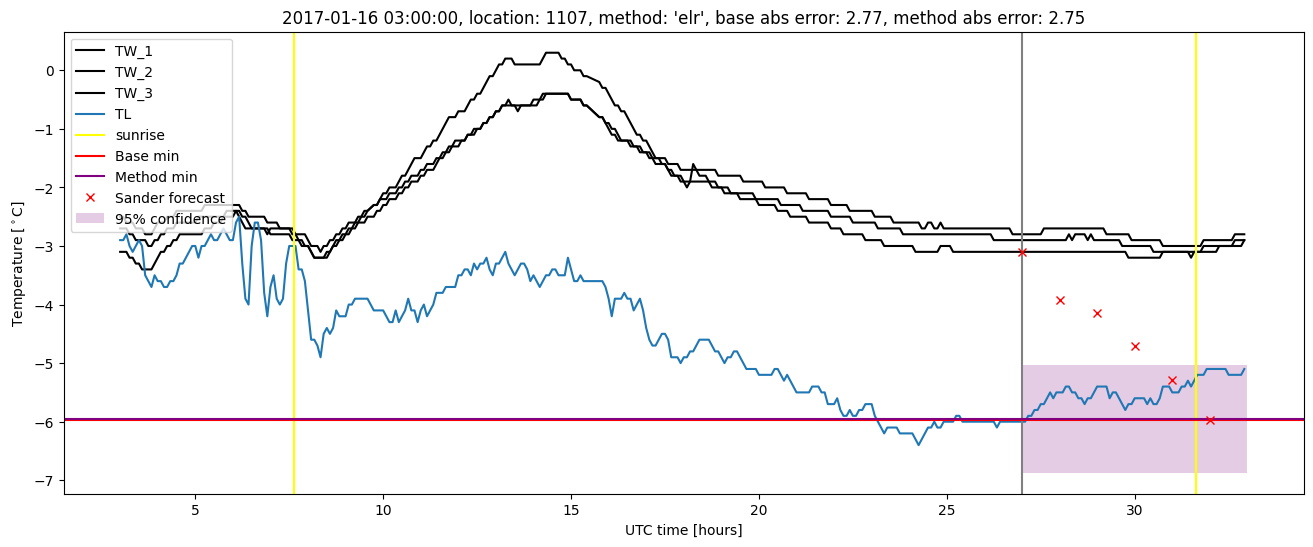
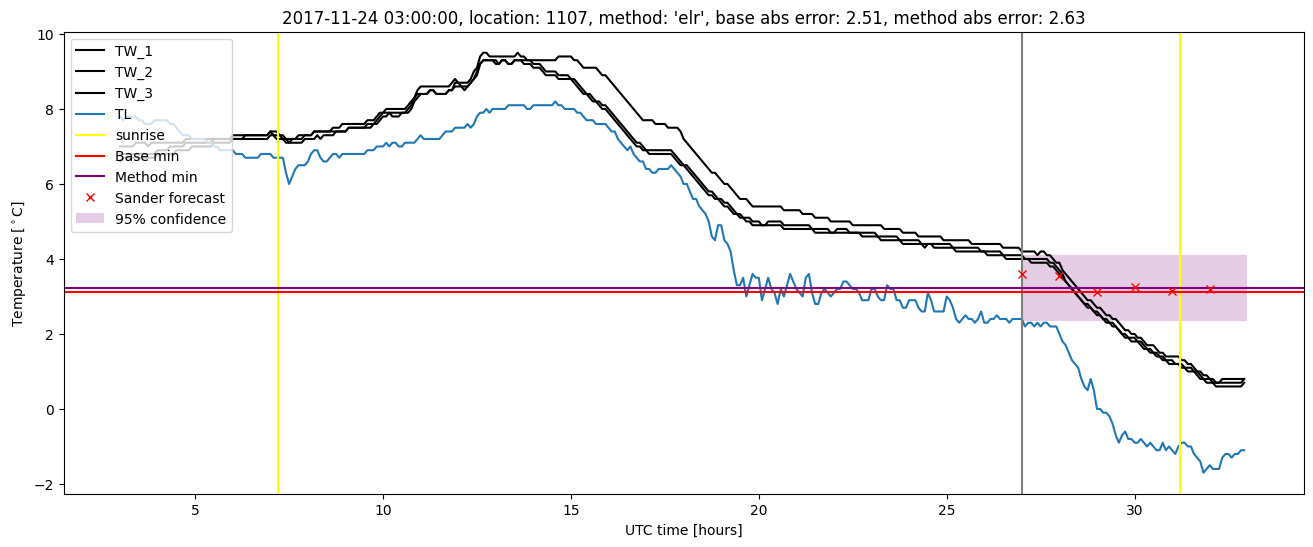
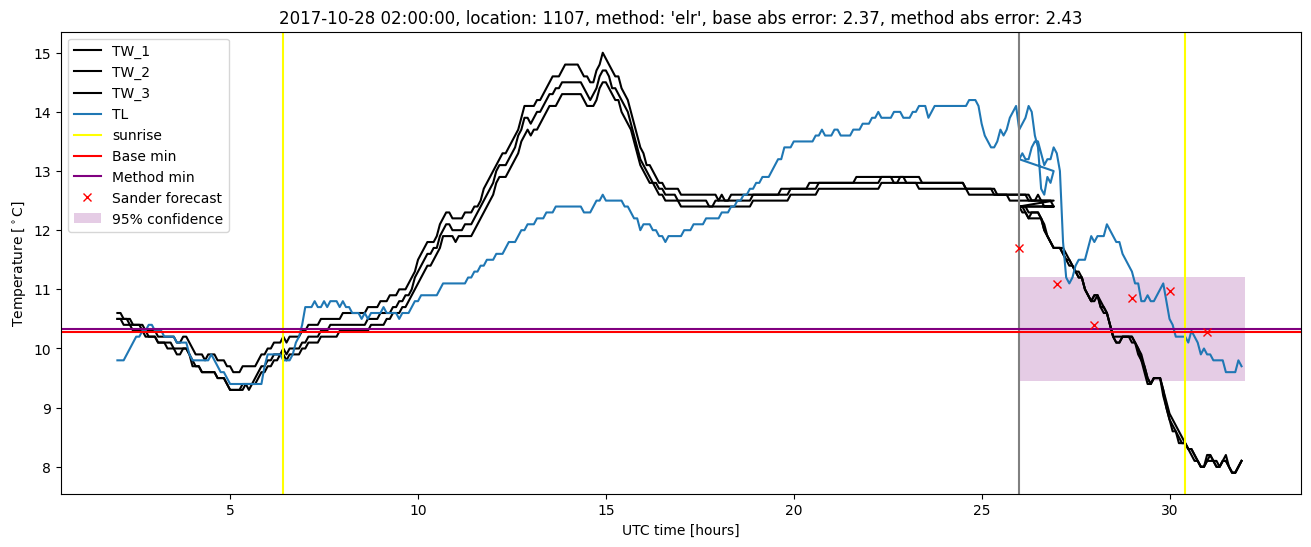
Extended logistic regression results
| names |
period |
power |
significance |
meanSquareError |
absError |
maxError |
CRPS |
IGN |
| baseline |
winter 2016 |
0.982 |
0.097 |
0.338 |
0.410 |
2.394 |
NaN |
NaN |
| elr |
winter 2016 |
0.977 |
0.065 |
0.340 |
0.418 |
2.448 |
0.568 |
3.853 |
| baseline |
winter 2017 |
0.982 |
0.049 |
0.492 |
0.473 |
2.773 |
NaN |
NaN |
| elr |
winter 2017 |
0.973 |
0.024 |
0.464 |
0.468 |
2.749 |
0.554 |
3.849 |
| baseline |
winter 2018 |
0.993 |
0.184 |
0.453 |
0.476 |
2.509 |
NaN |
NaN |
| elr |
winter 2018 |
0.993 |
0.210 |
0.479 |
0.506 |
2.629 |
0.569 |
4.762 |
| baseline |
winter 2019 |
0.993 |
0.000e+00 |
0.269 |
0.368 |
1.992 |
NaN |
NaN |
| elr |
winter 2019 |
0.993 |
0.000e+00 |
0.286 |
0.420 |
1.782 |
0.523 |
2.937 |
| baseline |
all |
0.988 |
0.098 |
0.388 |
0.432 |
2.773 |
NaN |
NaN |
| elr |
all |
0.984 |
0.090 |
0.393 |
0.453 |
2.749 |
0.555 |
3.893 |
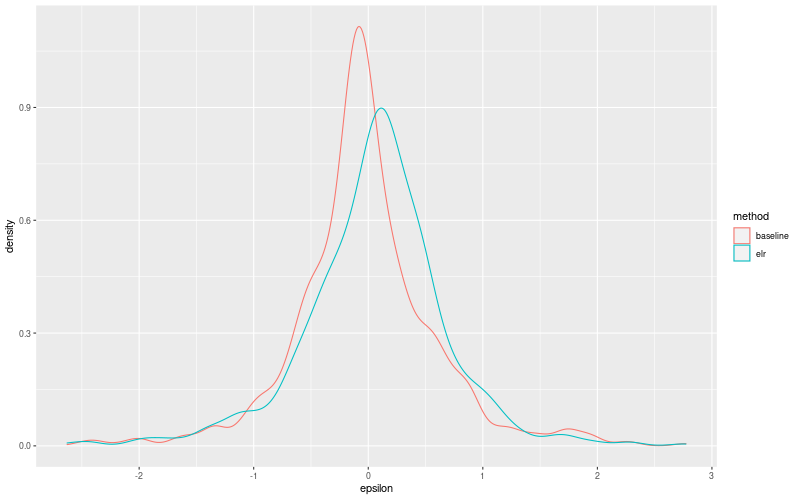
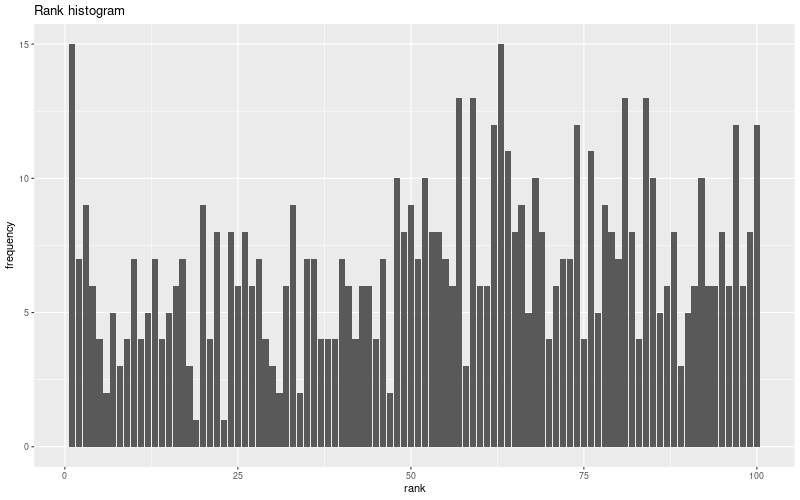
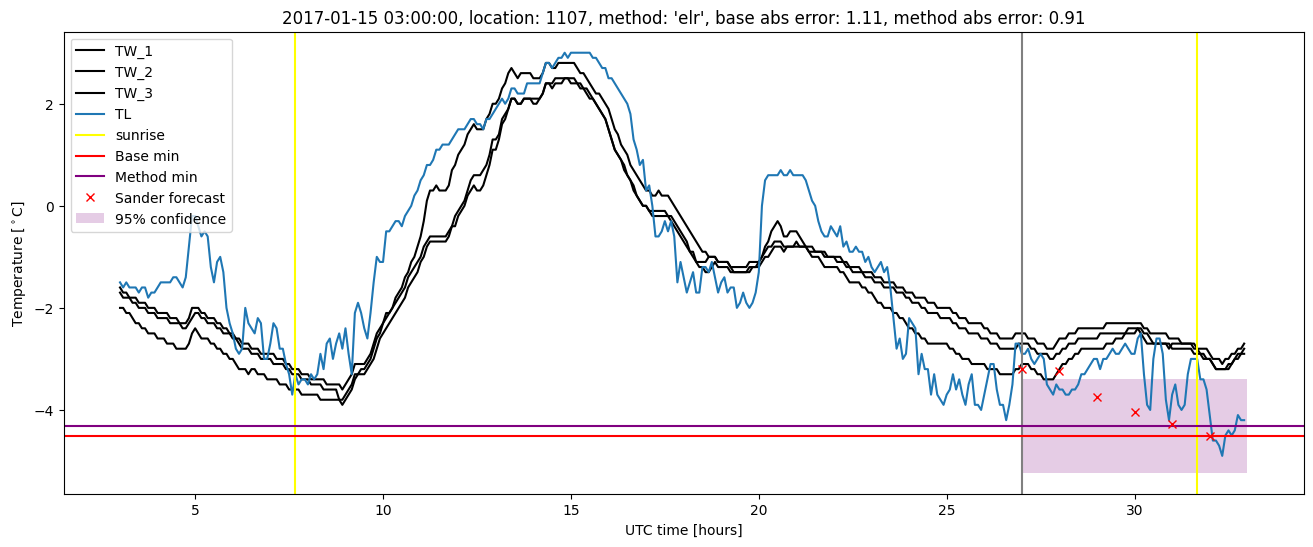
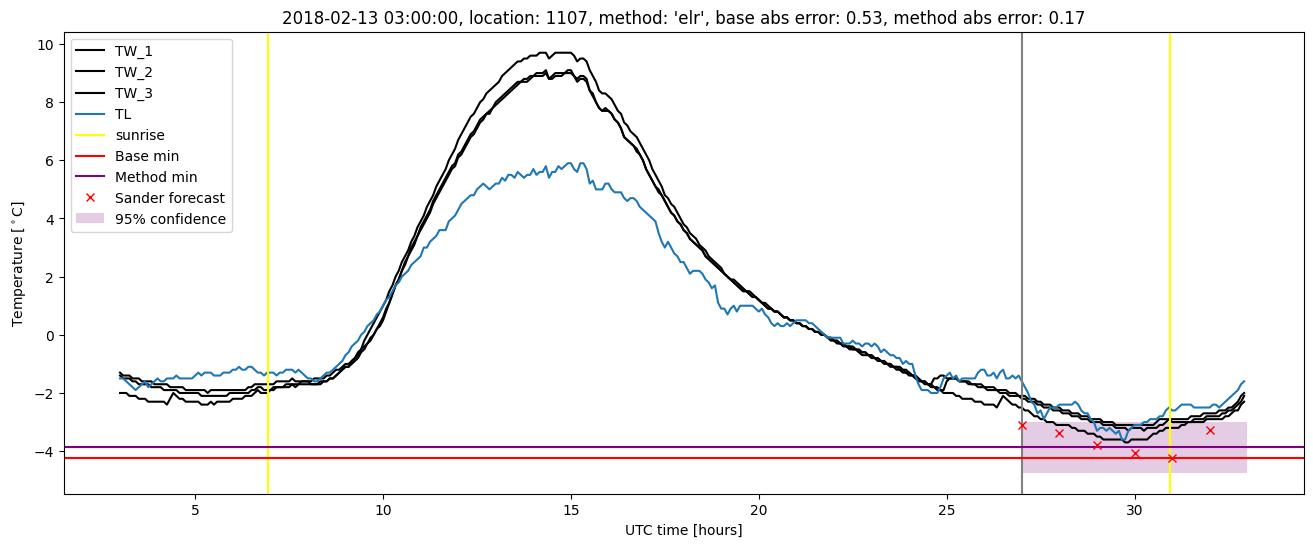
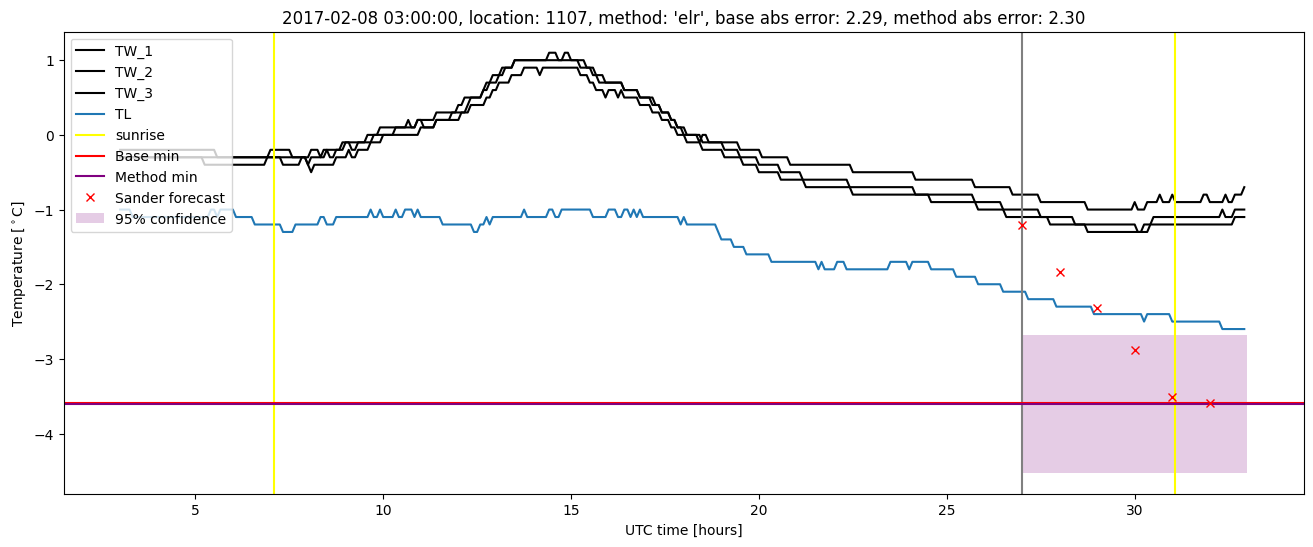
Extended logistic regression plots