GMS location: 1106
Random forest results
| names |
period |
power |
significance |
meanSquareError |
absError |
maxError |
CRPS |
IGN |
| baseline |
winter 2016 |
0.983 |
0.100 |
0.468 |
0.471 |
3.497 |
NaN |
NaN |
| forest |
winter 2016 |
0.972 |
0.033 |
0.464 |
0.470 |
3.396 |
0.470 |
3.056 |
| baseline |
winter 2017 |
0.991 |
0.043 |
0.425 |
0.458 |
2.306 |
NaN |
NaN |
| forest |
winter 2017 |
0.981 |
0.022 |
0.358 |
0.422 |
2.163 |
0.479 |
1.916 |
| baseline |
winter 2018 |
1.000 |
NaN |
0.205 |
0.341 |
1.283 |
NaN |
NaN |
| forest |
winter 2018 |
1.000 |
NaN |
0.333 |
0.471 |
1.366 |
0.535 |
2.041 |
| baseline |
winter 2019 |
1.000 |
0.000e+00 |
0.320 |
0.444 |
1.434 |
NaN |
NaN |
| forest |
winter 2019 |
1.000 |
0.000e+00 |
0.244 |
0.360 |
1.392 |
0.503 |
2.039 |
| baseline |
all |
0.988 |
0.061 |
0.425 |
0.457 |
3.497 |
NaN |
NaN |
| forest |
all |
0.979 |
0.024 |
0.398 |
0.442 |
3.396 |
0.480 |
2.495 |
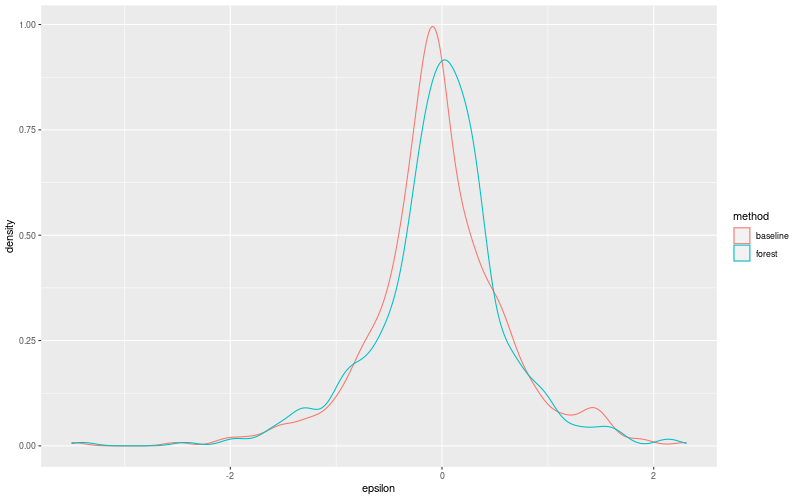
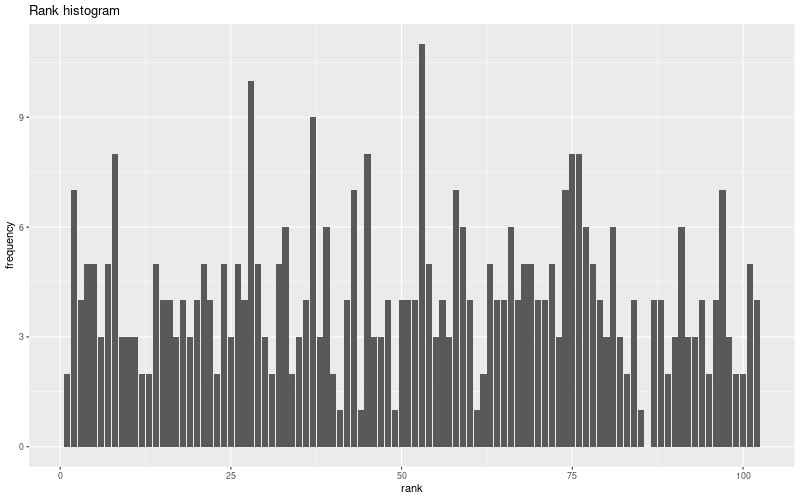
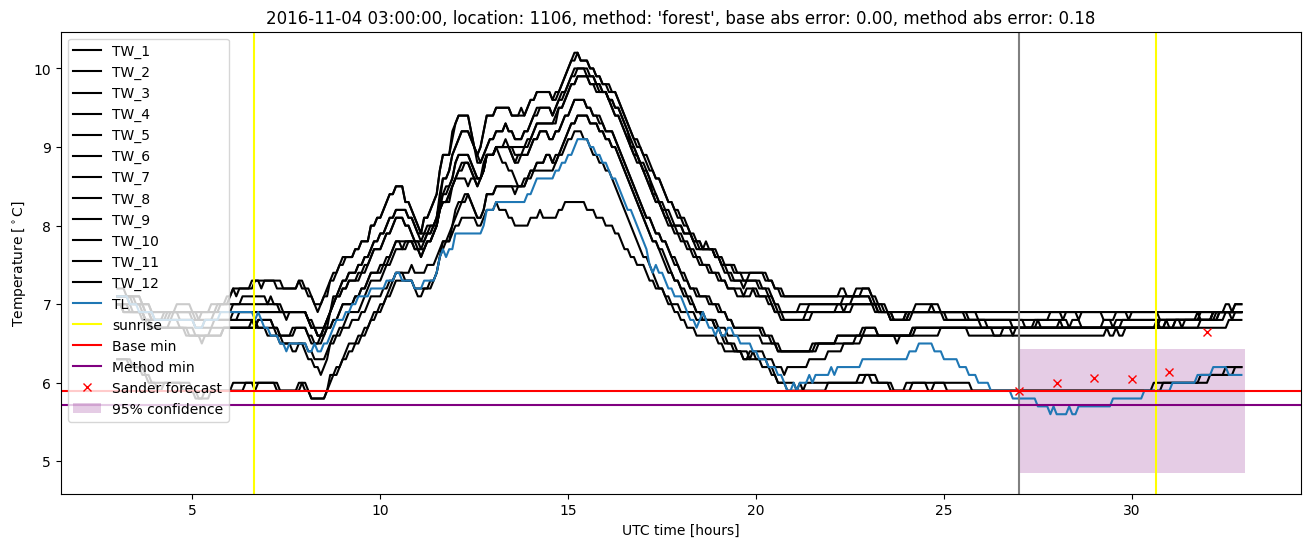
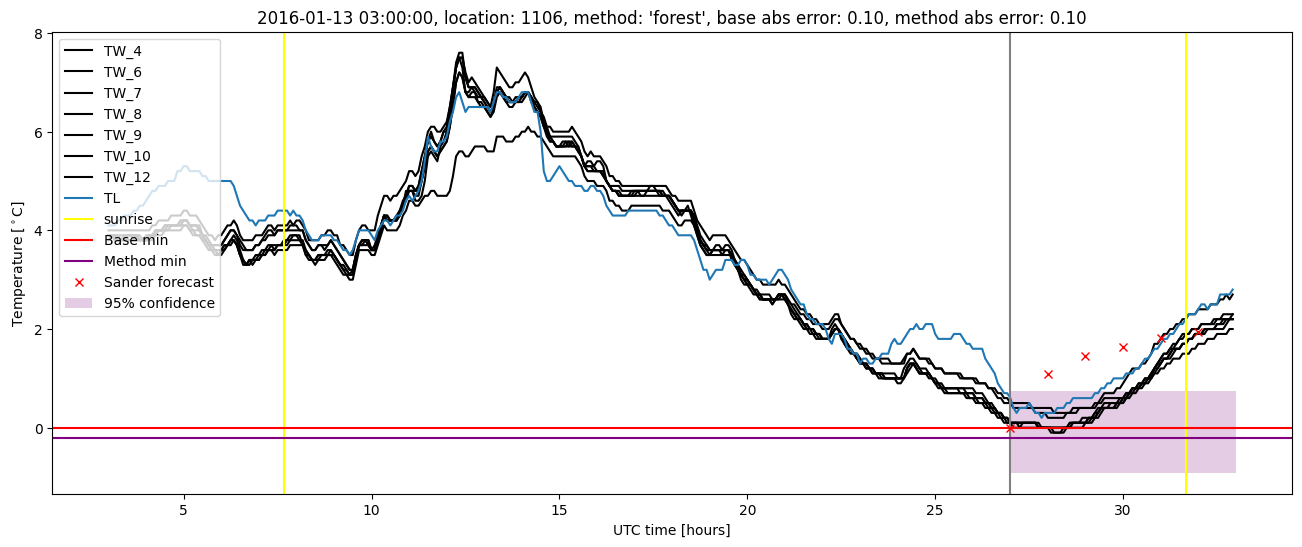
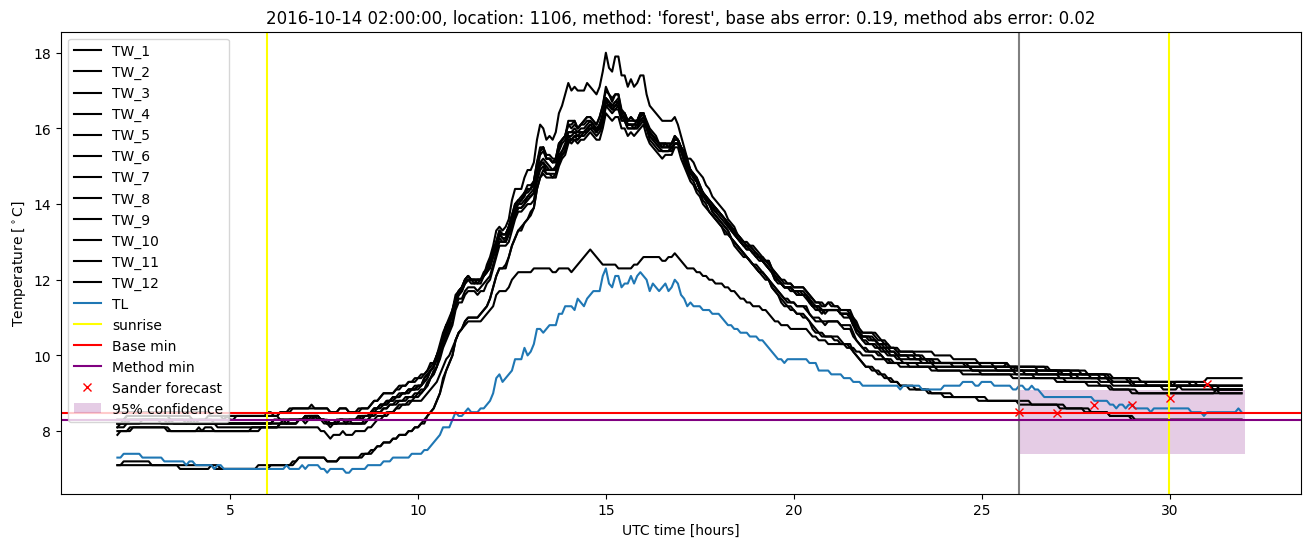
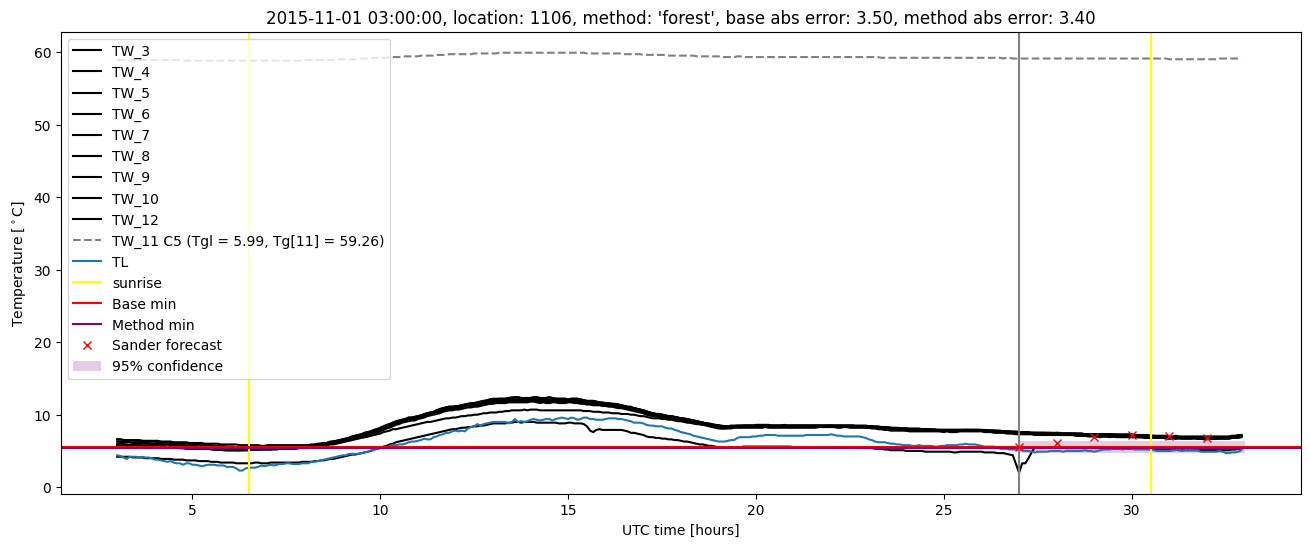
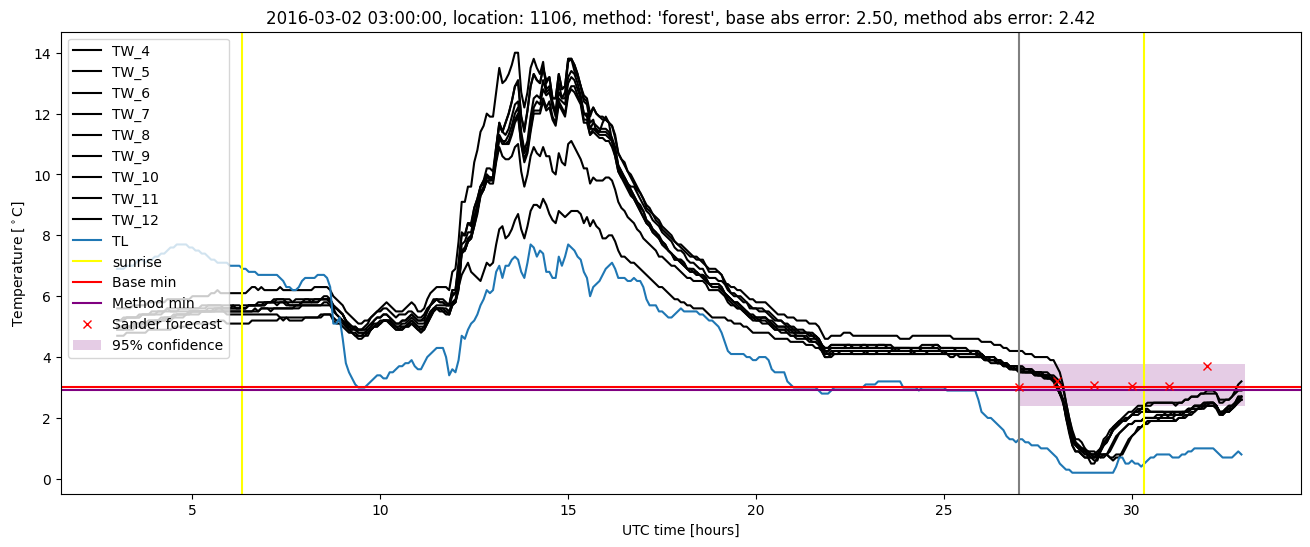
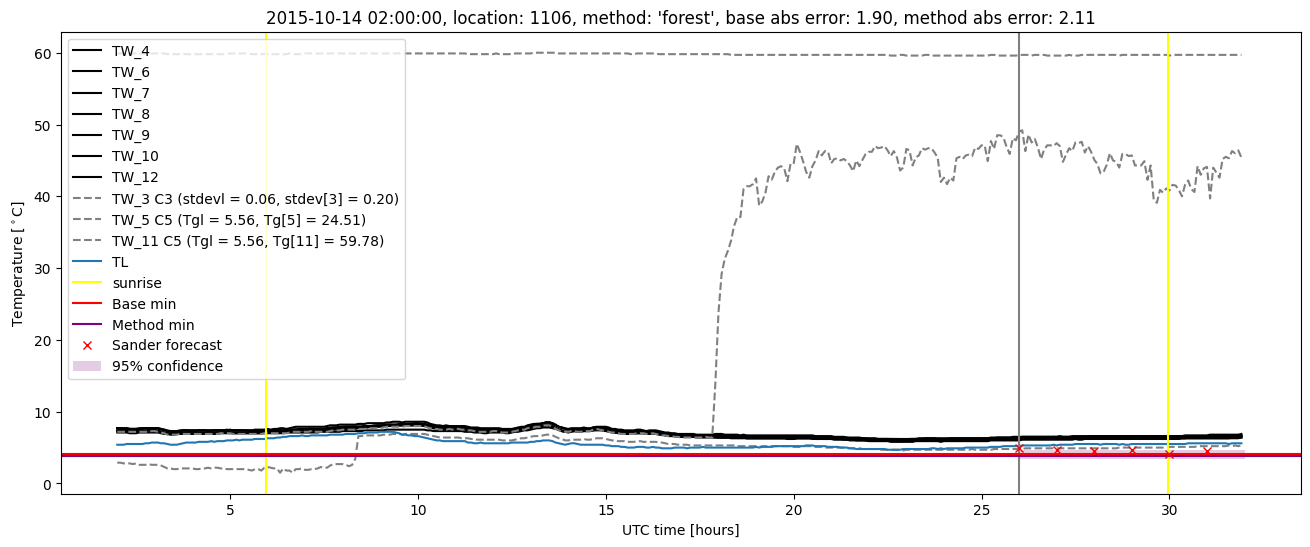
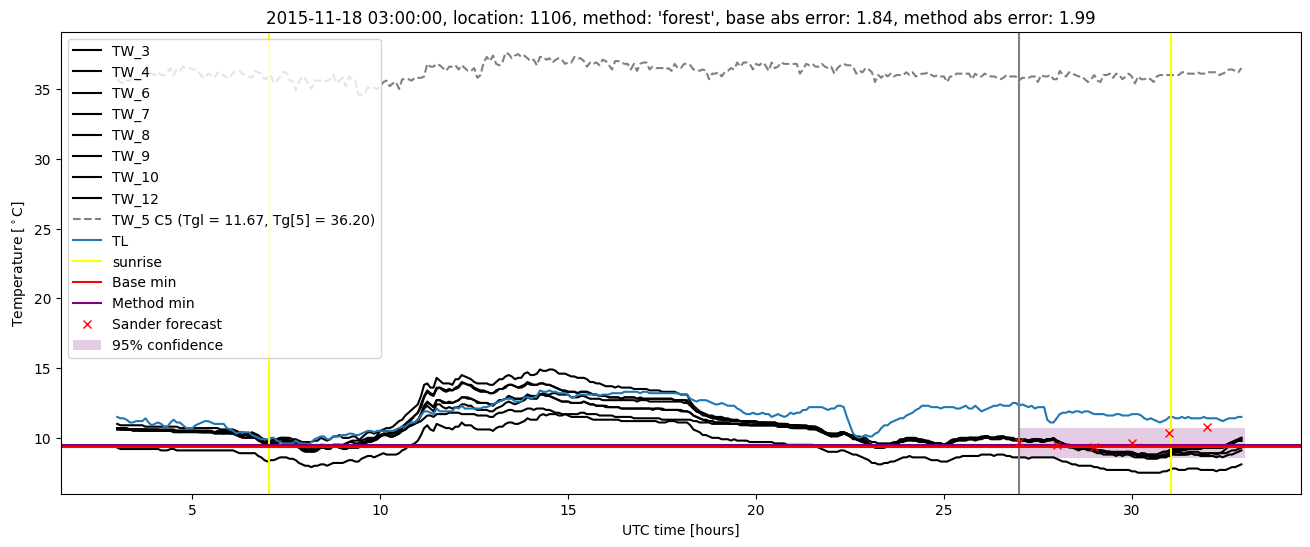
Random forest plots

Extended logistic regression results
| names |
period |
power |
significance |
meanSquareError |
absError |
maxError |
CRPS |
IGN |
| baseline |
winter 2016 |
0.983 |
0.100 |
0.468 |
0.471 |
3.497 |
NaN |
NaN |
| elr |
winter 2016 |
0.955 |
0.033 |
0.549 |
0.570 |
3.301 |
0.668 |
5.365 |
| baseline |
winter 2017 |
0.991 |
0.043 |
0.425 |
0.458 |
2.306 |
NaN |
NaN |
| elr |
winter 2017 |
0.981 |
0.043 |
0.413 |
0.474 |
2.088 |
0.585 |
3.864 |
| baseline |
winter 2018 |
1.000 |
NaN |
0.205 |
0.341 |
1.283 |
NaN |
NaN |
| elr |
winter 2018 |
1.000 |
NaN |
0.467 |
0.604 |
1.472 |
0.719 |
5.001 |
| baseline |
winter 2019 |
1.000 |
0.000e+00 |
0.320 |
0.444 |
1.434 |
NaN |
NaN |
| elr |
winter 2019 |
1.000 |
0.000e+00 |
0.253 |
0.426 |
1.021 |
0.603 |
3.323 |
| baseline |
all |
0.988 |
0.061 |
0.425 |
0.457 |
3.497 |
NaN |
NaN |
| elr |
all |
0.971 |
0.037 |
0.467 |
0.523 |
3.301 |
0.634 |
4.606 |
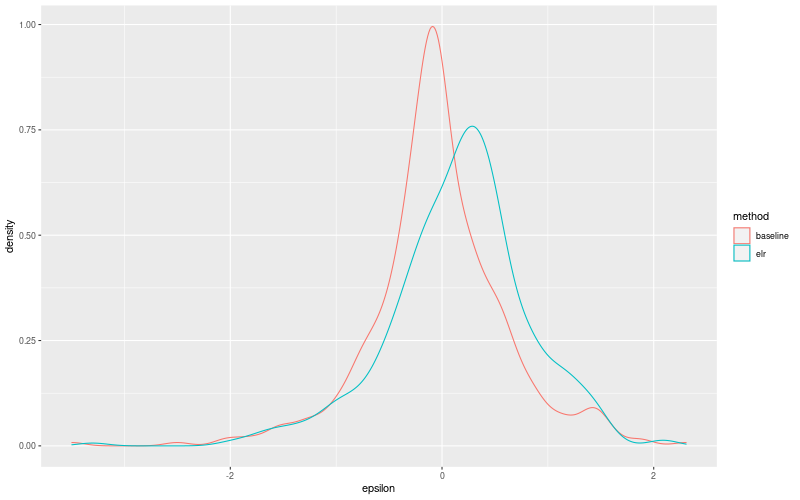
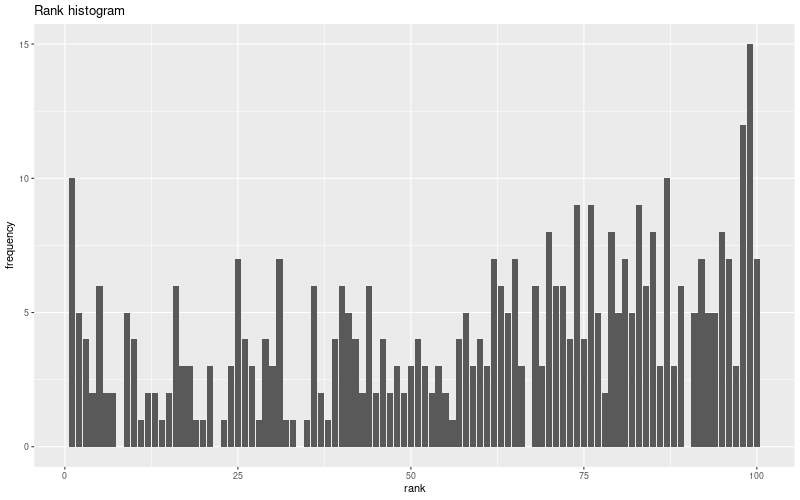
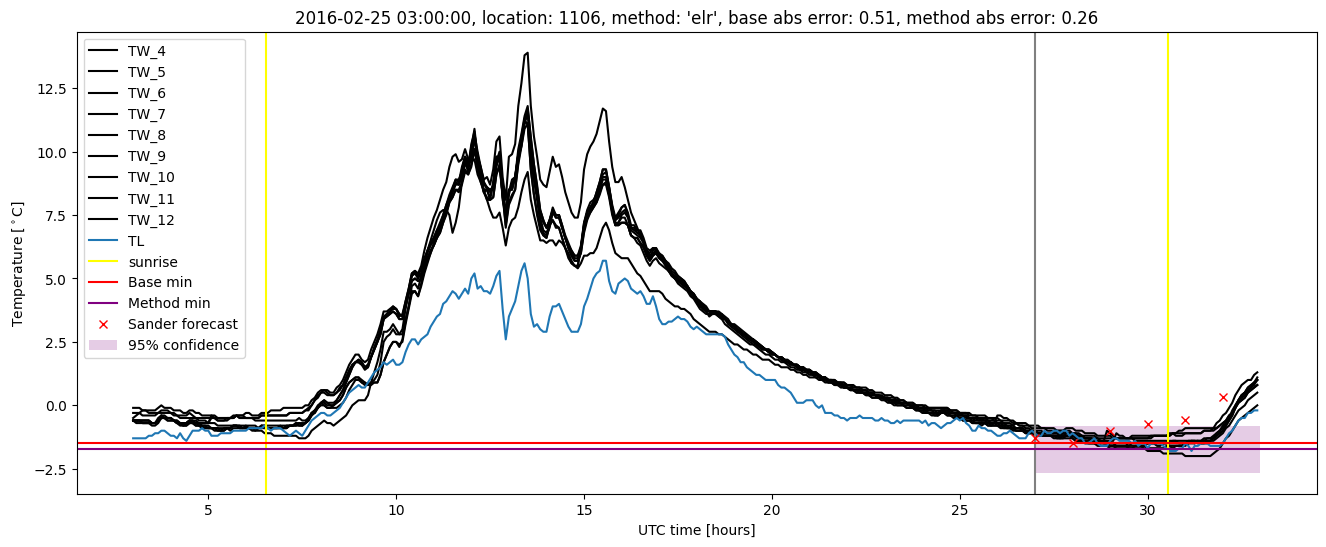
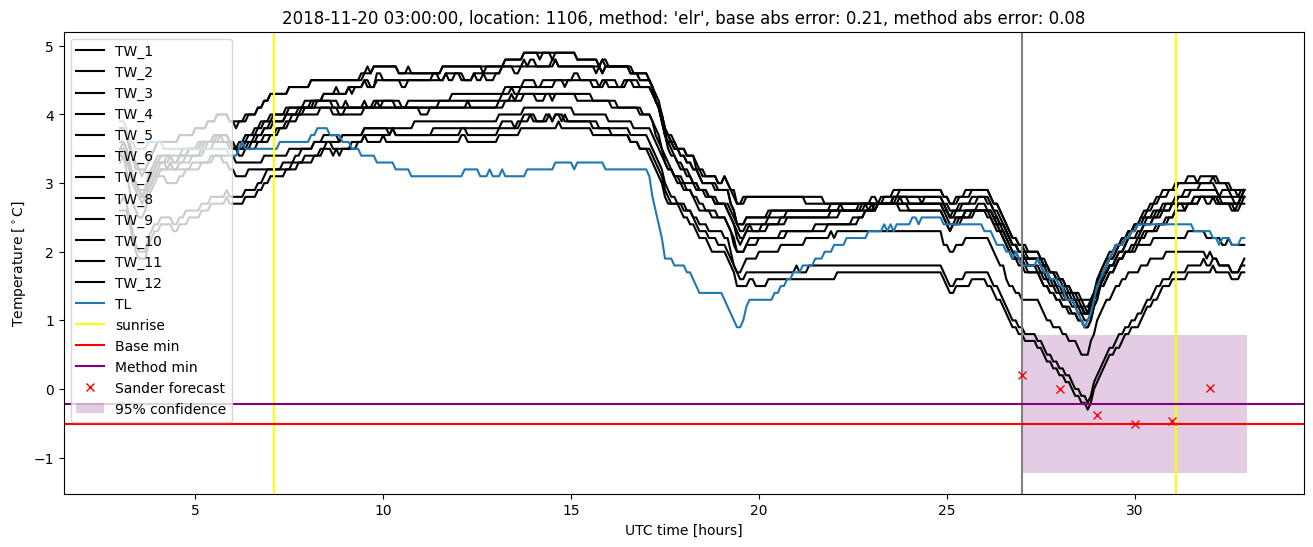
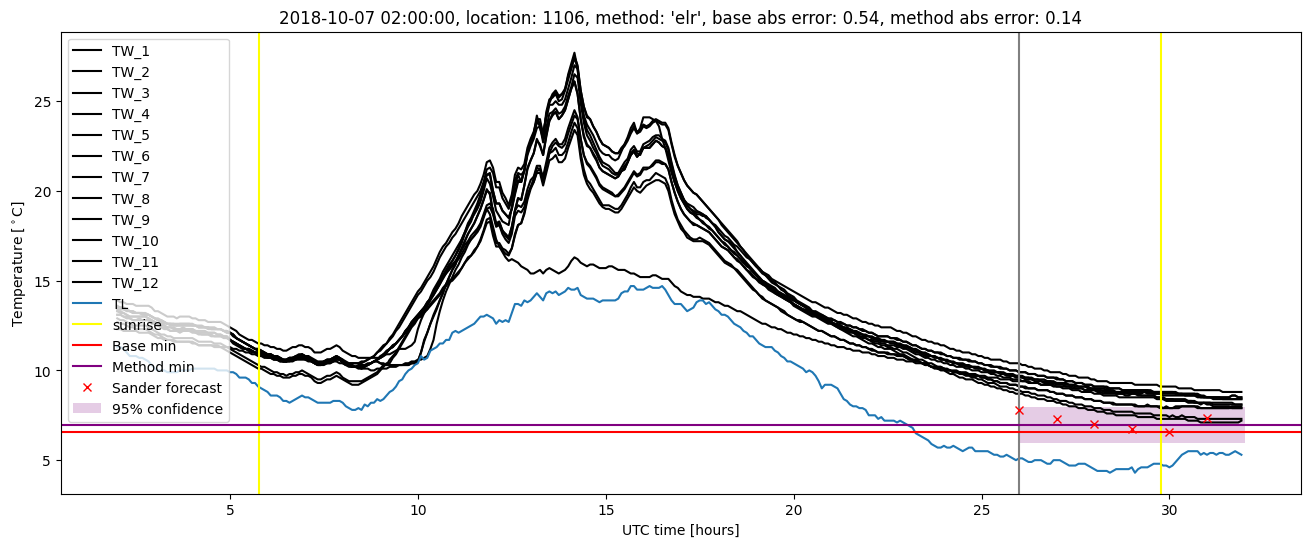
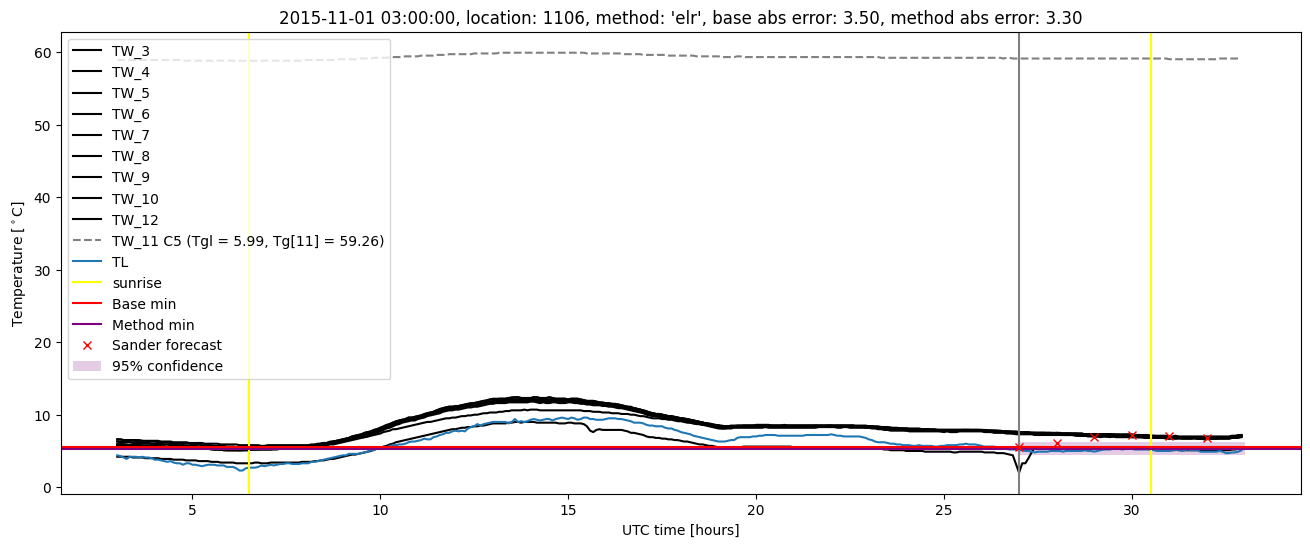
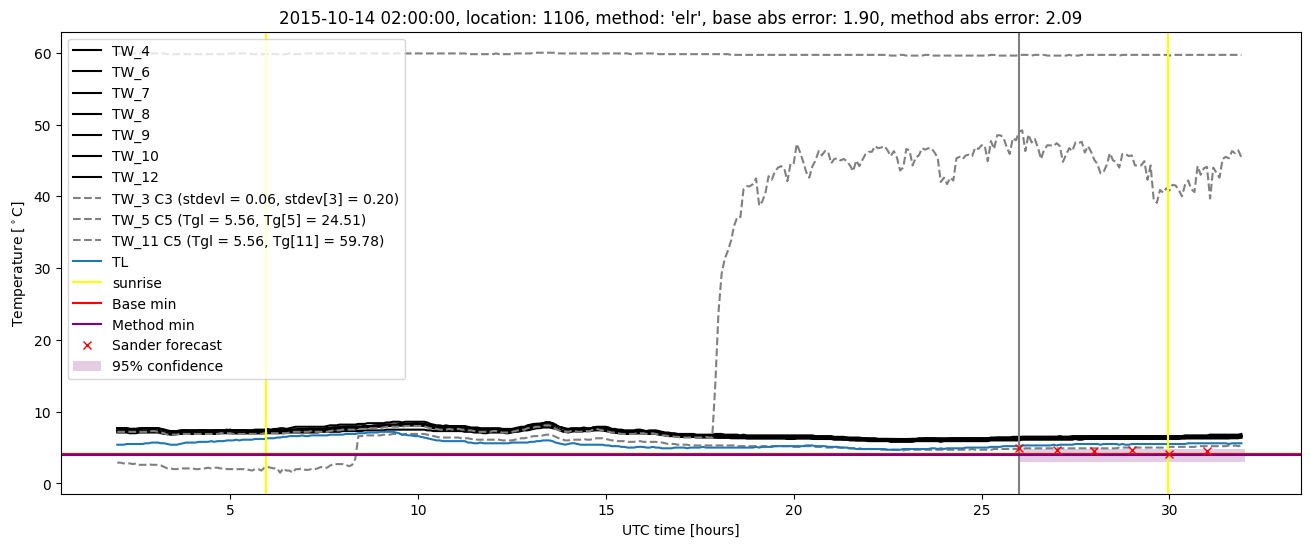
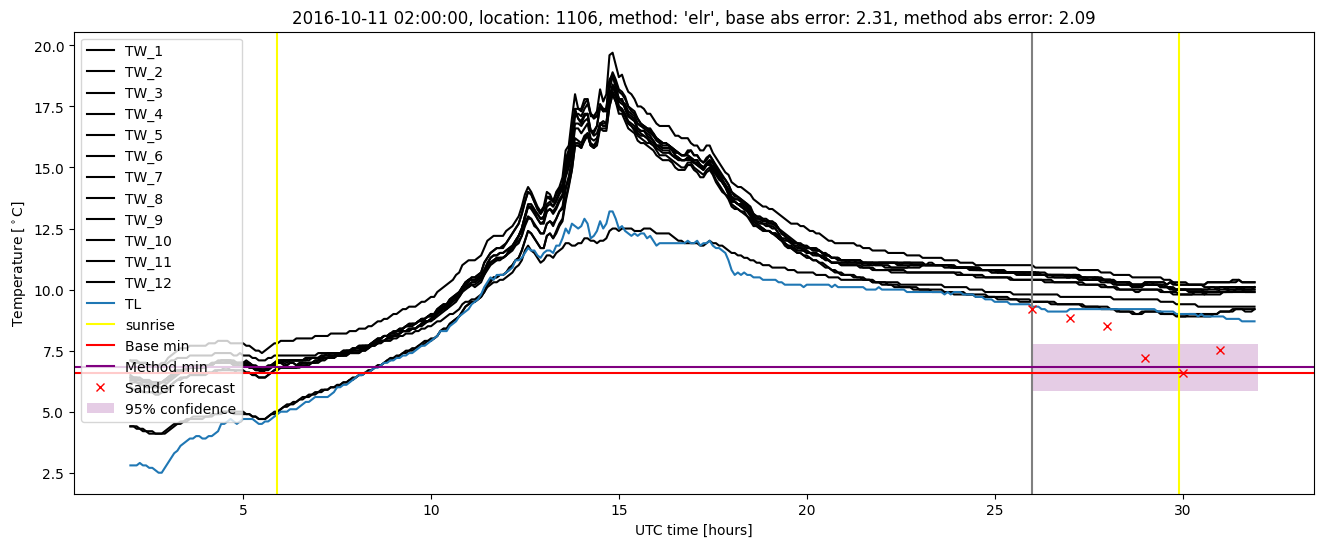
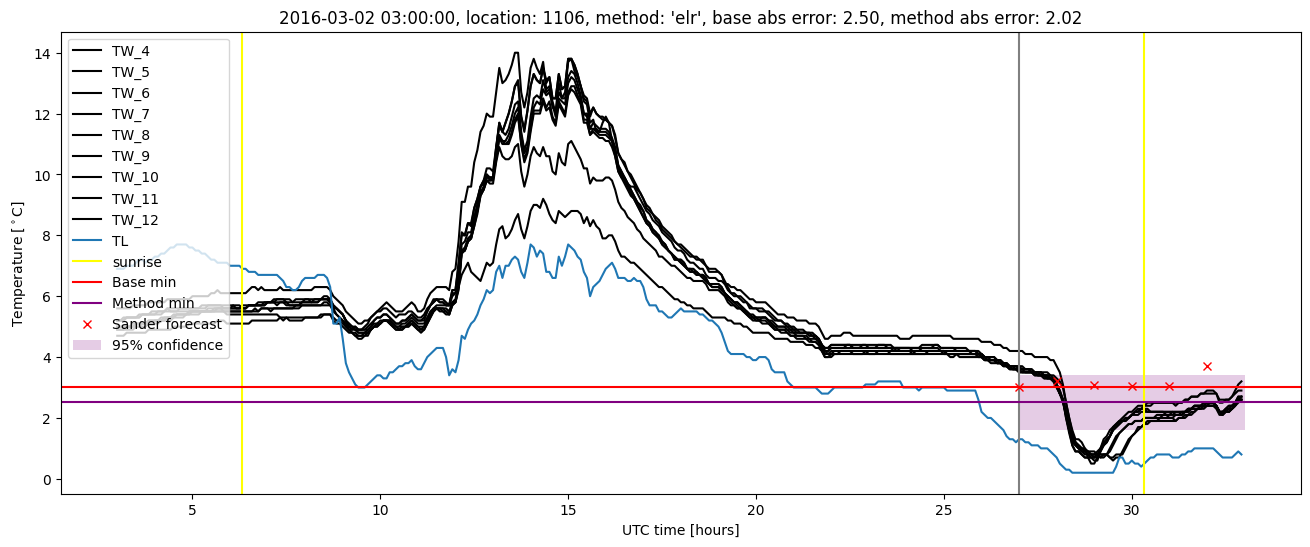
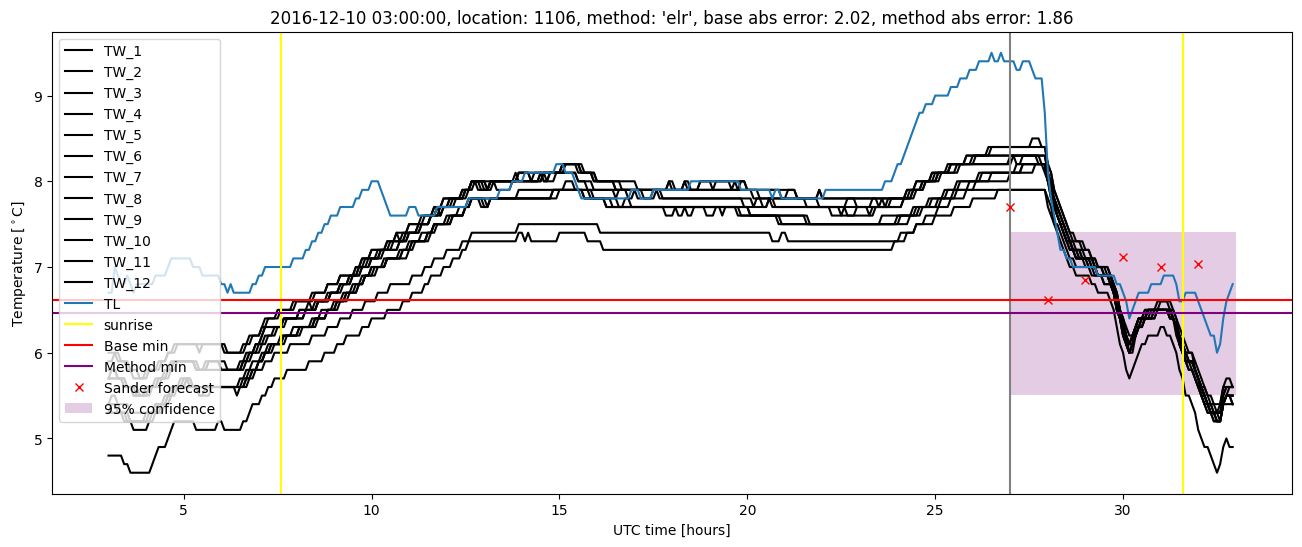
Extended logistic regression plots