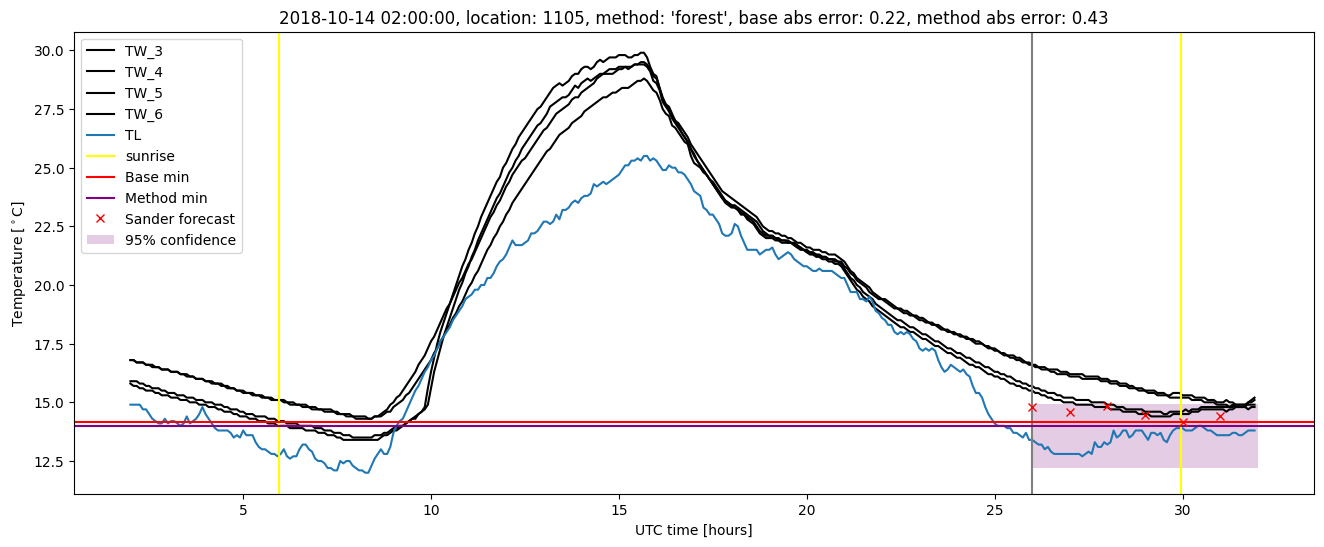
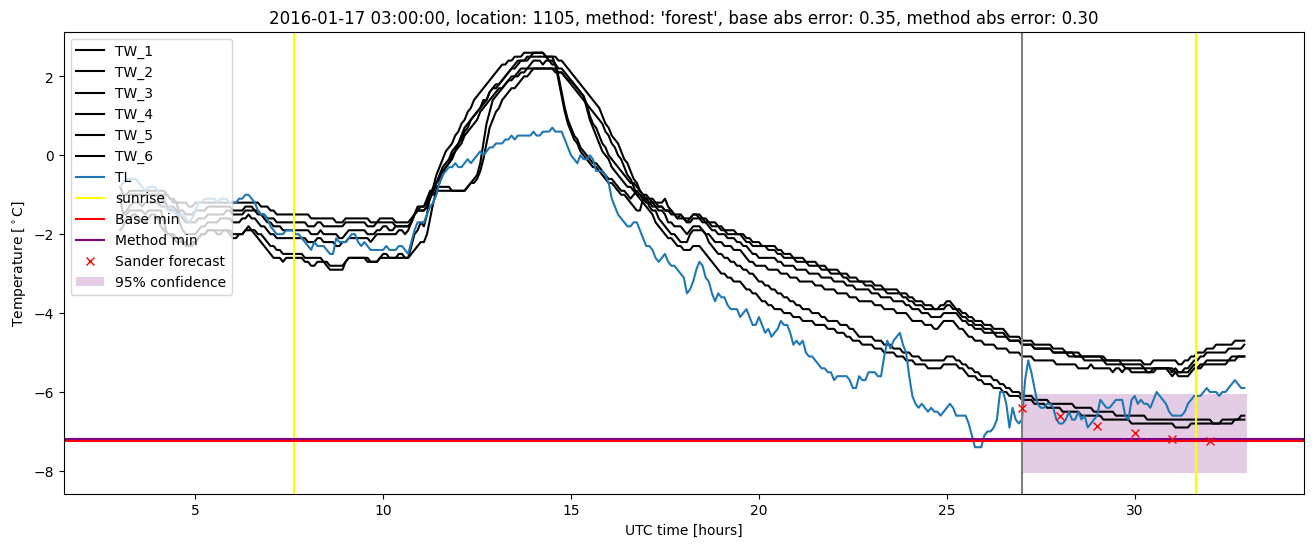
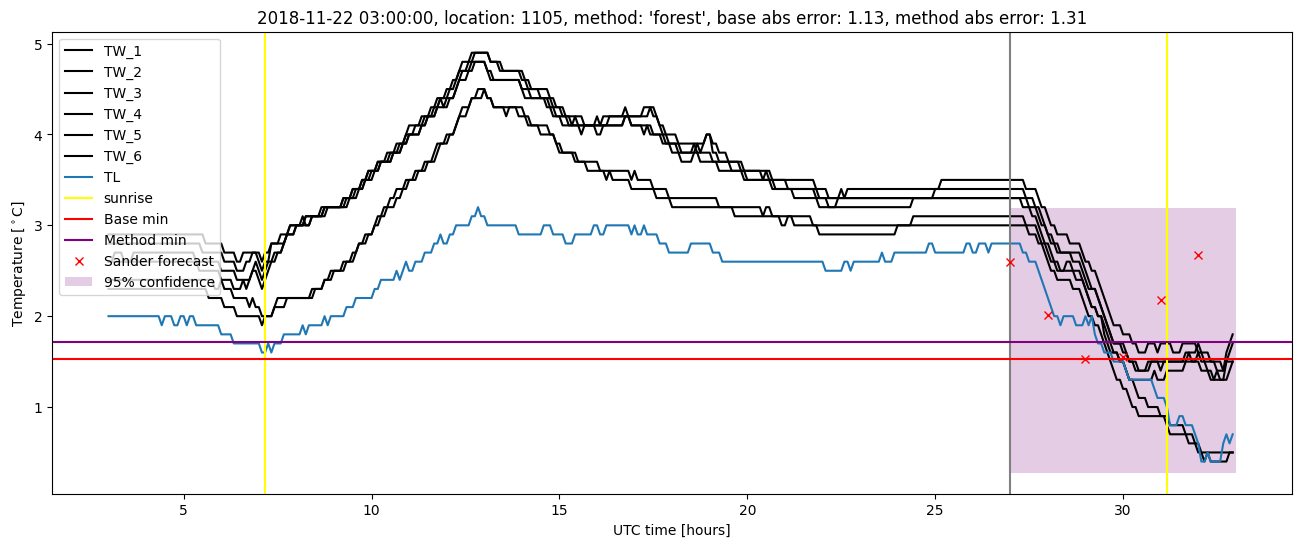
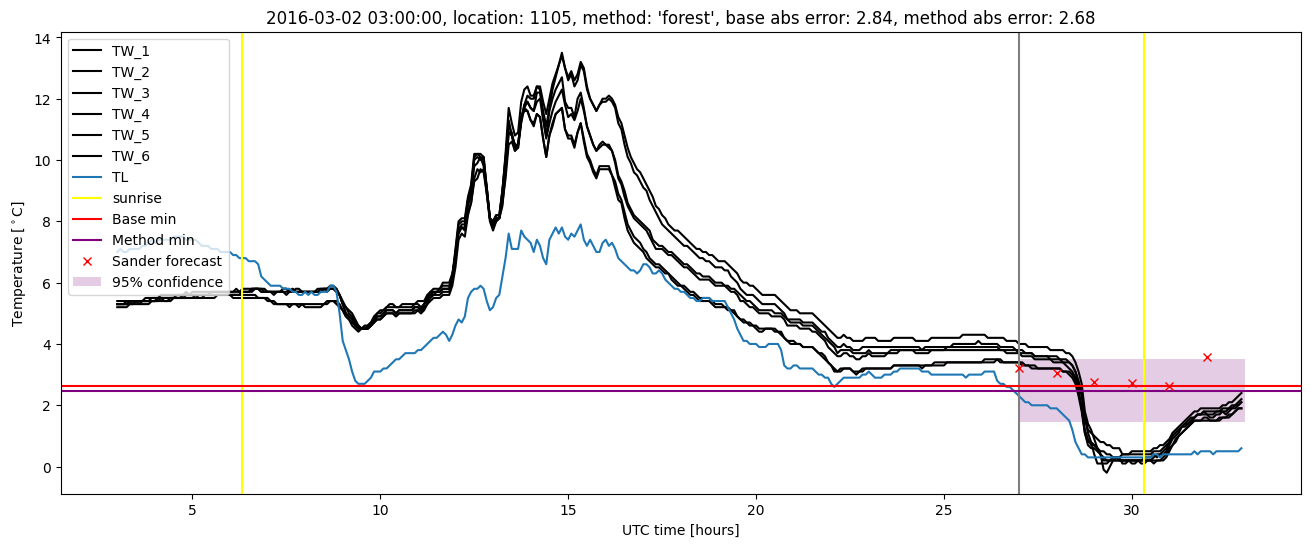
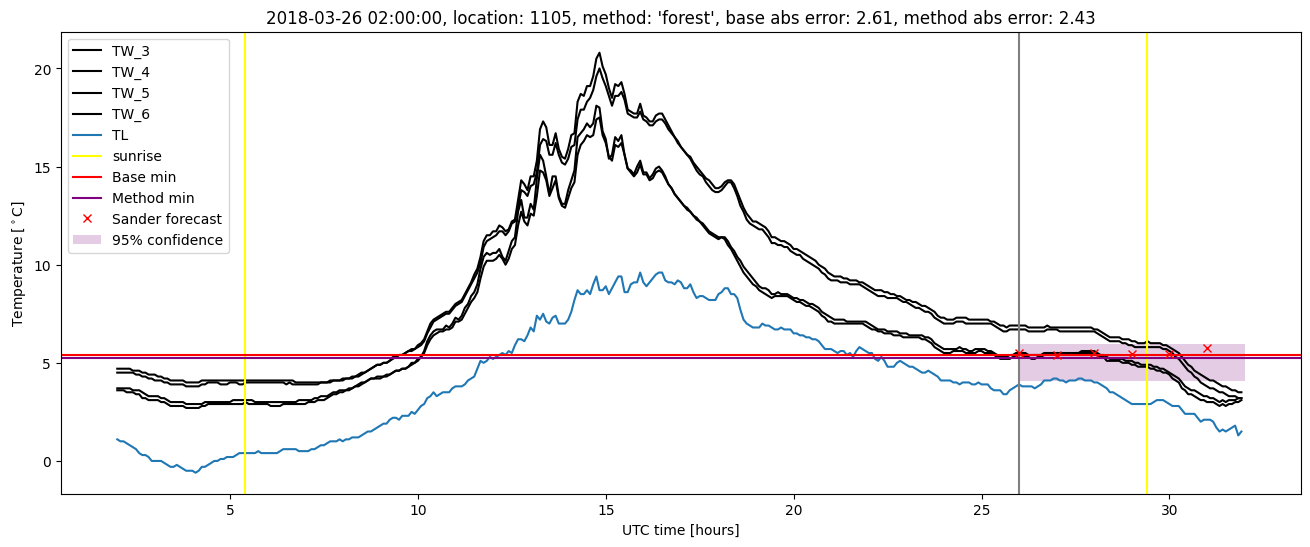
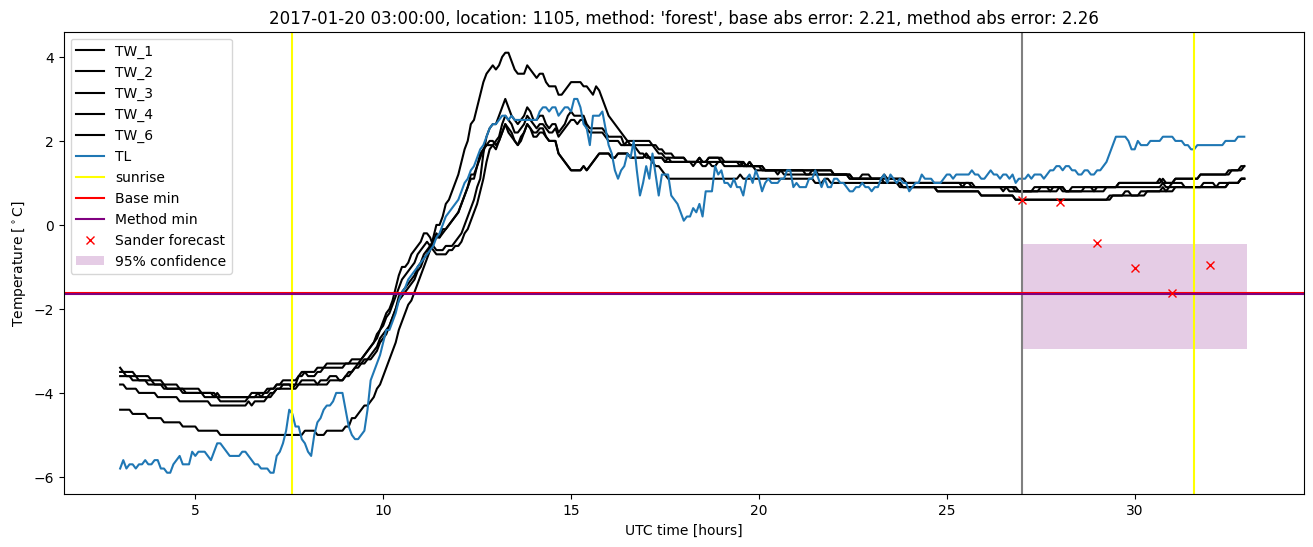
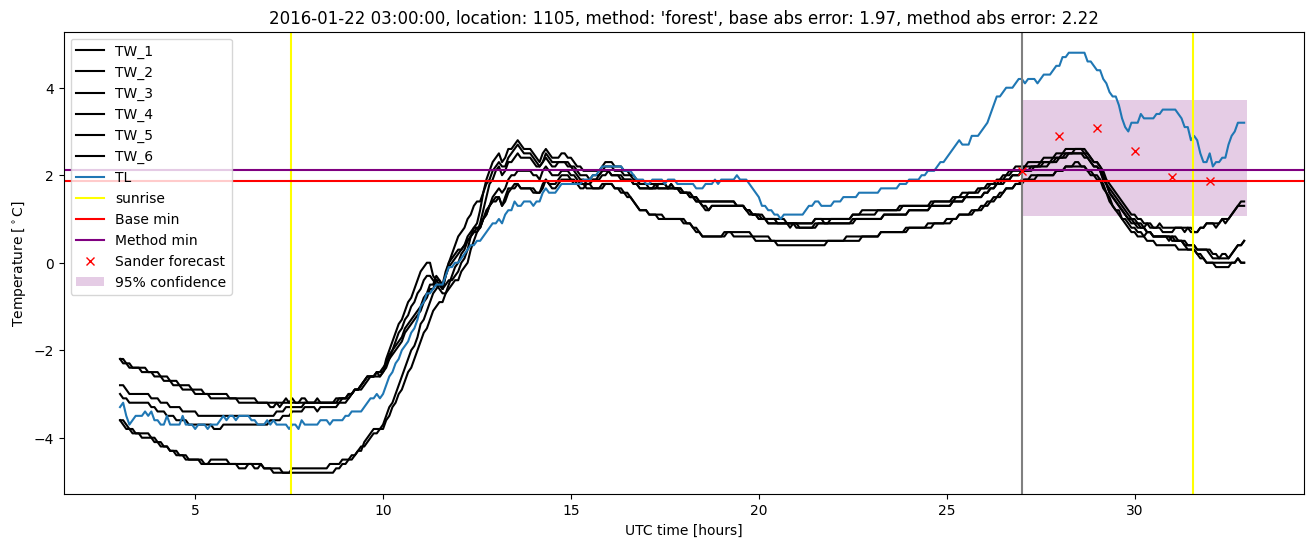
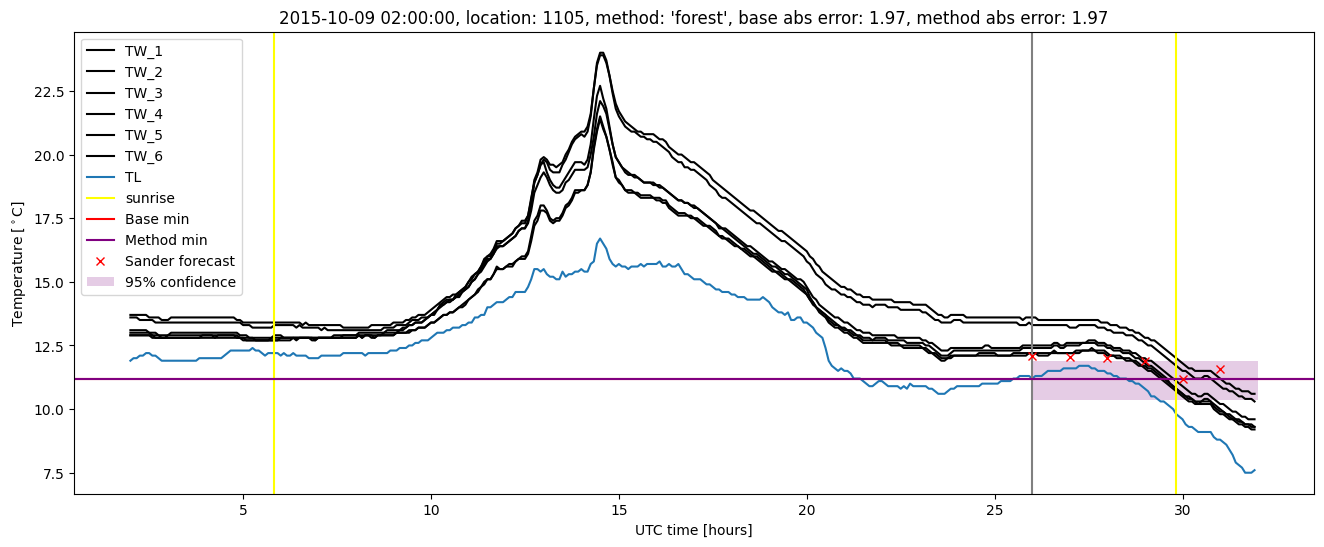
GMS location: 1105
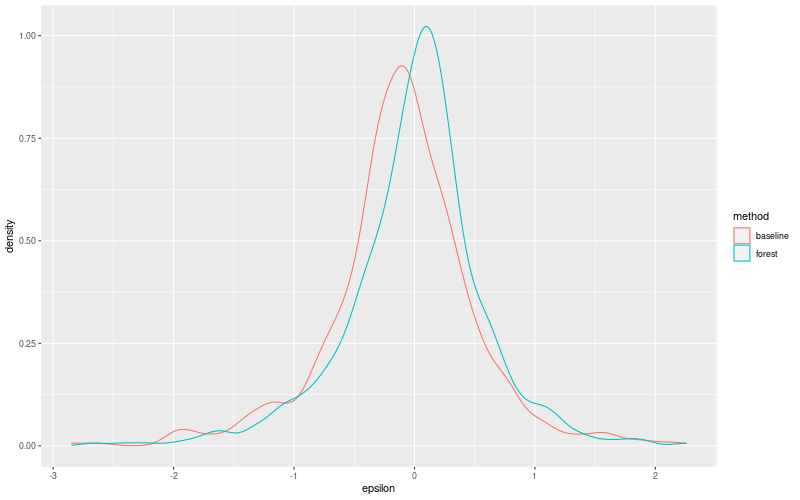
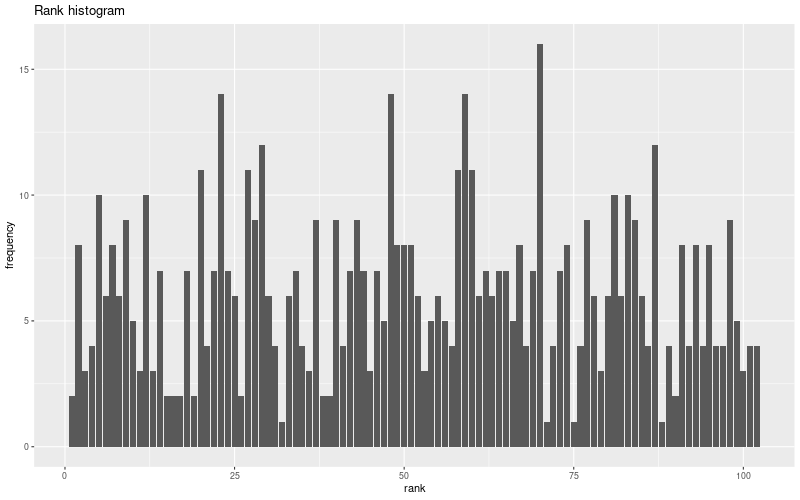
Random forest results
| names |
period |
power |
significance |
meanSquareError |
absError |
maxError |
CRPS |
IGN |
| baseline |
winter 2016 |
0.994 |
0.132 |
0.386 |
0.435 |
2.845 |
NaN |
NaN |
| forest |
winter 2016 |
0.988 |
0.132 |
0.346 |
0.411 |
2.676 |
0.517 |
2.803 |
| baseline |
winter 2017 |
0.980 |
0.053 |
0.460 |
0.473 |
2.215 |
NaN |
NaN |
| forest |
winter 2017 |
0.980 |
0.053 |
0.425 |
0.453 |
2.256 |
0.535 |
4.085 |
| baseline |
winter 2018 |
0.983 |
0.139 |
0.387 |
0.455 |
2.609 |
NaN |
NaN |
| forest |
winter 2018 |
0.992 |
0.083 |
0.350 |
0.444 |
2.429 |
0.535 |
2.892 |
| baseline |
winter 2019 |
0.992 |
0.091 |
0.271 |
0.386 |
1.617 |
NaN |
NaN |
| forest |
winter 2019 |
0.992 |
0.000e+00 |
0.197 |
0.332 |
1.313 |
0.521 |
2.530 |
| baseline |
all |
0.988 |
0.106 |
0.378 |
0.438 |
2.845 |
NaN |
NaN |
| forest |
all |
0.988 |
0.081 |
0.333 |
0.411 |
2.676 |
0.526 |
3.049 |
Random forest plots
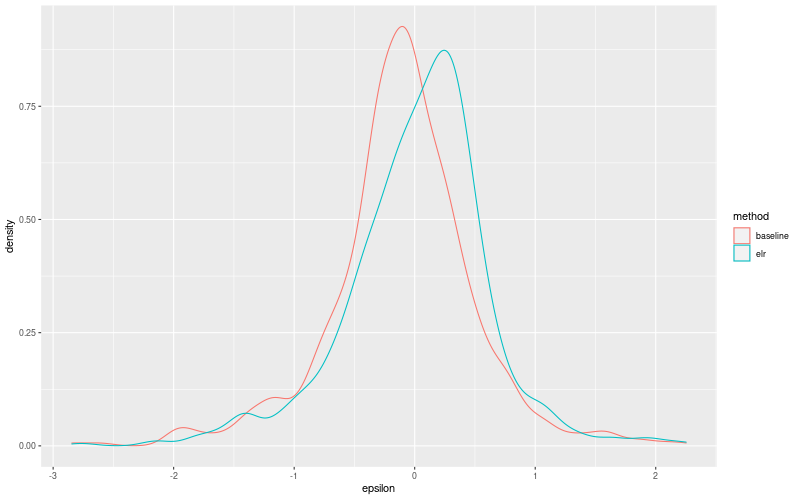
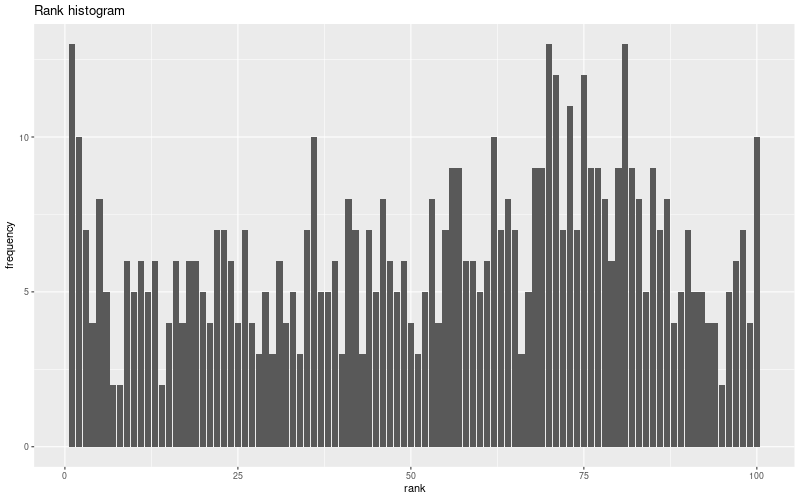
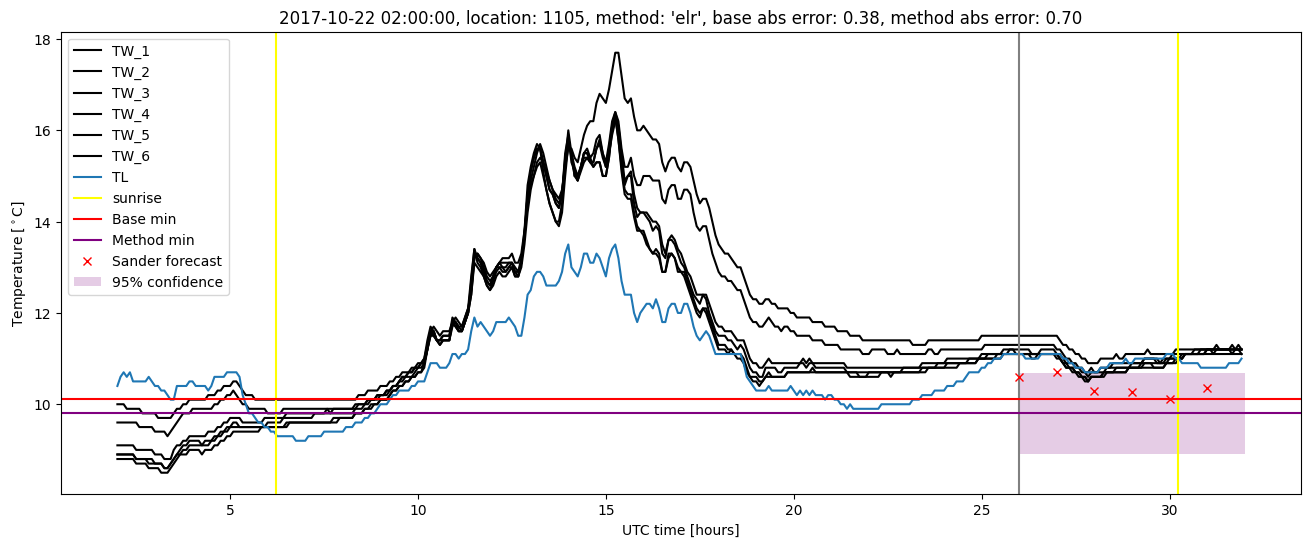
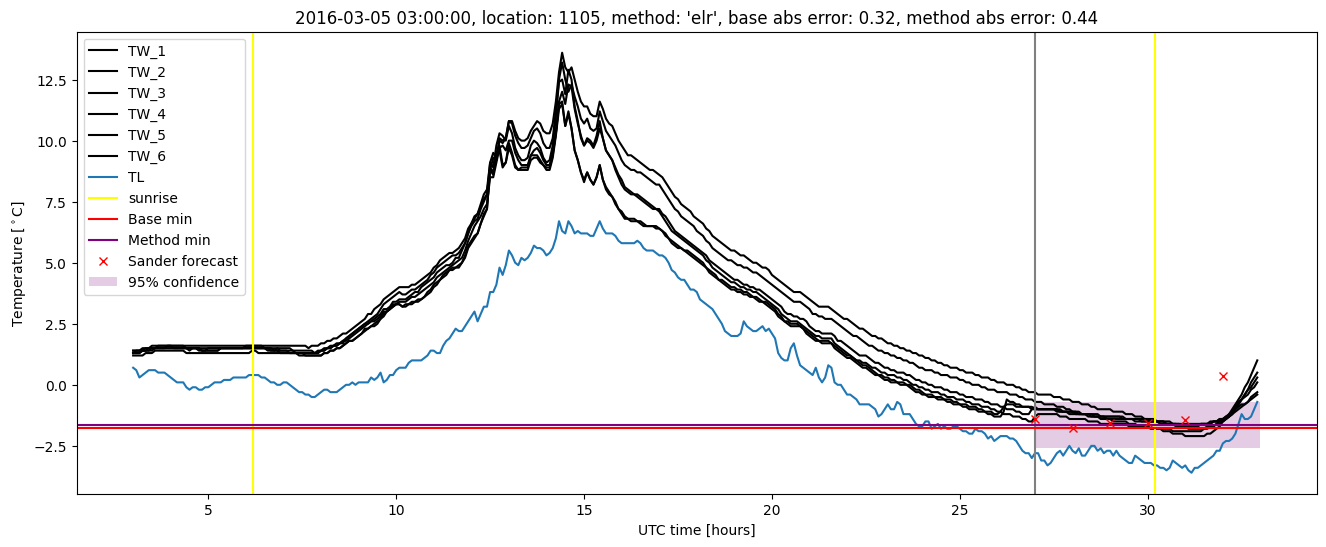
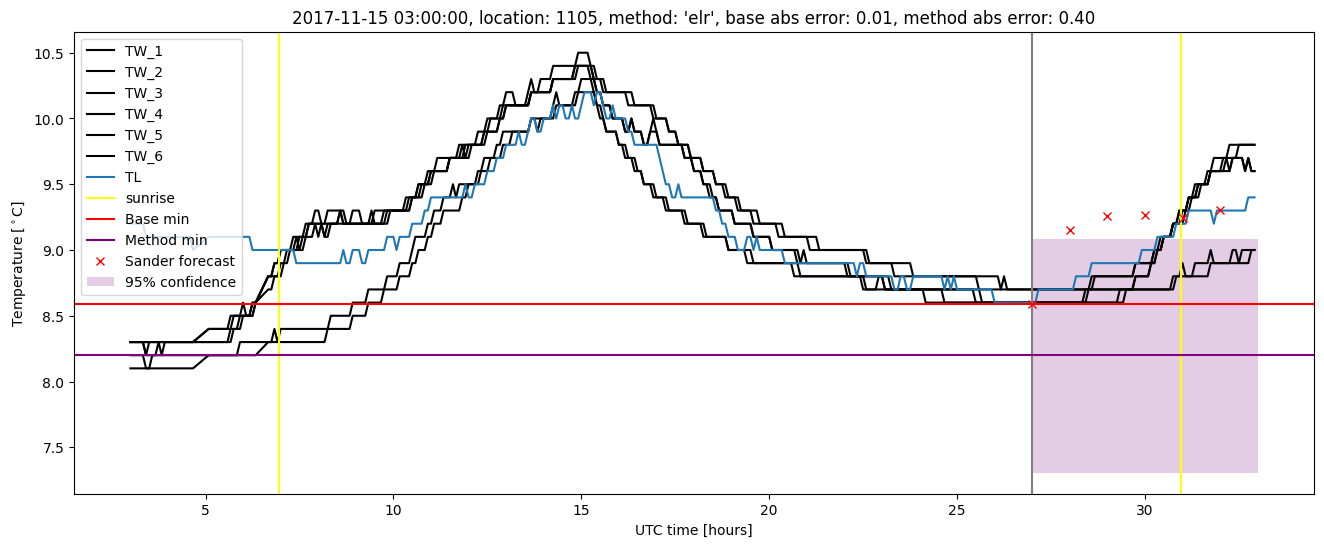
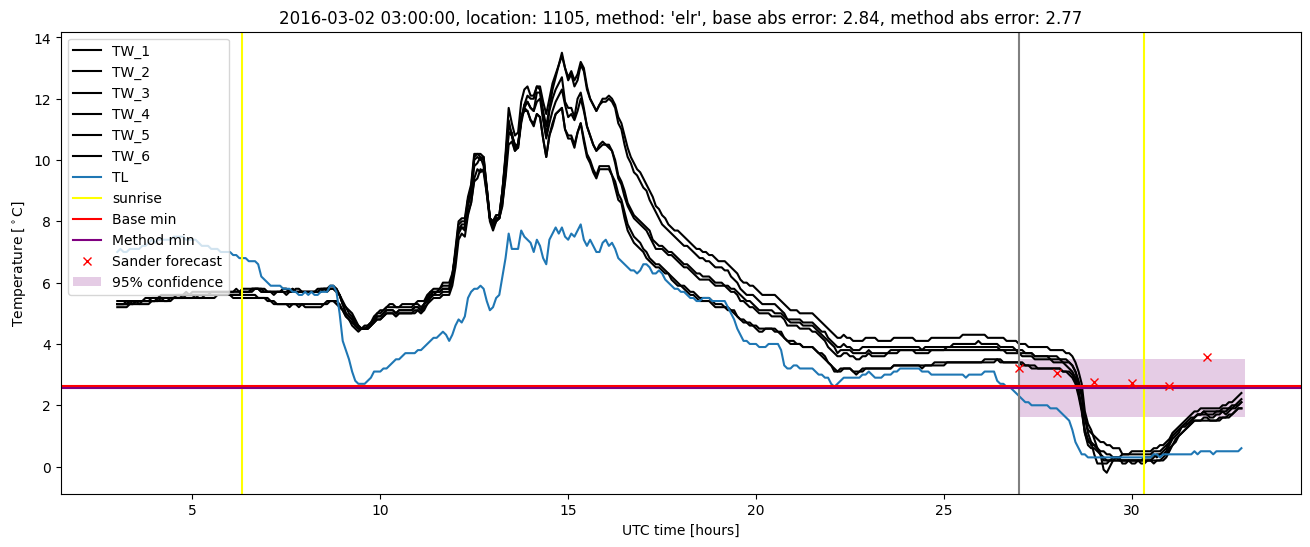
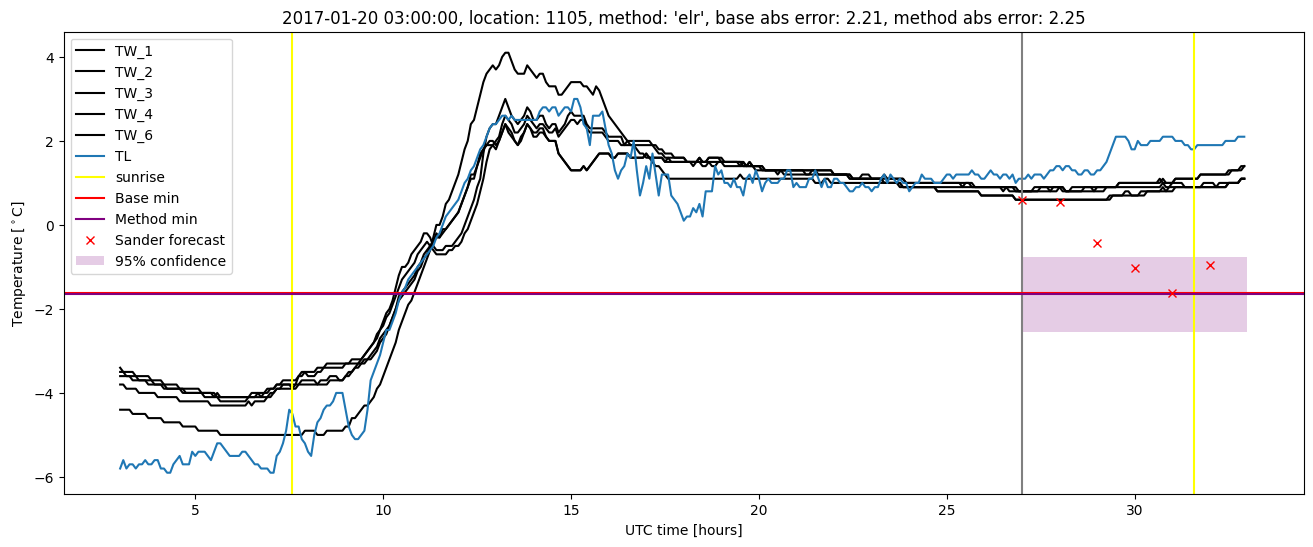
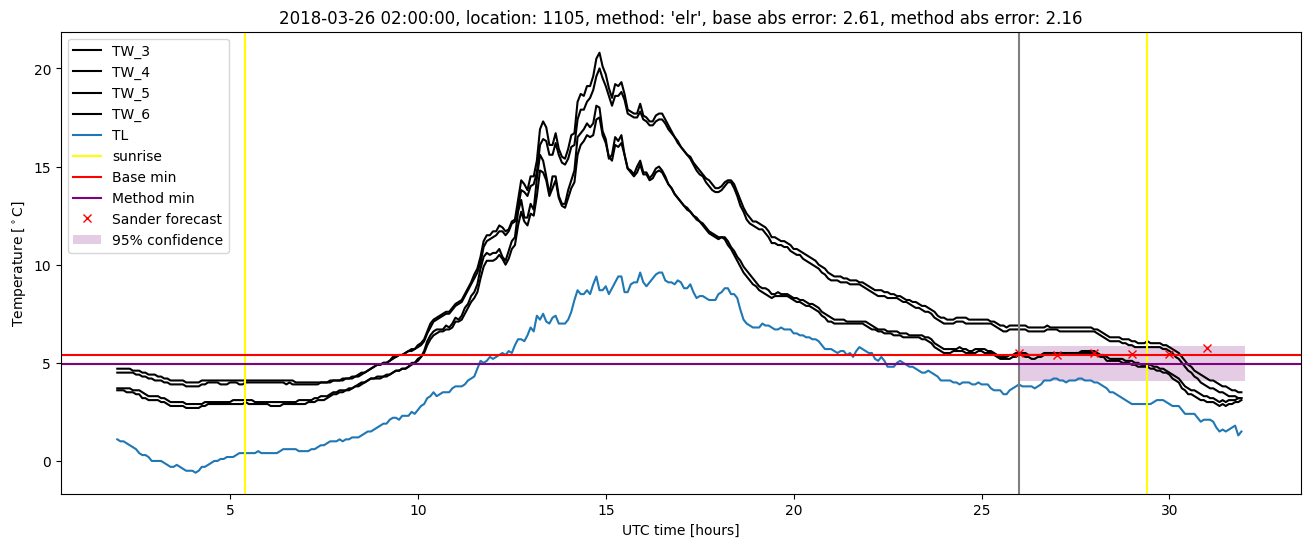
Extended logistic regression results
| names |
period |
power |
significance |
meanSquareError |
absError |
maxError |
CRPS |
IGN |
| baseline |
winter 2016 |
0.994 |
0.132 |
0.386 |
0.435 |
2.845 |
NaN |
NaN |
| elr |
winter 2016 |
0.994 |
0.132 |
0.362 |
0.432 |
2.767 |
0.574 |
3.896 |
| baseline |
winter 2017 |
0.980 |
0.053 |
0.460 |
0.473 |
2.215 |
NaN |
NaN |
| elr |
winter 2017 |
0.980 |
0.026 |
0.424 |
0.463 |
2.252 |
0.590 |
4.846 |
| baseline |
winter 2018 |
0.983 |
0.139 |
0.387 |
0.455 |
2.609 |
NaN |
NaN |
| elr |
winter 2018 |
0.966 |
0.056 |
0.382 |
0.483 |
2.157 |
0.621 |
5.249 |
| baseline |
winter 2019 |
0.992 |
0.091 |
0.271 |
0.386 |
1.617 |
NaN |
NaN |
| elr |
winter 2019 |
1.000 |
0.091 |
0.247 |
0.380 |
1.502 |
0.565 |
3.580 |
| baseline |
all |
0.988 |
0.106 |
0.378 |
0.438 |
2.845 |
NaN |
NaN |
| elr |
all |
0.986 |
0.073 |
0.356 |
0.440 |
2.767 |
0.587 |
4.367 |
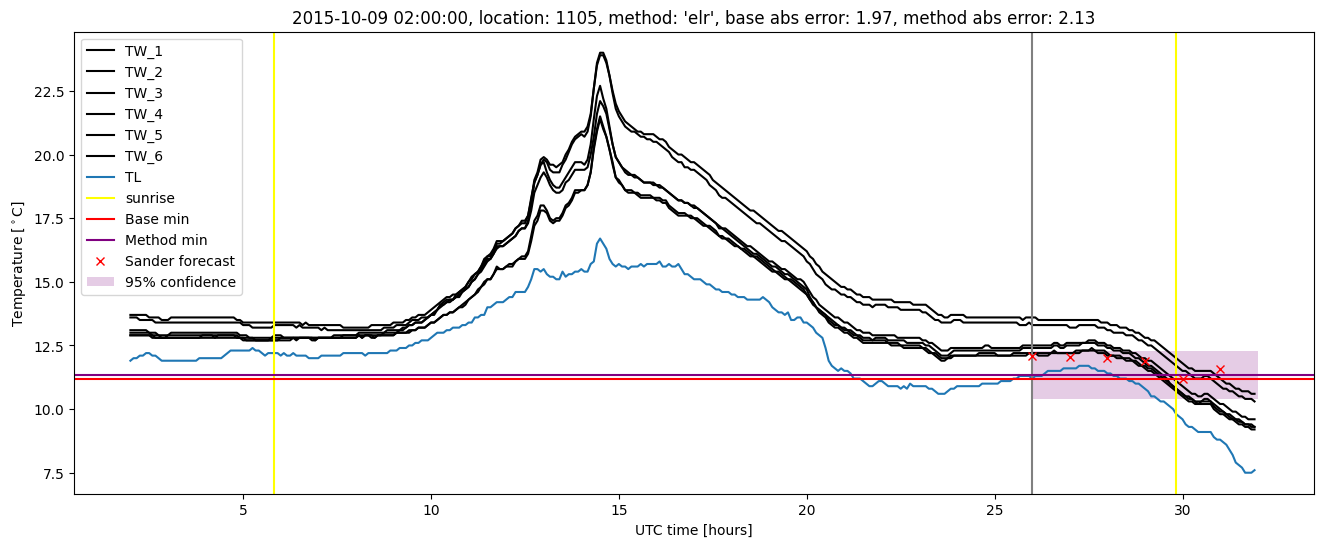
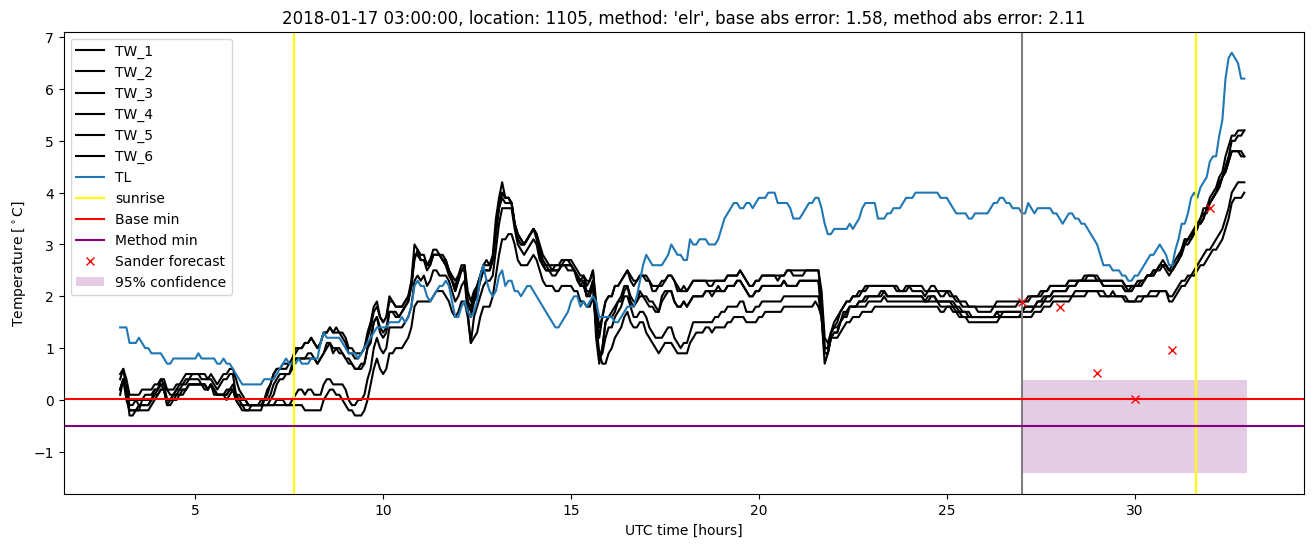
Extended logistic regression plots