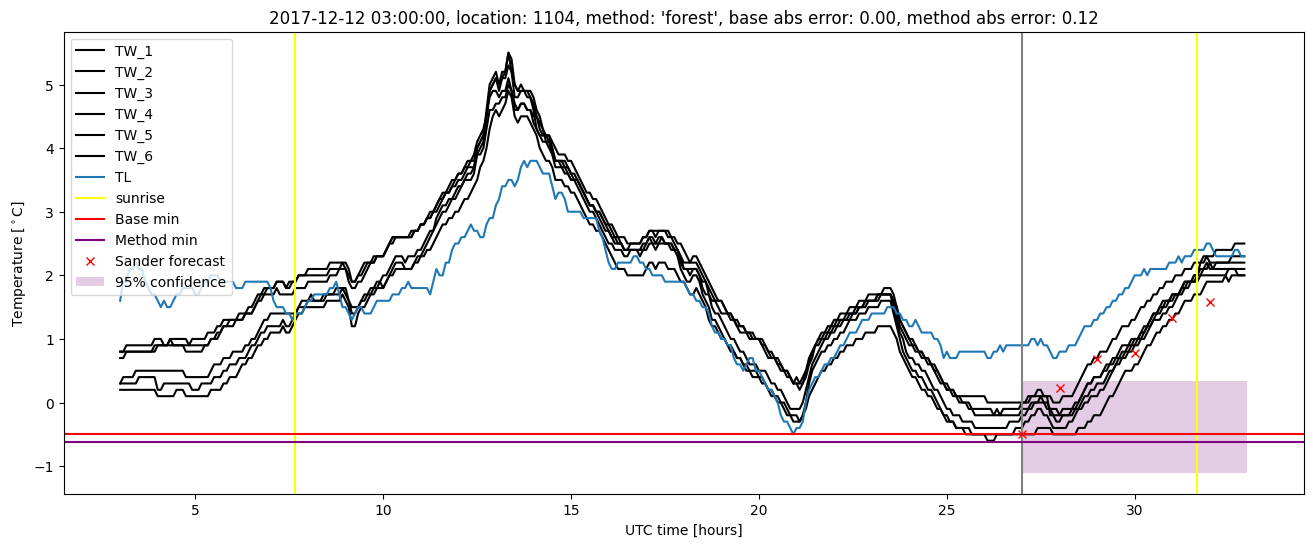
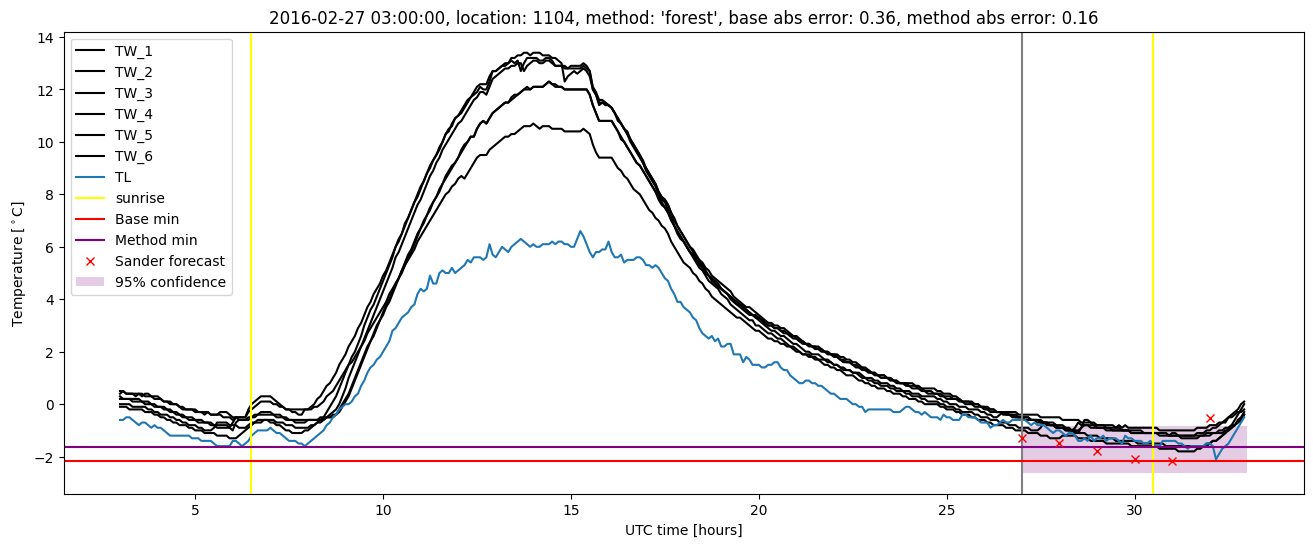
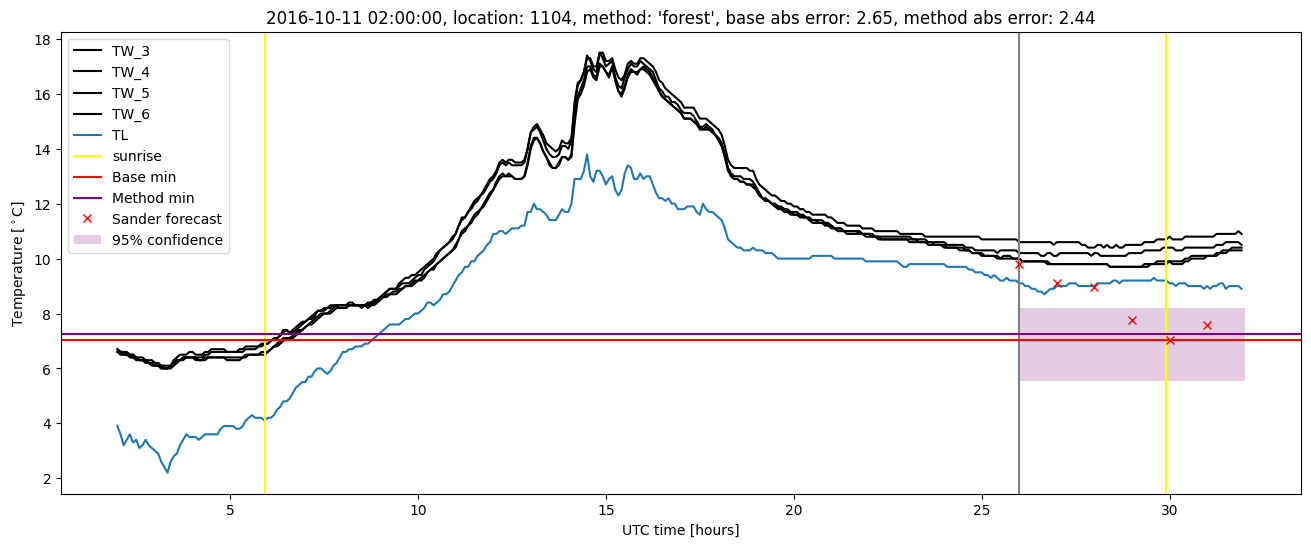
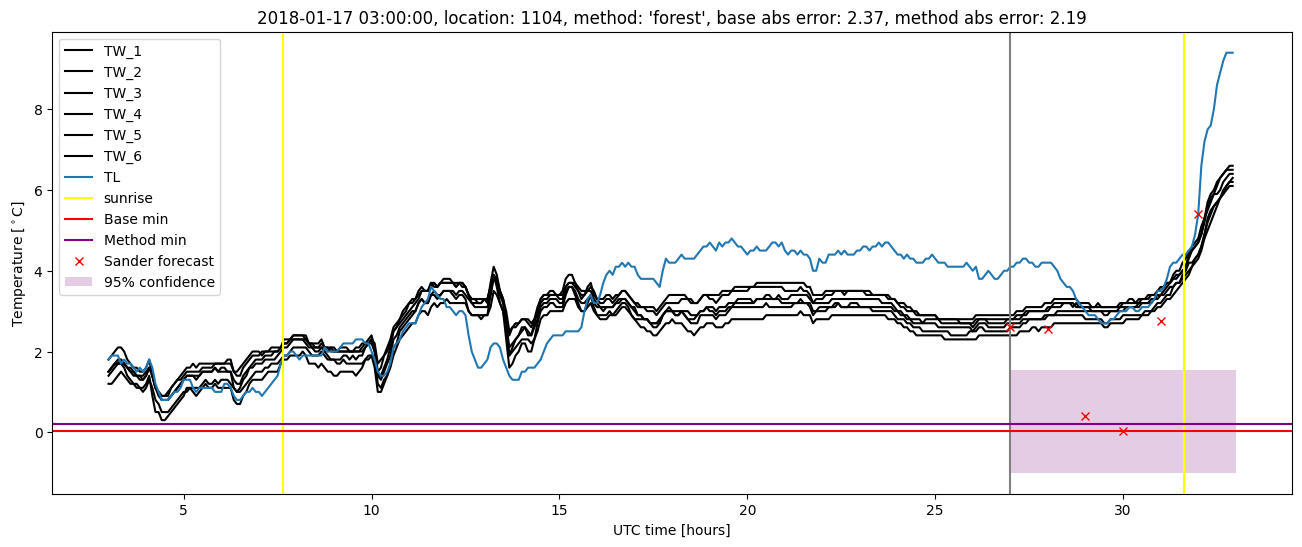
GMS location: 1104
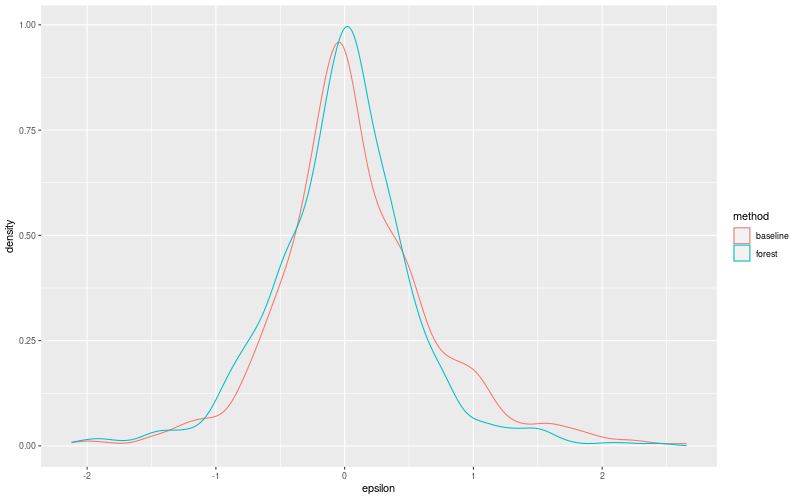
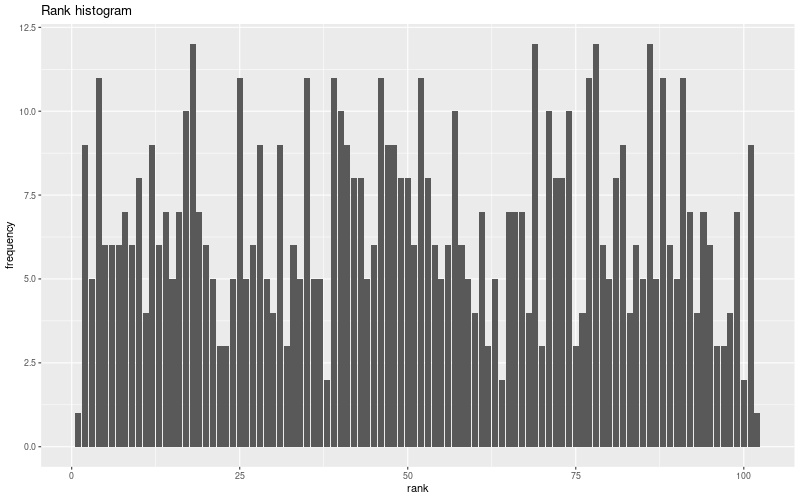
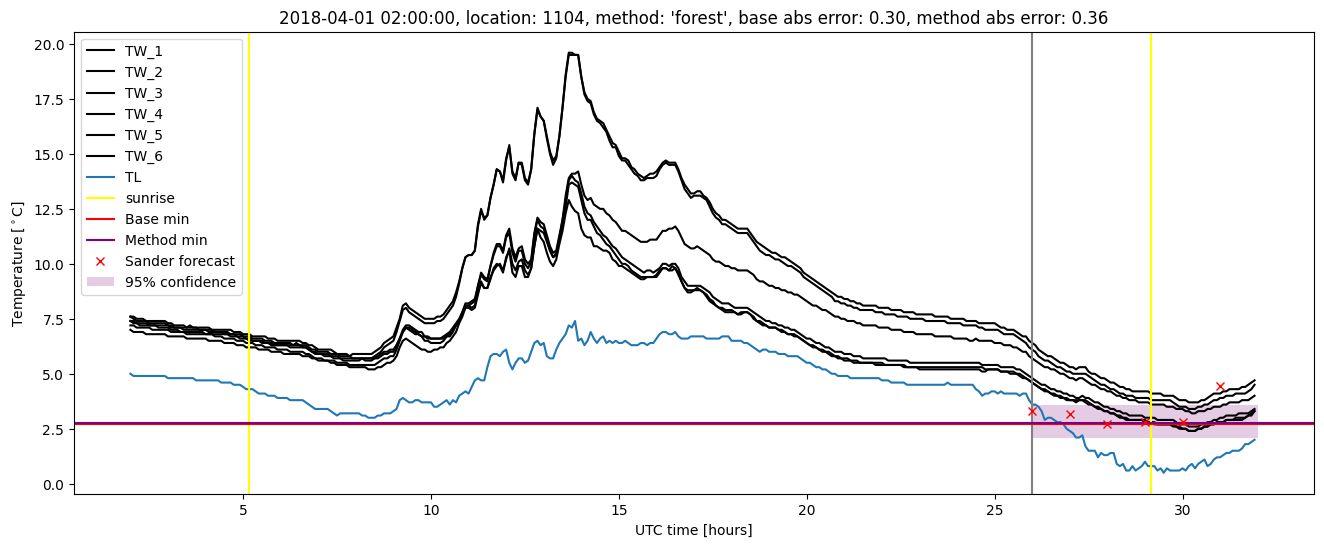
Random forest results
| names |
period |
power |
significance |
meanSquareError |
absError |
maxError |
CRPS |
IGN |
| baseline |
winter 2016 |
0.988 |
0.151 |
0.334 |
0.427 |
2.018 |
NaN |
NaN |
| forest |
winter 2016 |
0.988 |
0.151 |
0.280 |
0.375 |
1.966 |
0.436 |
3.116 |
| baseline |
winter 2017 |
0.966 |
0.083 |
0.548 |
0.518 |
2.652 |
NaN |
NaN |
| forest |
winter 2017 |
0.974 |
0.028 |
0.368 |
0.433 |
2.440 |
0.456 |
4.087 |
| baseline |
winter 2018 |
0.979 |
0.062 |
0.357 |
0.435 |
2.368 |
NaN |
NaN |
| forest |
winter 2018 |
0.986 |
0.062 |
0.307 |
0.404 |
2.188 |
0.449 |
3.868 |
| baseline |
winter 2019 |
0.993 |
0.000e+00 |
0.272 |
0.372 |
1.812 |
NaN |
NaN |
| forest |
winter 2019 |
0.993 |
0.000e+00 |
0.232 |
0.365 |
1.432 |
0.427 |
3.078 |
| baseline |
all |
0.982 |
0.090 |
0.375 |
0.438 |
2.652 |
NaN |
NaN |
| forest |
all |
0.986 |
0.072 |
0.297 |
0.393 |
2.440 |
0.442 |
3.522 |
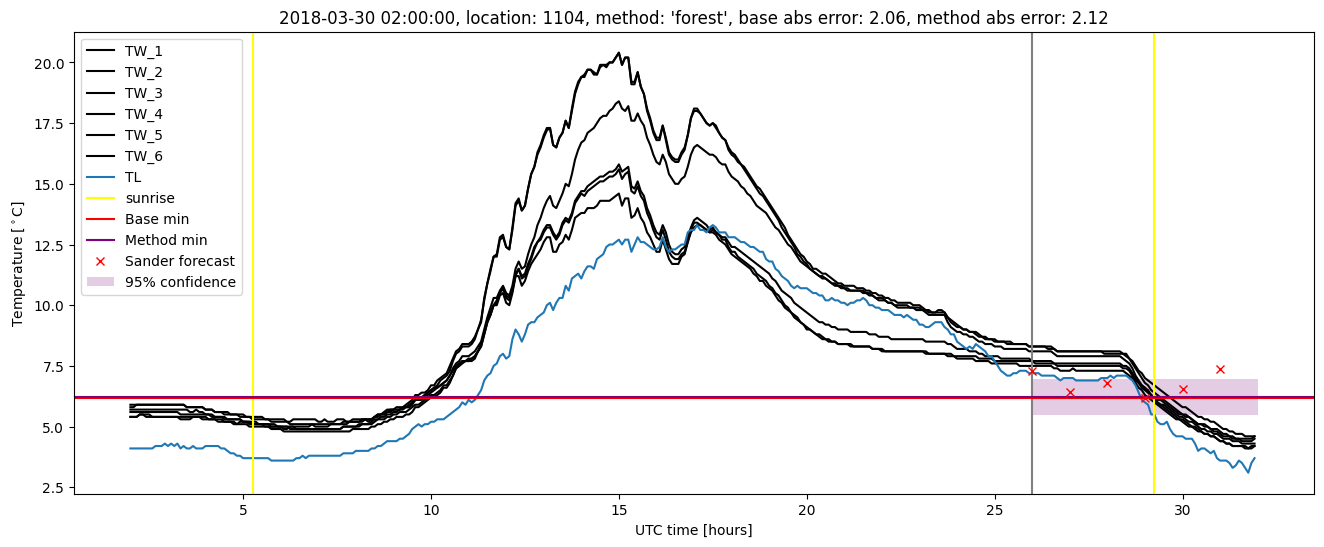
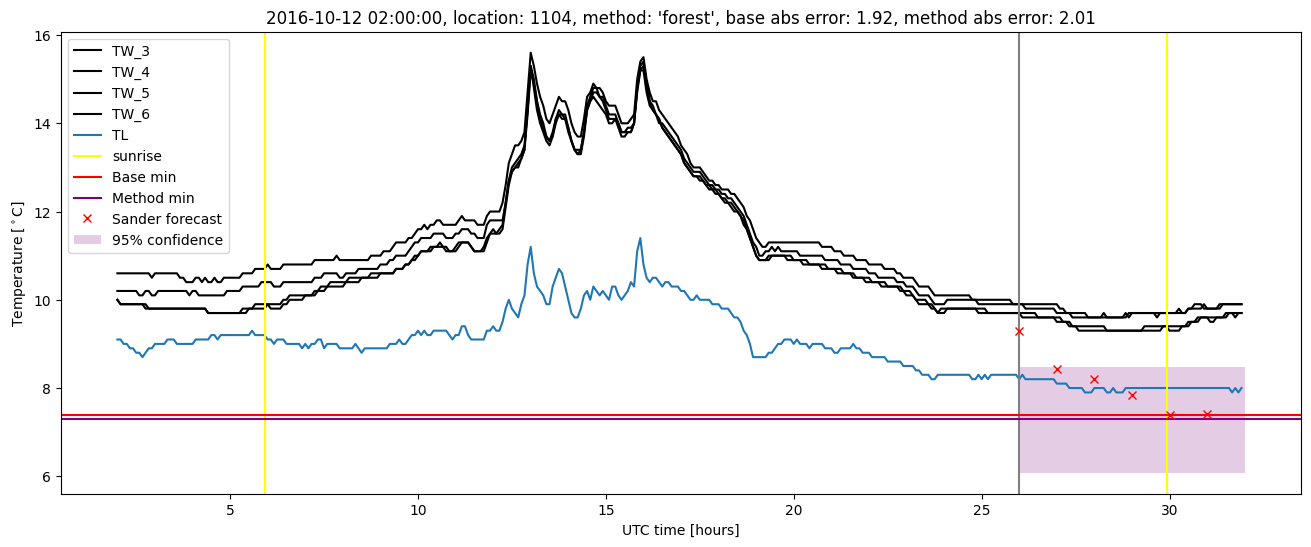
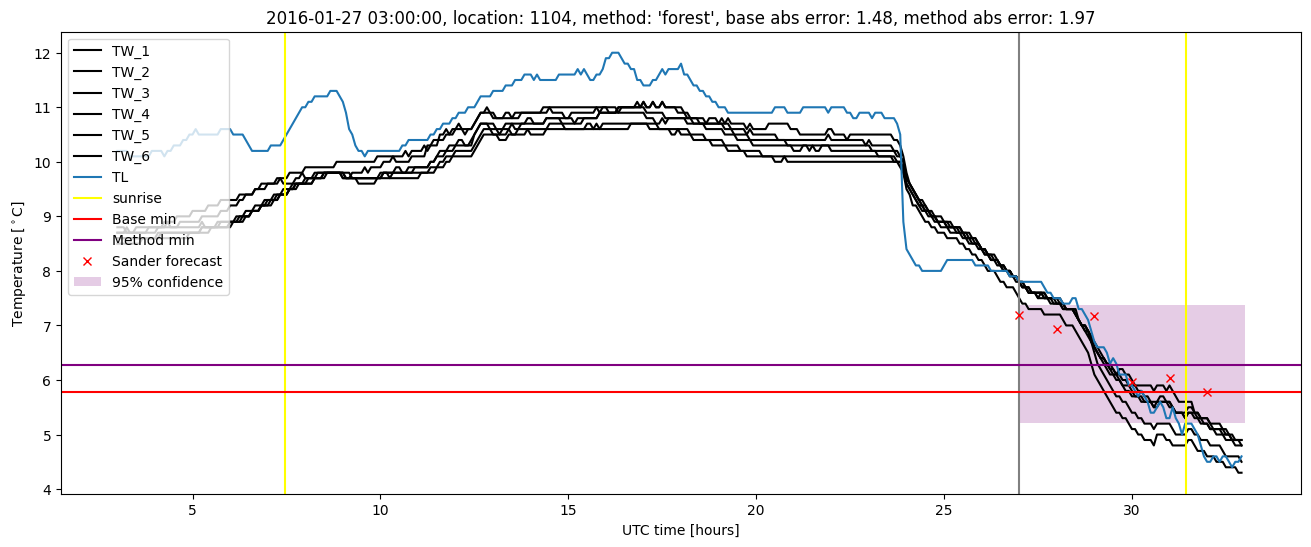
Random forest plots
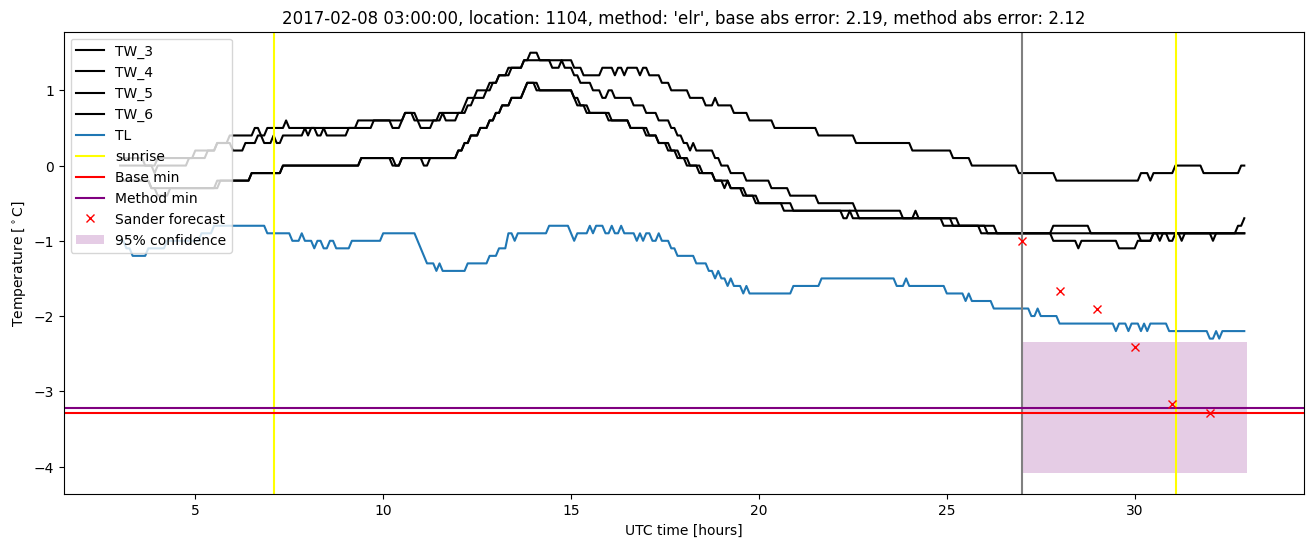
Extended logistic regression results
| names |
period |
power |
significance |
meanSquareError |
absError |
maxError |
CRPS |
IGN |
| baseline |
winter 2016 |
0.988 |
0.151 |
0.334 |
0.427 |
2.018 |
NaN |
NaN |
| elr |
winter 2016 |
0.994 |
0.061 |
0.317 |
0.417 |
2.087 |
0.509 |
3.324 |
| baseline |
winter 2017 |
0.966 |
0.083 |
0.548 |
0.518 |
2.652 |
NaN |
NaN |
| elr |
winter 2017 |
0.966 |
0.056 |
0.440 |
0.480 |
2.439 |
0.482 |
3.725 |
| baseline |
winter 2018 |
0.979 |
0.062 |
0.357 |
0.435 |
2.368 |
NaN |
NaN |
| elr |
winter 2018 |
0.979 |
0.062 |
0.346 |
0.431 |
2.526 |
0.498 |
3.204 |
| baseline |
winter 2019 |
0.993 |
0.000e+00 |
0.272 |
0.372 |
1.812 |
NaN |
NaN |
| elr |
winter 2019 |
0.993 |
0.000e+00 |
0.281 |
0.413 |
1.501 |
0.502 |
3.217 |
| baseline |
all |
0.982 |
0.090 |
0.375 |
0.438 |
2.652 |
NaN |
NaN |
| elr |
all |
0.984 |
0.054 |
0.345 |
0.434 |
2.526 |
0.498 |
3.360 |
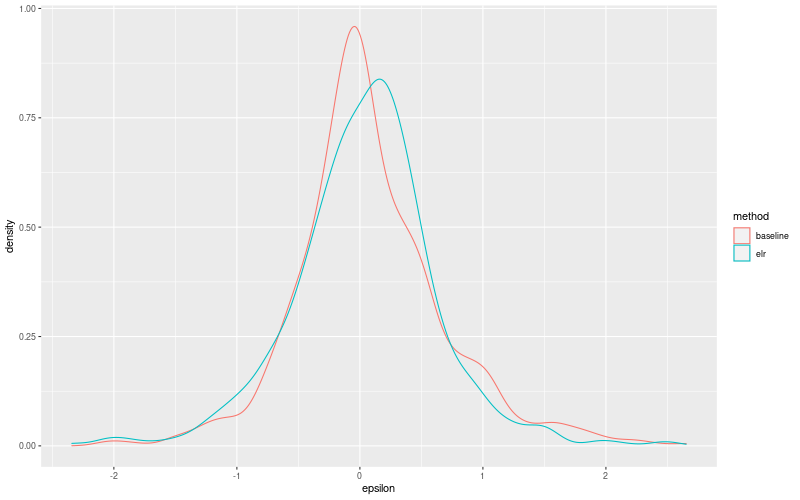
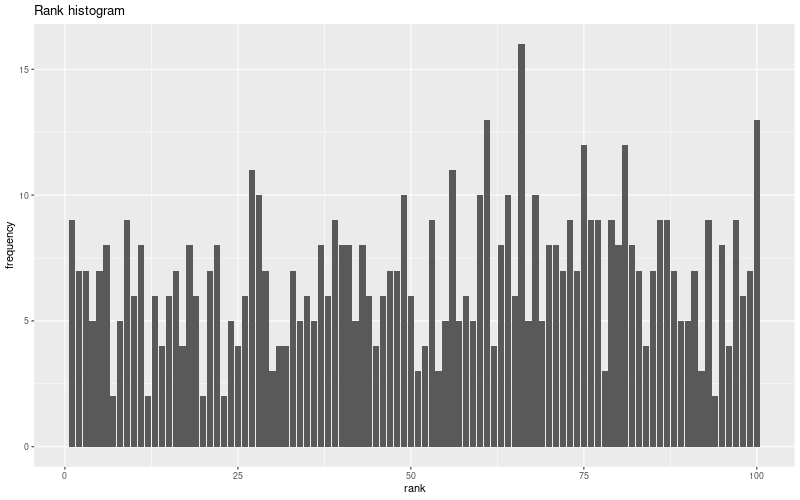
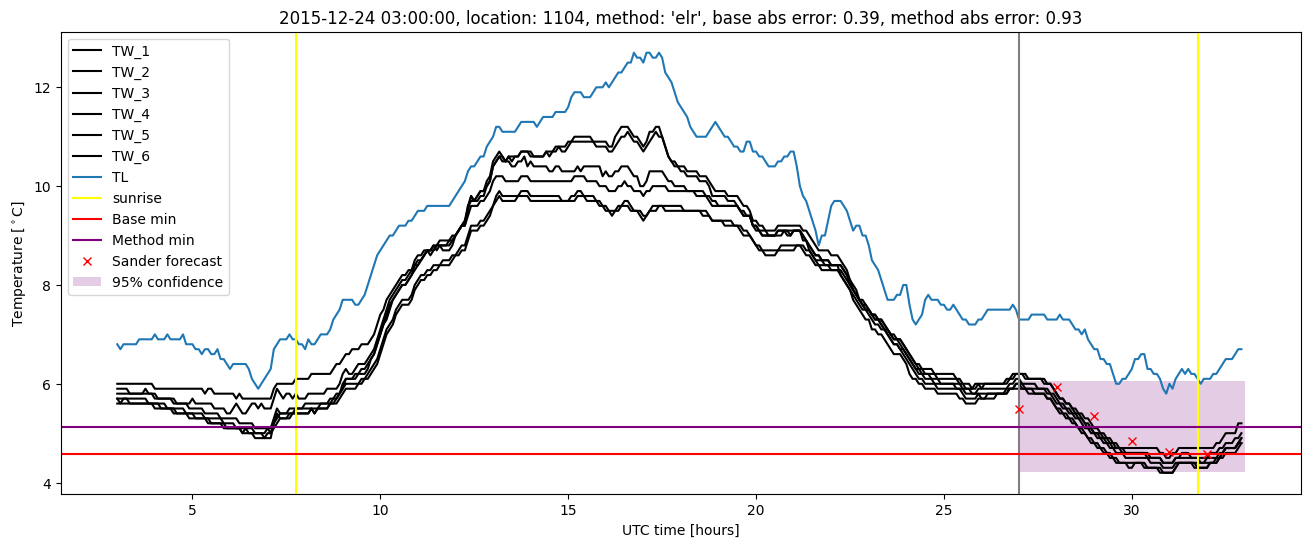
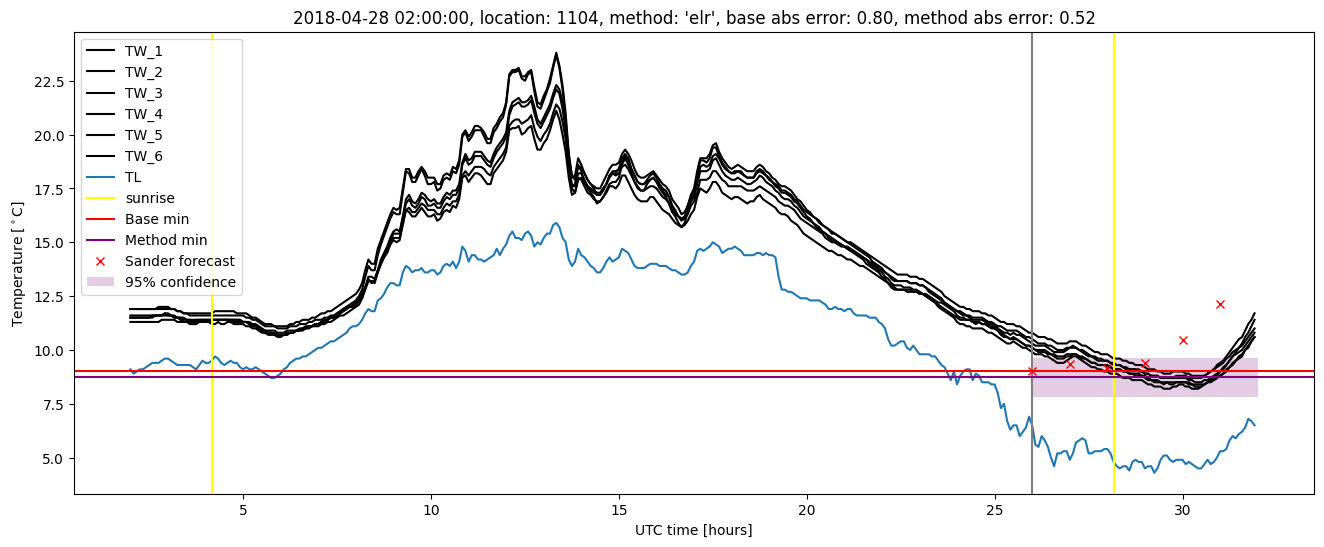
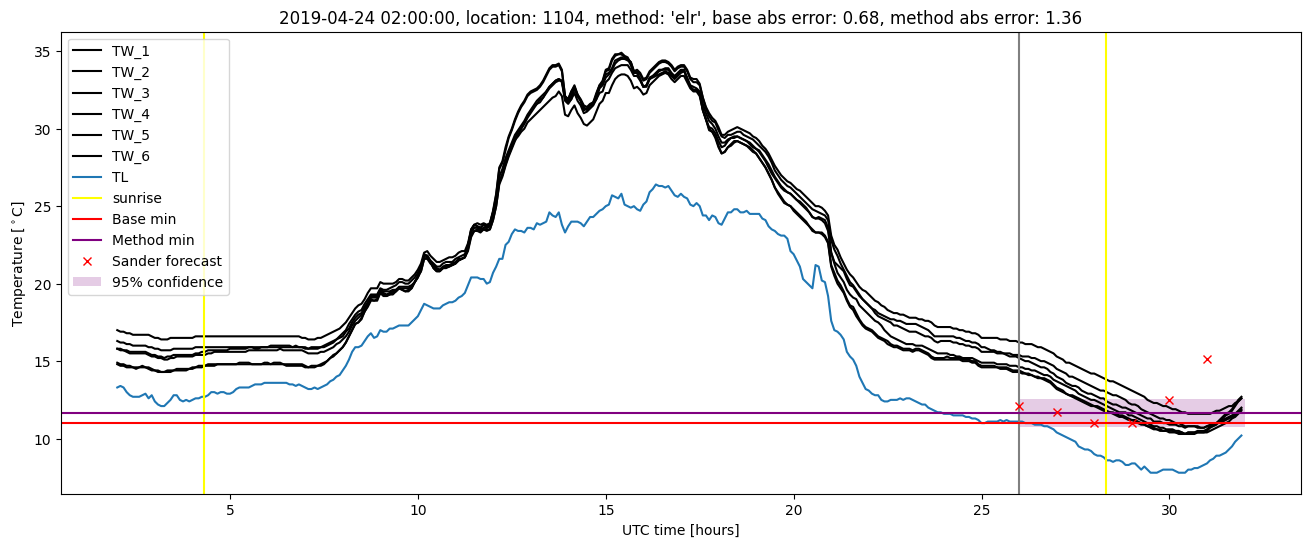
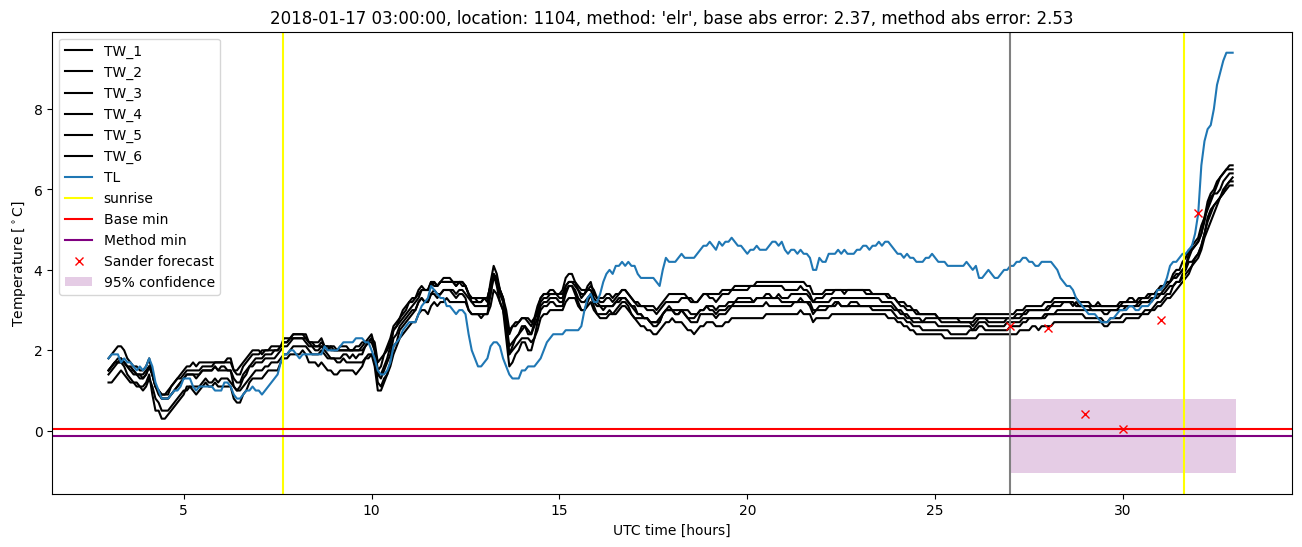
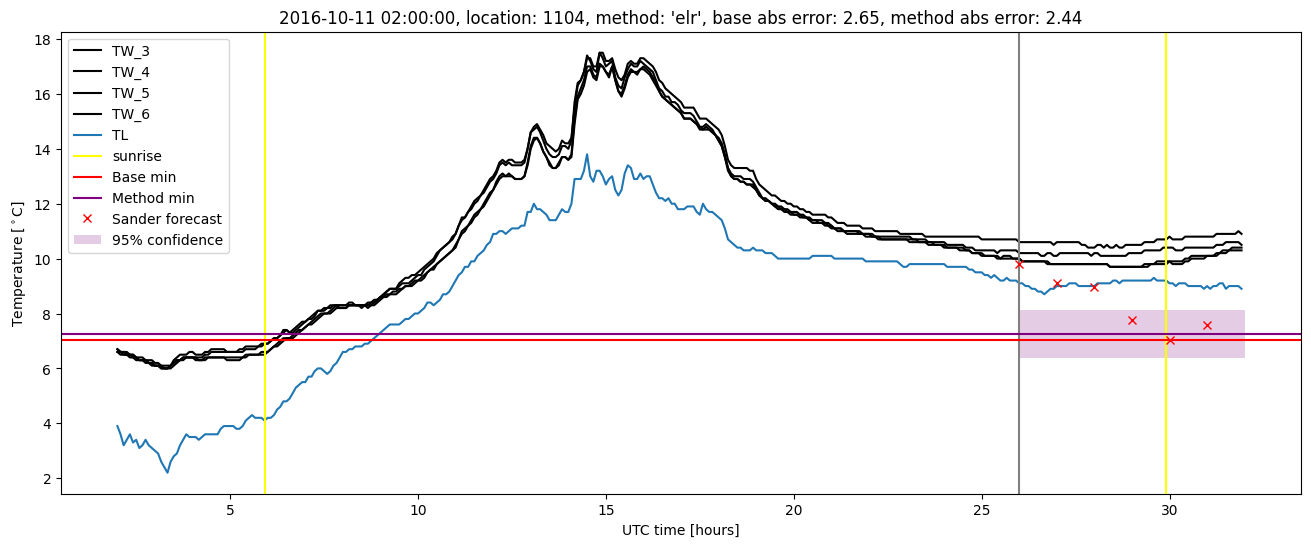
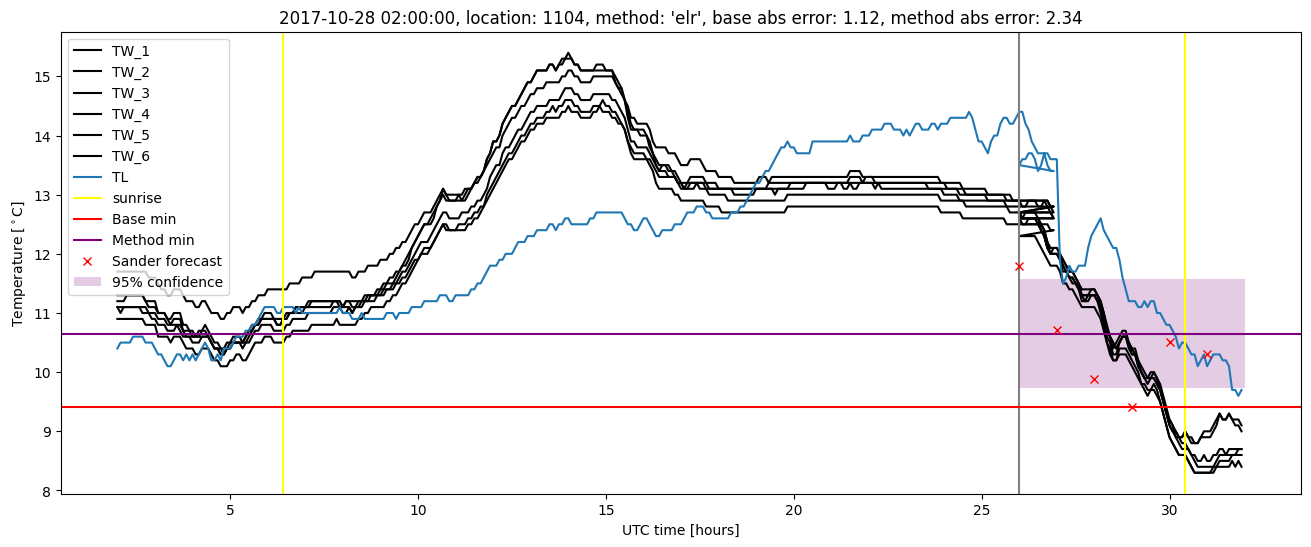
Extended logistic regression plots