GMS location: 1103
Random forest results
| names |
period |
power |
significance |
meanSquareError |
absError |
maxError |
CRPS |
IGN |
| baseline |
winter 2016 |
0.989 |
0.133 |
0.341 |
0.422 |
2.077 |
NaN |
NaN |
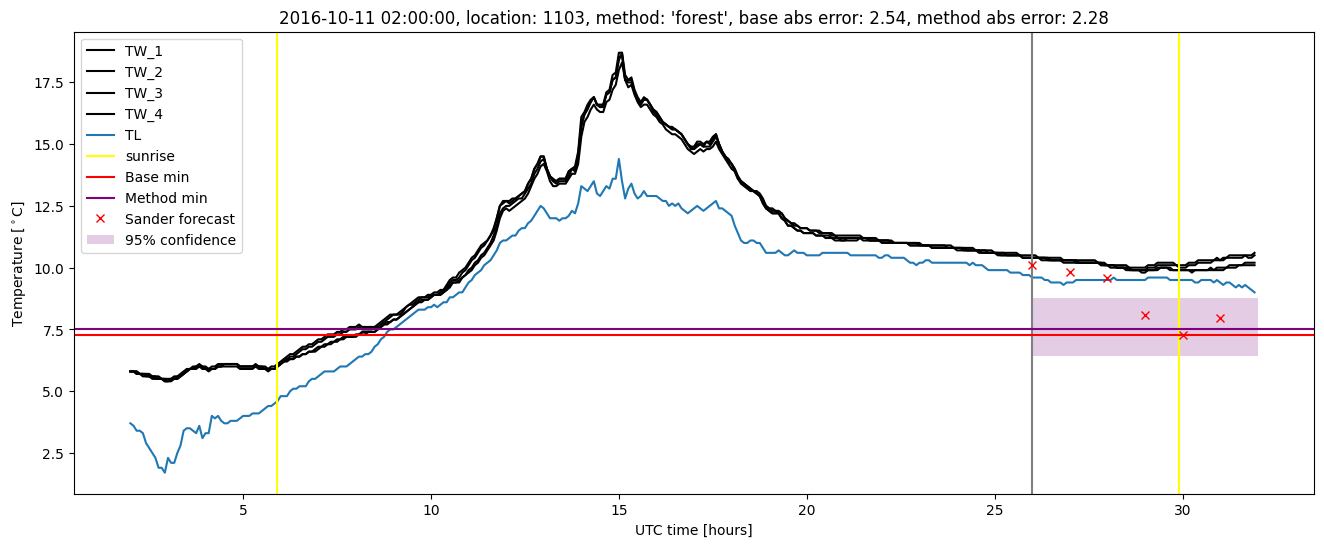
| forest |
winter 2016 |
0.977 |
0.067 |
0.286 |
0.386 |
1.927 |
0.450 |
3.723 |
| baseline |
winter 2017 |
0.983 |
0.105 |
0.560 |
0.514 |
2.539 |
NaN |
NaN |
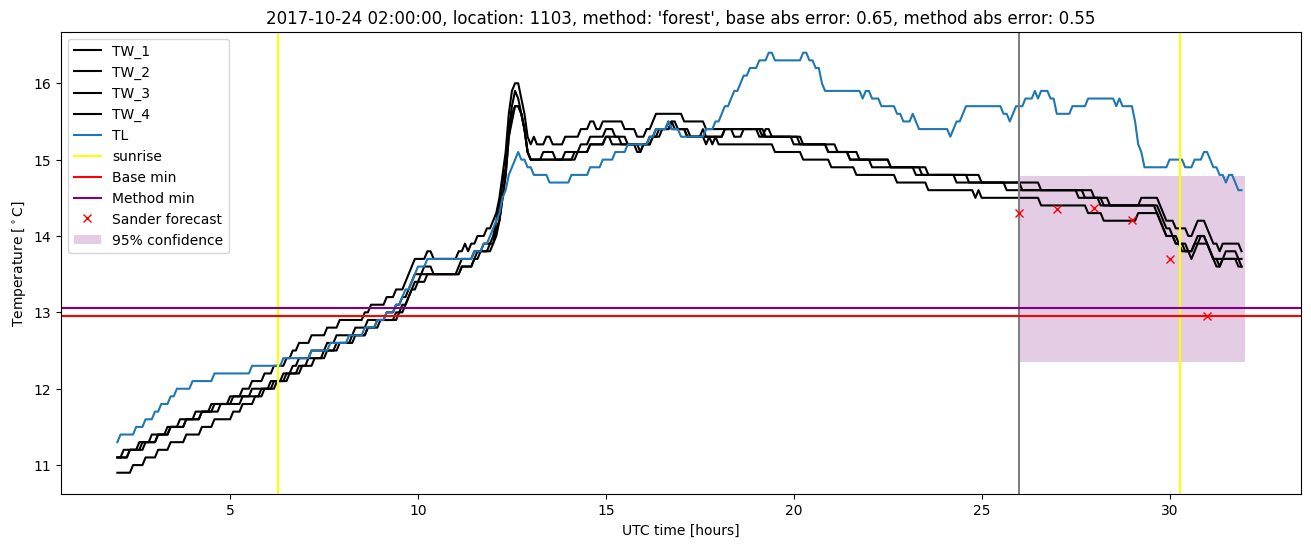
| forest |
winter 2017 |
0.991 |
0.053 |
0.363 |
0.413 |
2.283 |
0.478 |
4.984 |
| baseline |
winter 2018 |
0.986 |
0.105 |
0.397 |
0.455 |
1.975 |
NaN |
NaN |
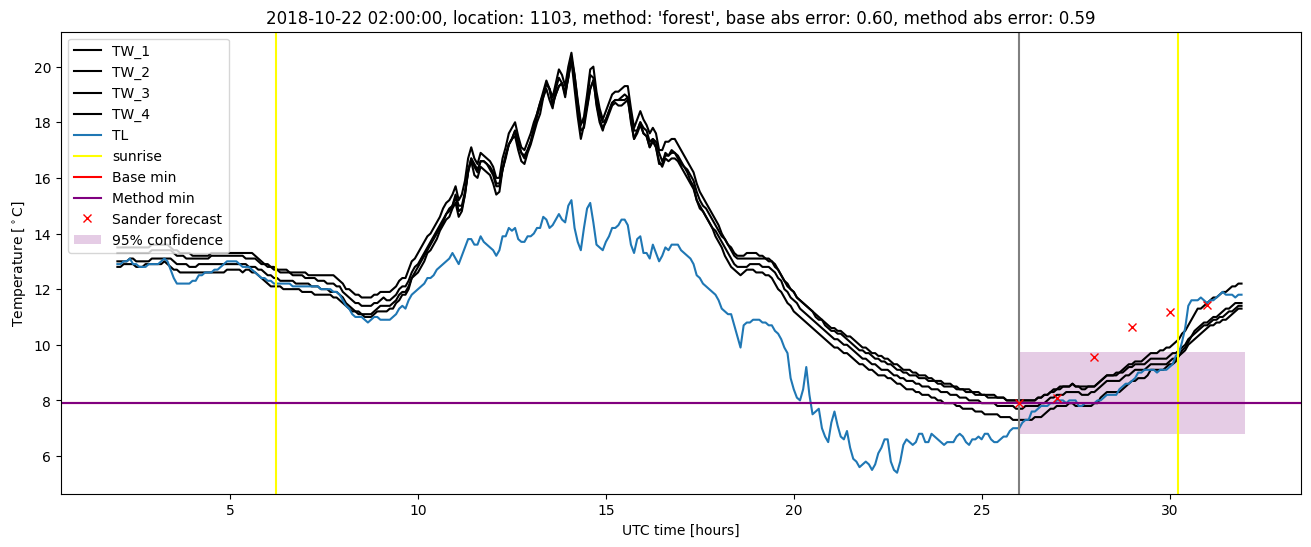
| forest |
winter 2018 |
1.000 |
0.105 |
0.331 |
0.415 |
2.132 |
0.456 |
3.802 |
| baseline |
winter 2019 |
0.981 |
0.000e+00 |
0.259 |
0.366 |
1.829 |
NaN |
NaN |
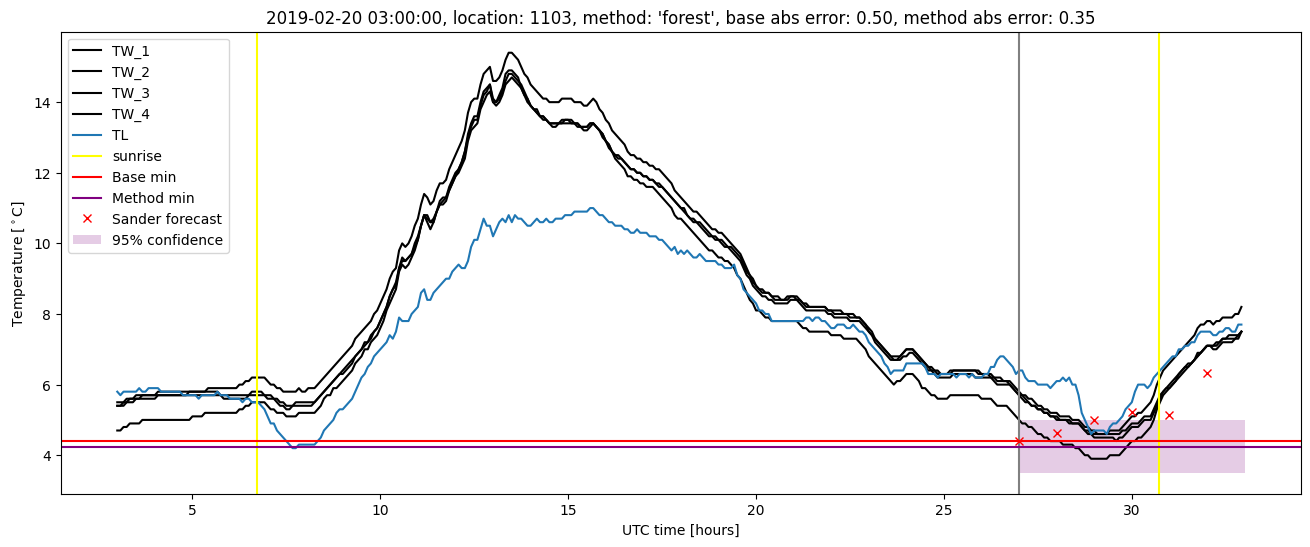
| forest |
winter 2019 |
0.994 |
0.000e+00 |
0.214 |
0.342 |
1.457 |
0.451 |
3.180 |
| baseline |
all |
0.985 |
0.102 |
0.382 |
0.437 |
2.539 |
NaN |
NaN |
| forest |
all |
0.990 |
0.068 |
0.297 |
0.389 |
2.283 |
0.458 |
3.881 |
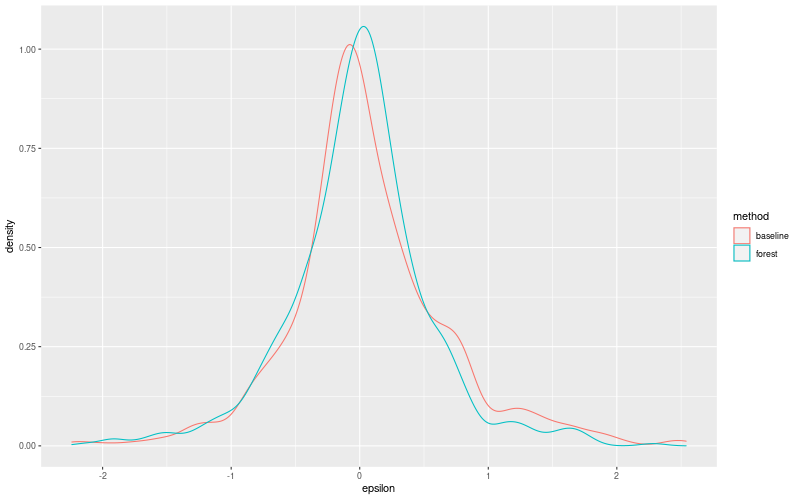
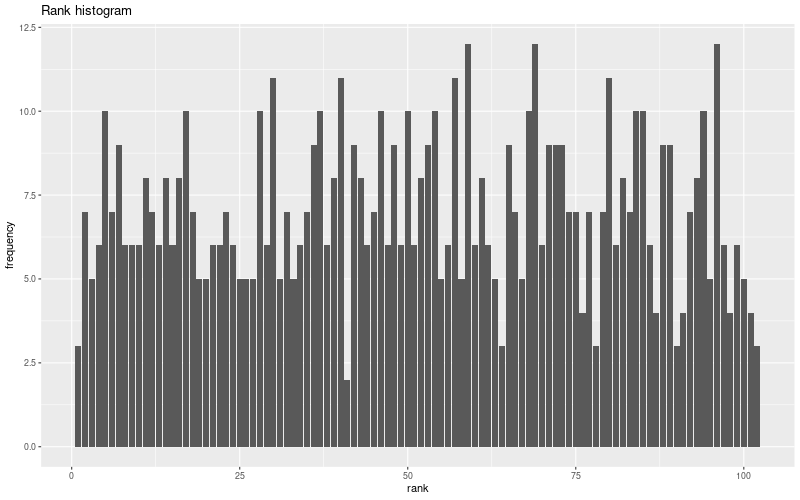
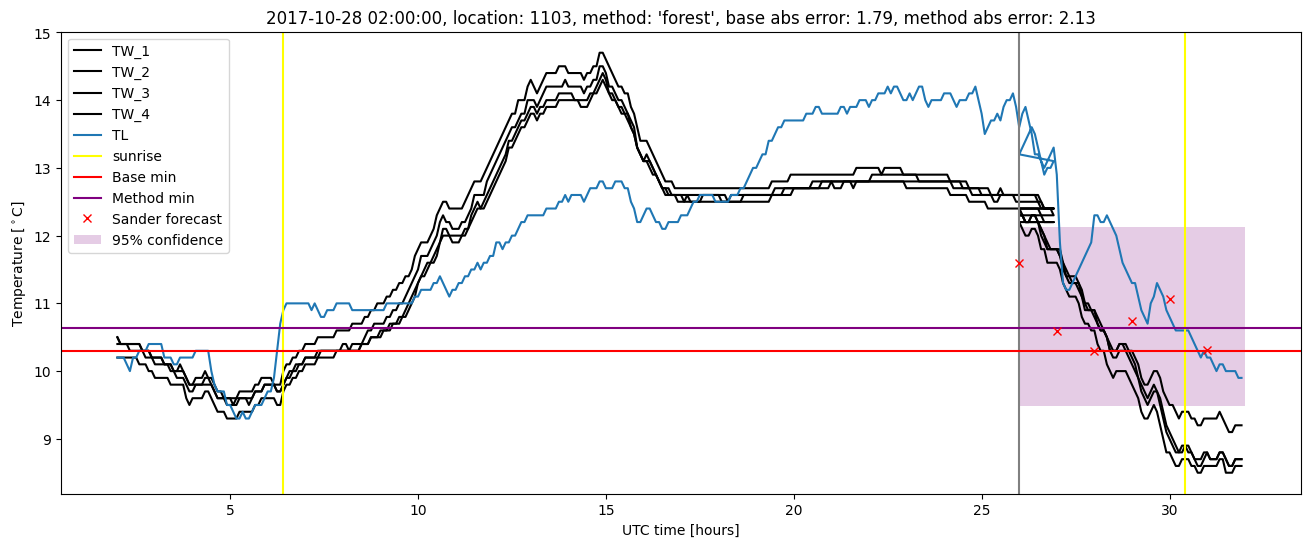
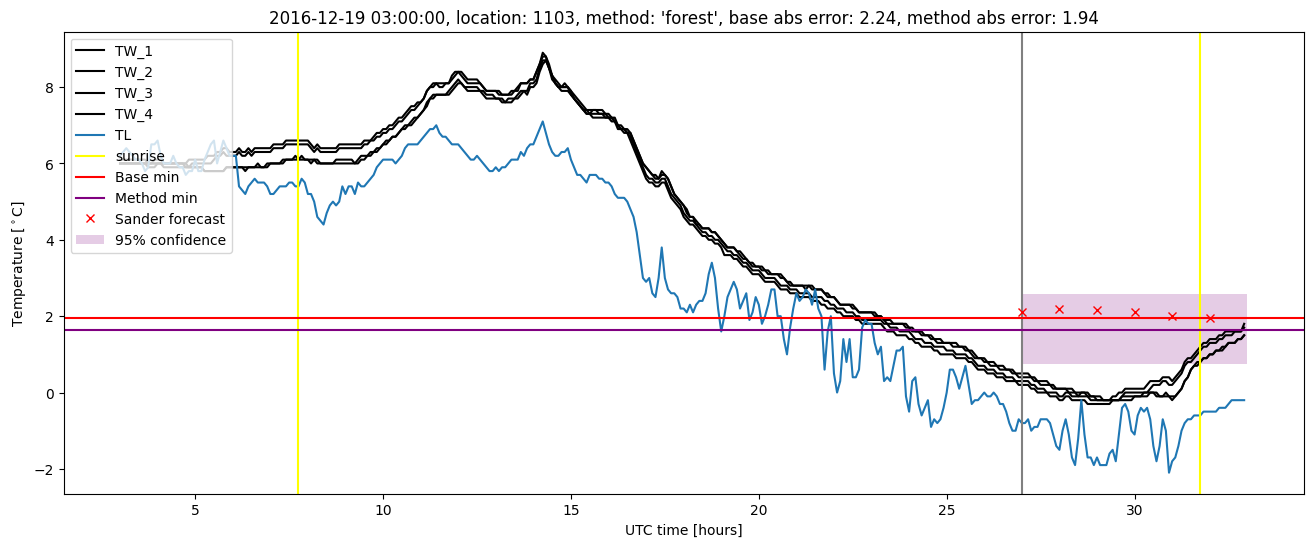
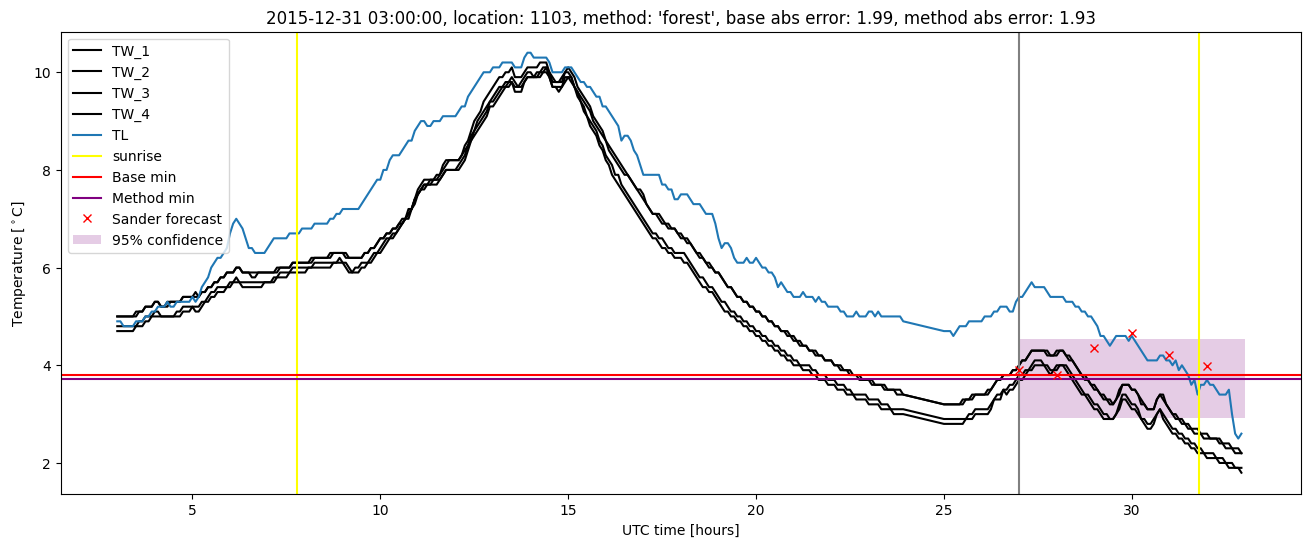
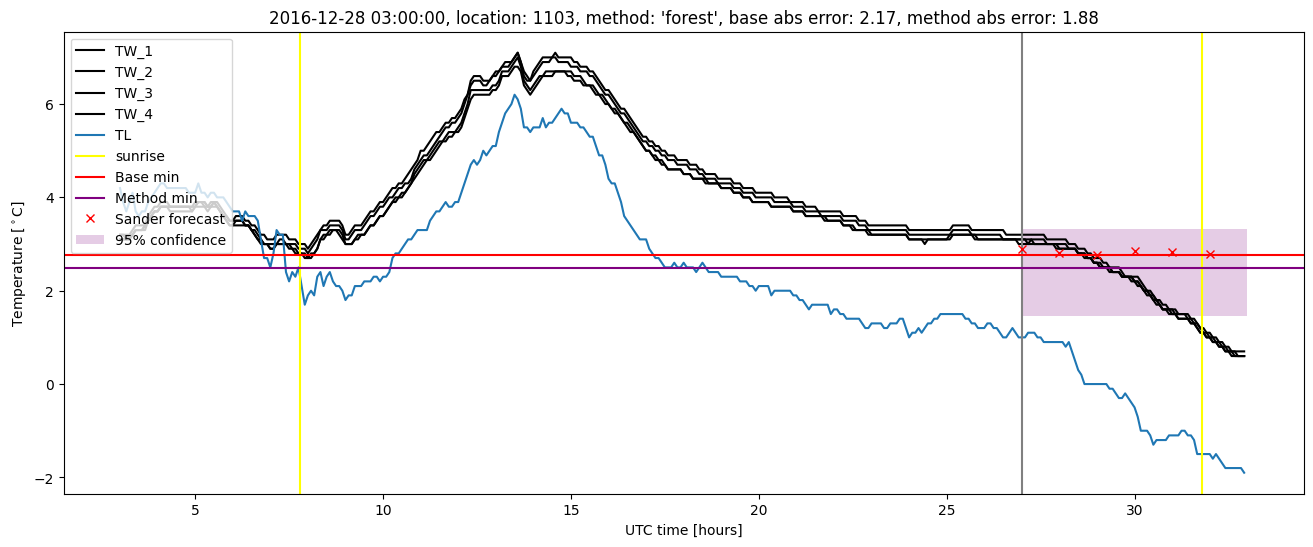
Random forest plots
Extended logistic regression results
| names |
period |
power |
significance |
meanSquareError |
absError |
maxError |
CRPS |
IGN |
| baseline |
winter 2016 |
0.989 |
0.133 |
0.341 |
0.422 |
2.077 |
NaN |
NaN |
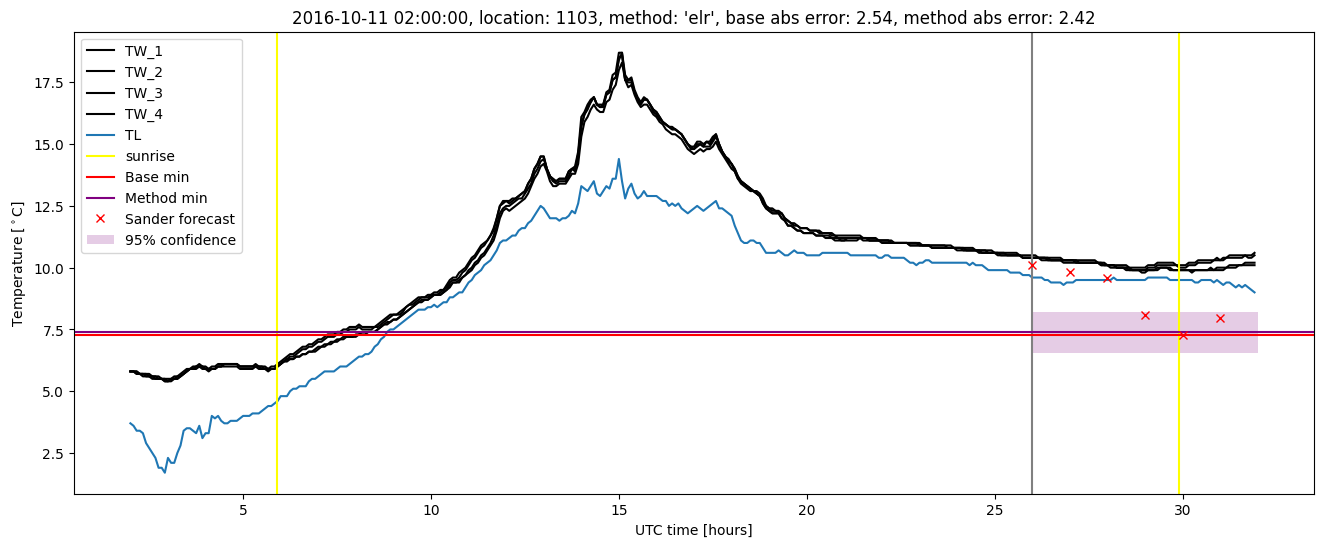
| elr |
winter 2016 |
0.989 |
0.067 |
0.296 |
0.412 |
1.901 |
0.515 |
3.726 |
| baseline |
winter 2017 |
0.983 |
0.105 |
0.560 |
0.514 |
2.539 |
NaN |
NaN |
| elr |
winter 2017 |
0.983 |
0.079 |
0.472 |
0.485 |
2.420 |
0.513 |
4.638 |
| baseline |
winter 2018 |
0.986 |
0.105 |
0.397 |
0.455 |
1.975 |
NaN |
NaN |
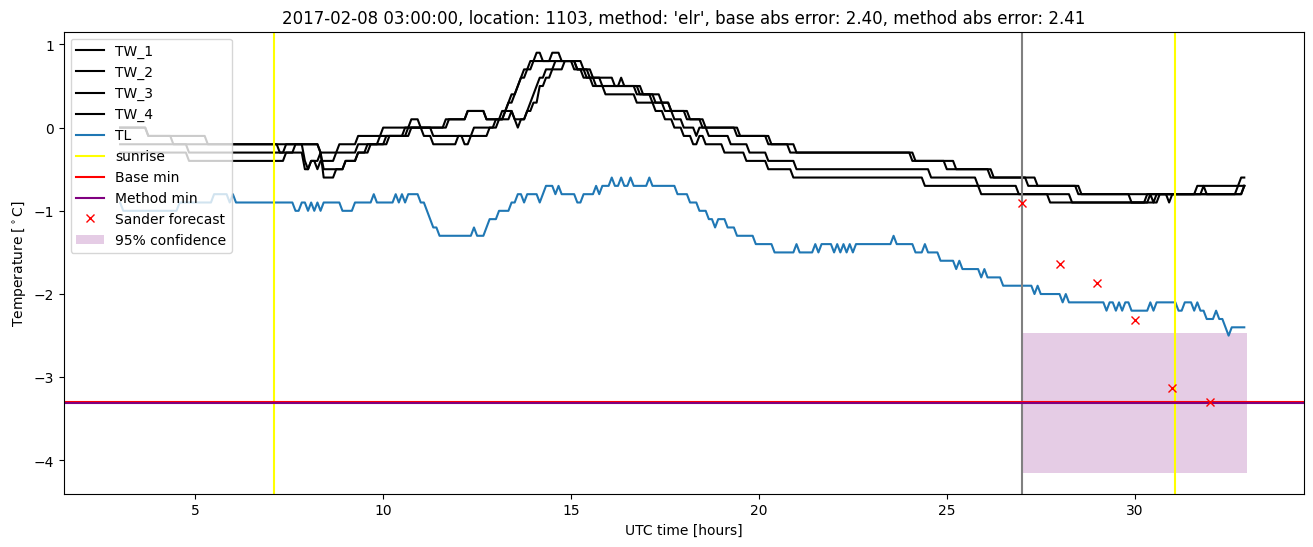
| elr |
winter 2018 |
0.993 |
0.053 |
0.366 |
0.438 |
2.393 |
0.534 |
4.399 |
| baseline |
winter 2019 |
0.981 |
0.000e+00 |
0.259 |
0.366 |
1.829 |
NaN |
NaN |
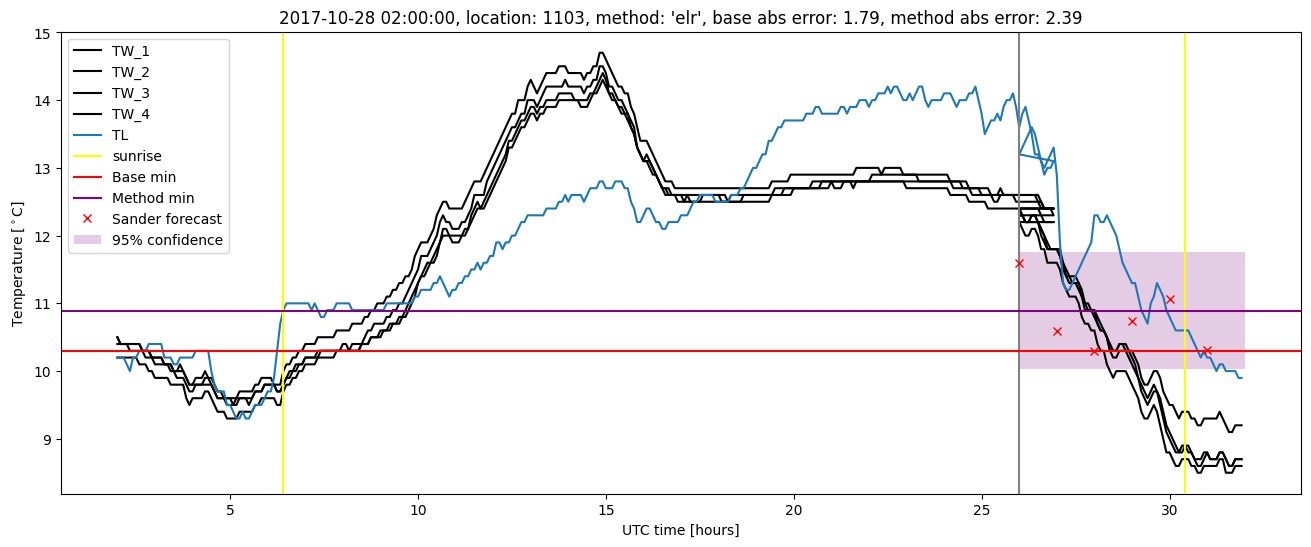
| elr |
winter 2019 |
0.988 |
0.000e+00 |
0.250 |
0.381 |
1.730 |
0.510 |
3.325 |
| baseline |
all |
0.985 |
0.102 |
0.382 |
0.437 |
2.539 |
NaN |
NaN |
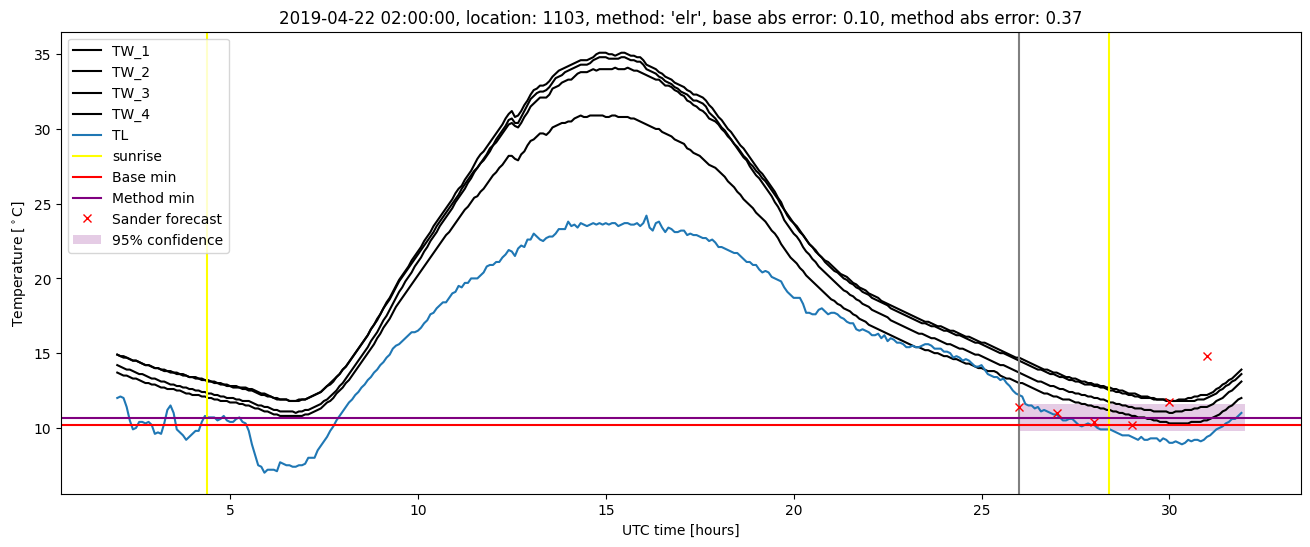
| elr |
all |
0.988 |
0.059 |
0.341 |
0.427 |
2.420 |
0.518 |
3.996 |
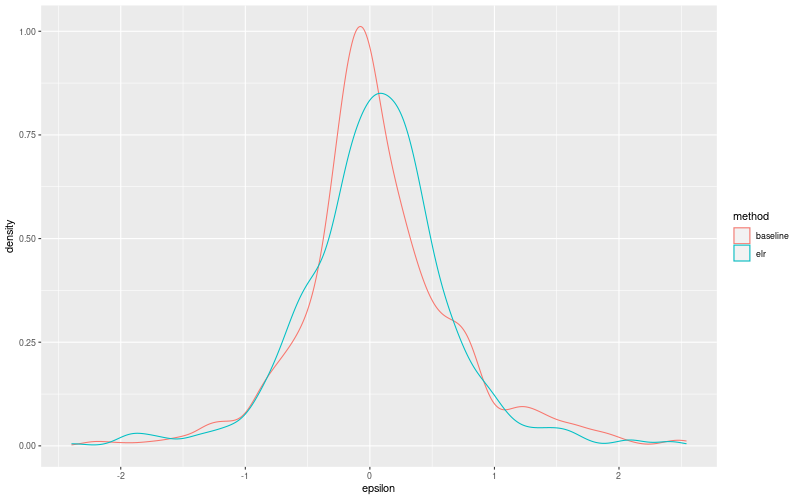
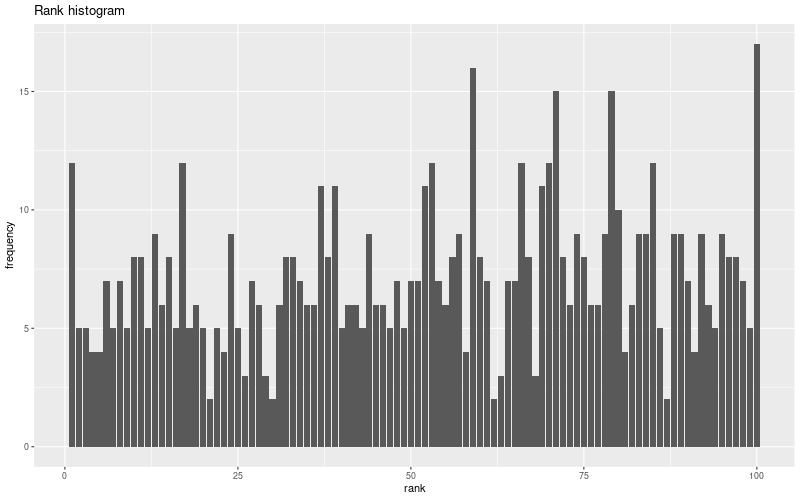
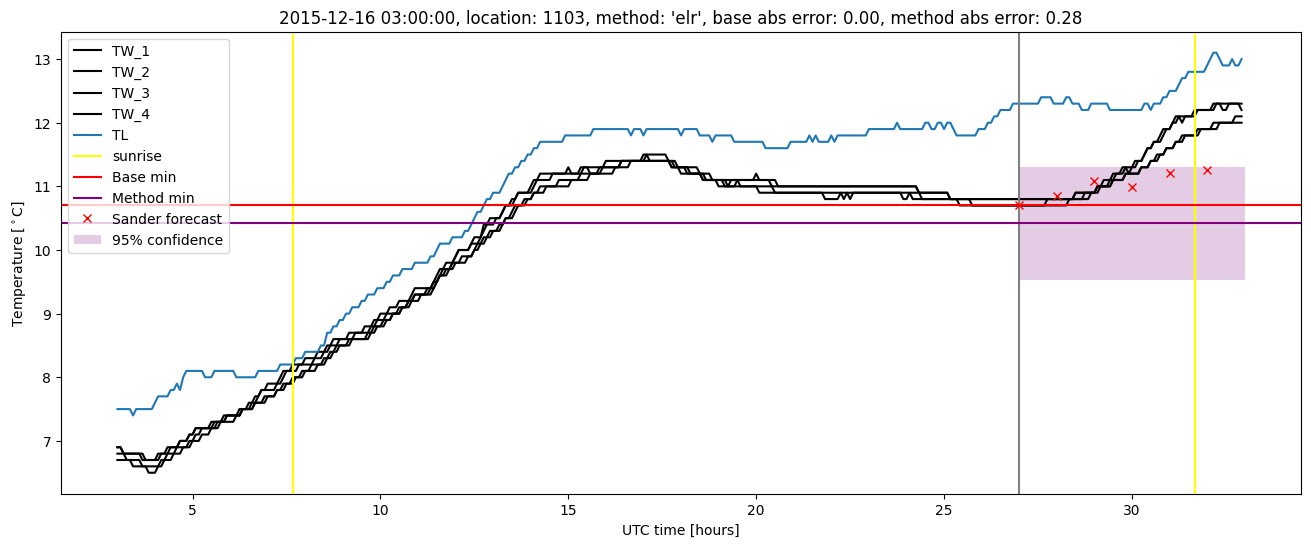
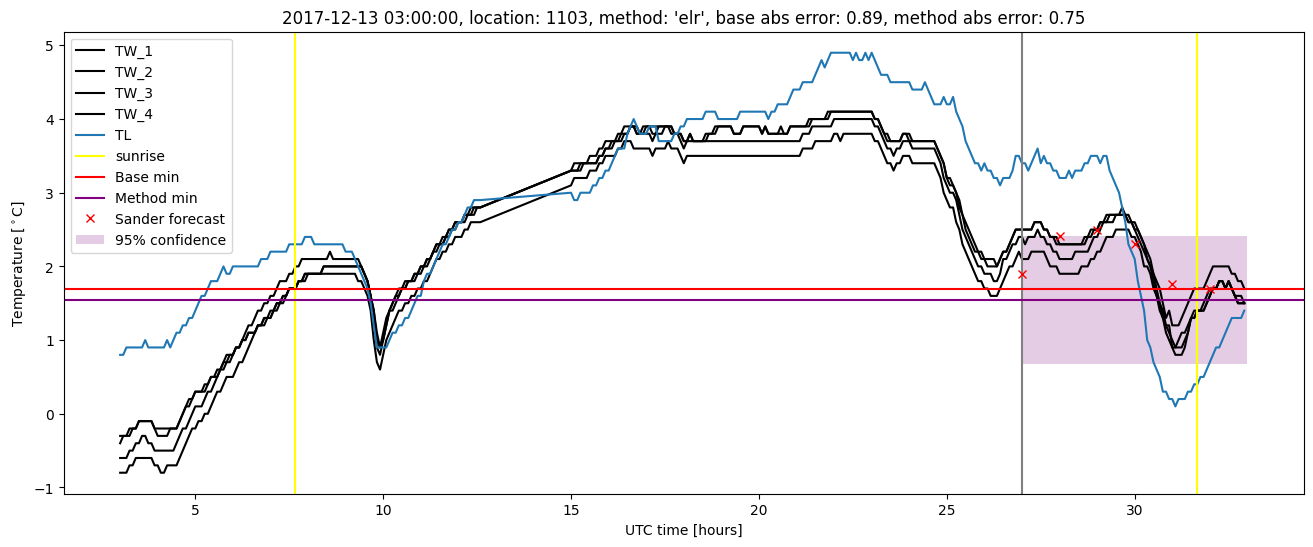
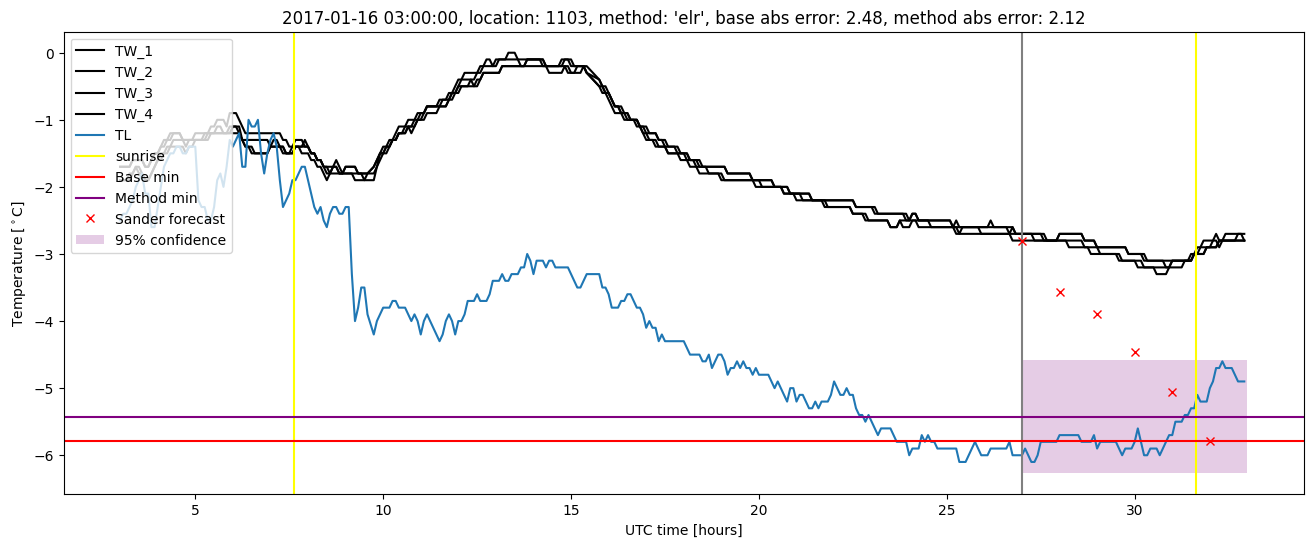
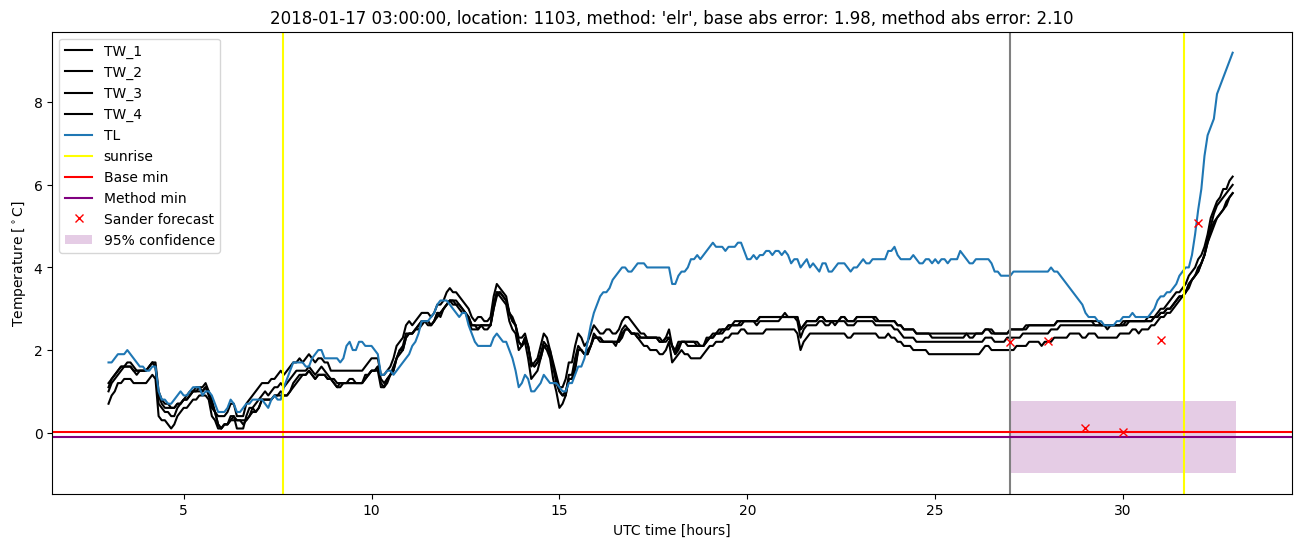
Extended logistic regression plots