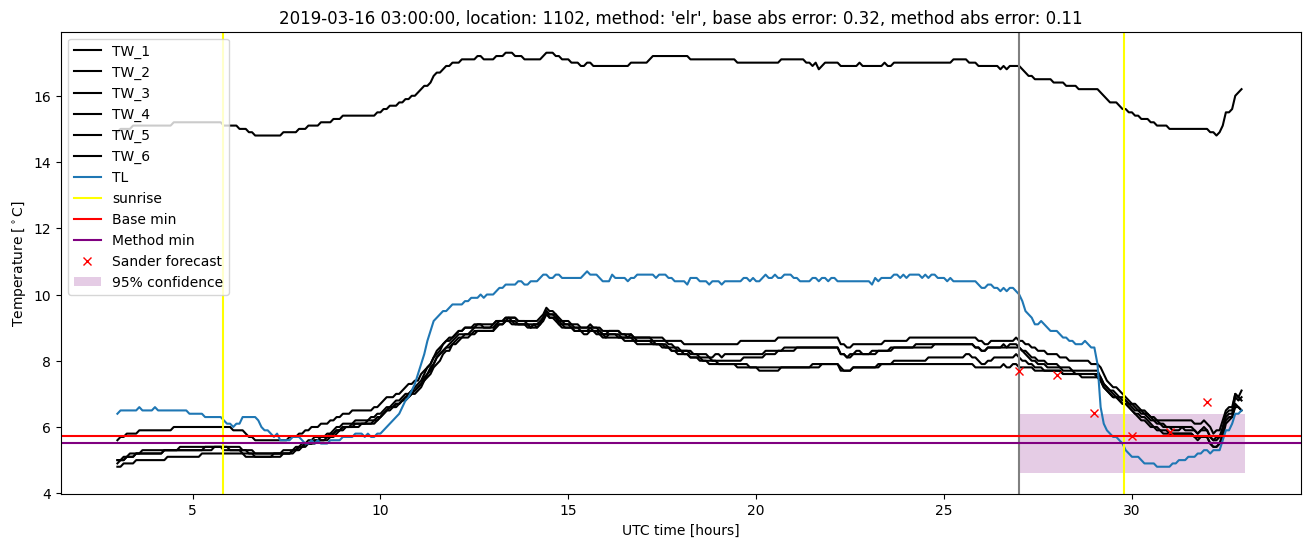
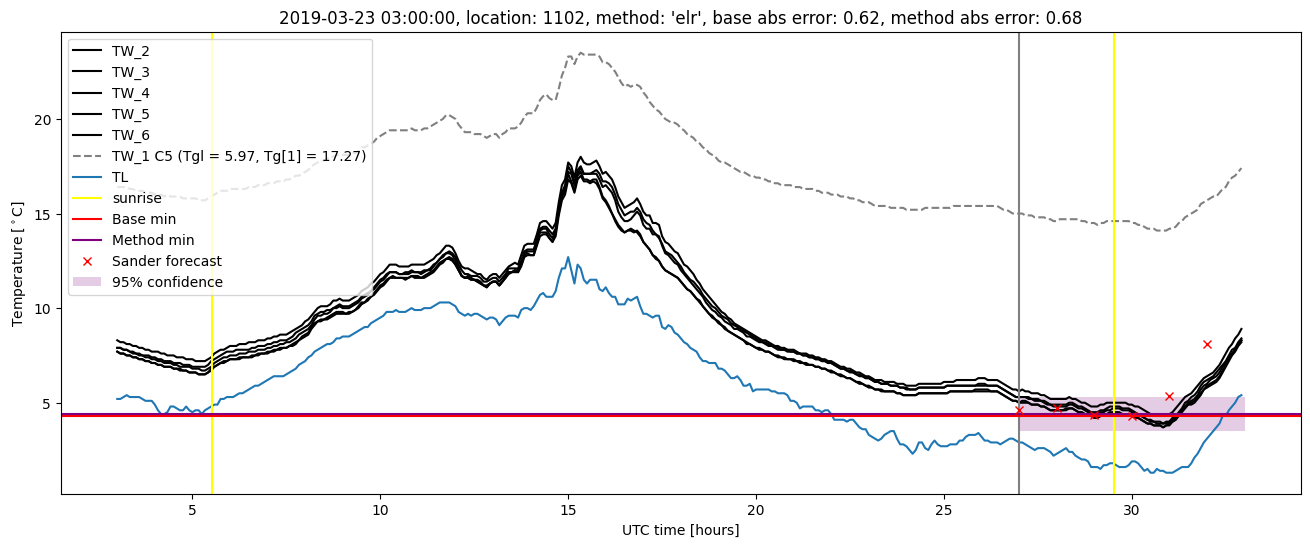
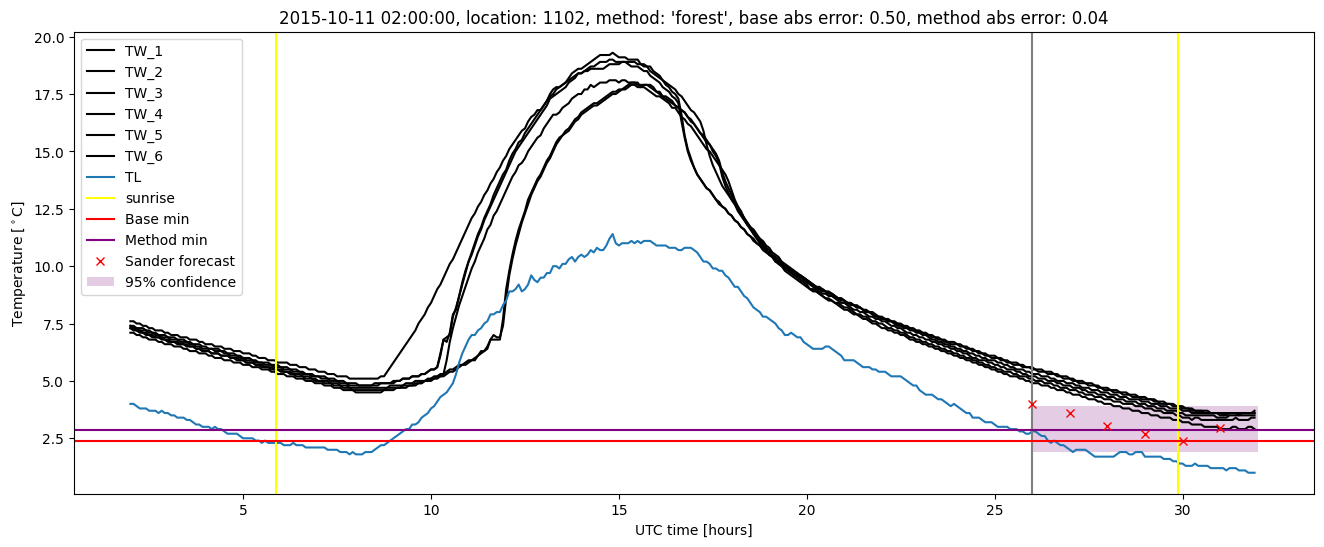
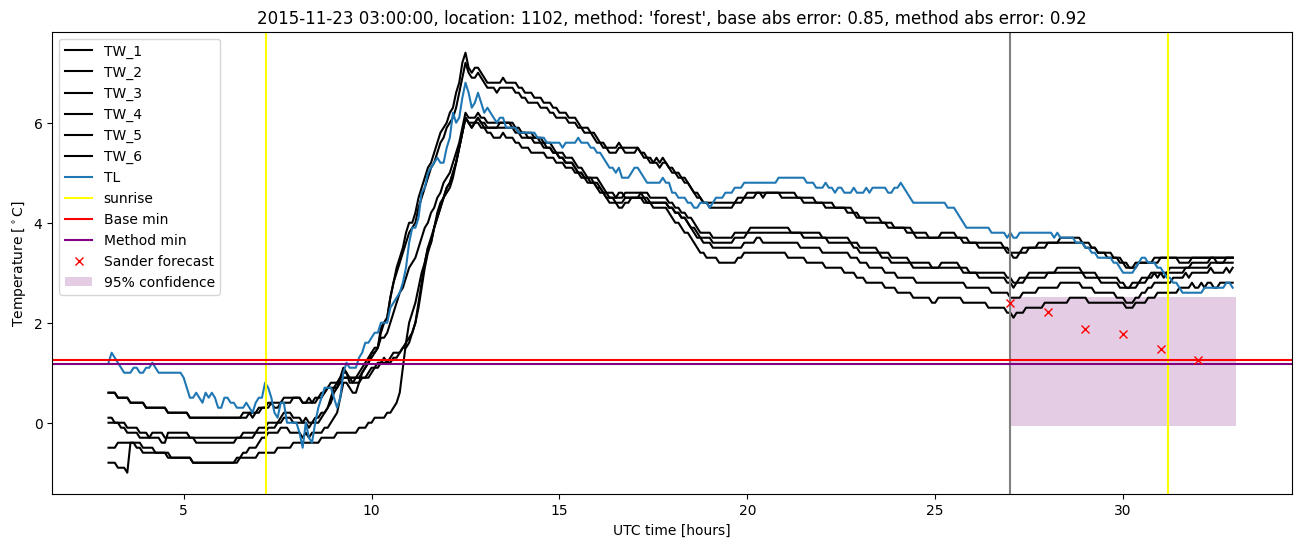
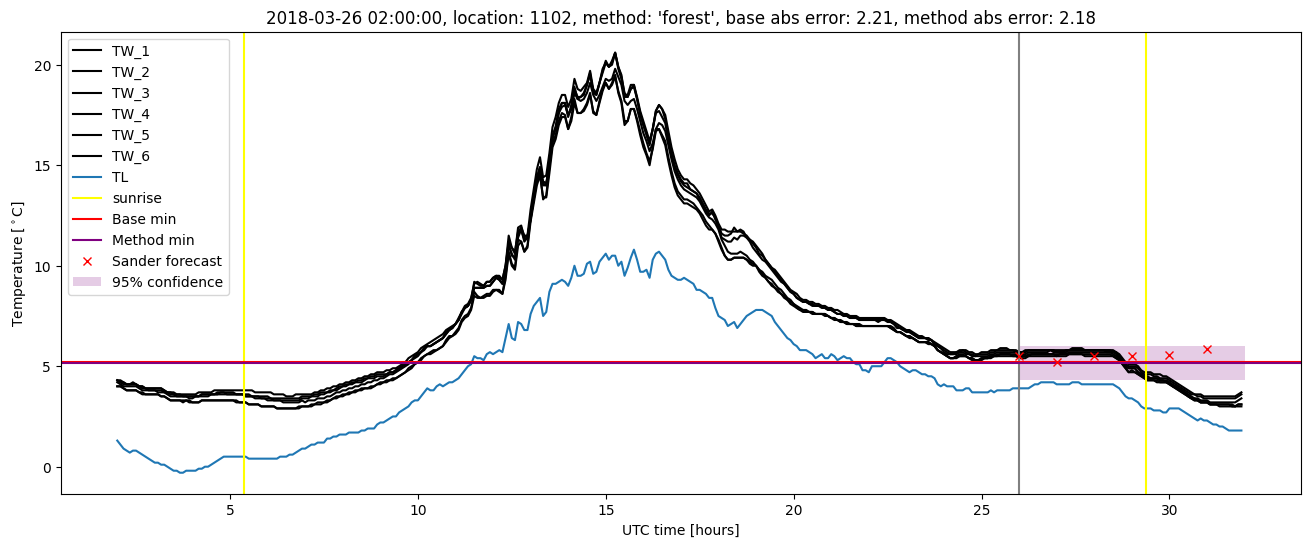
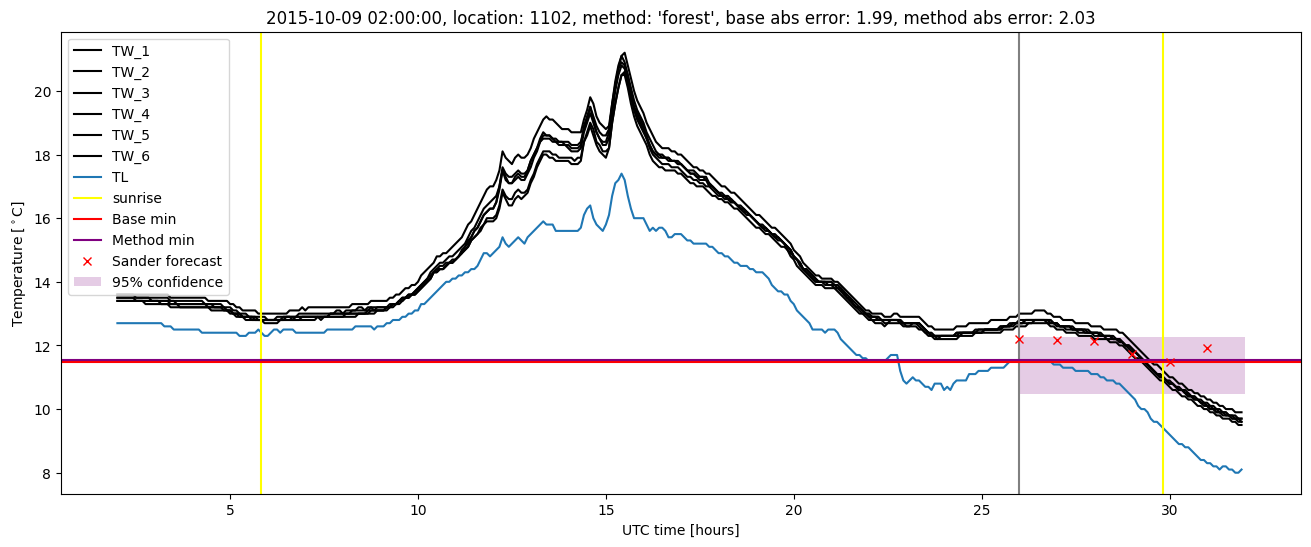
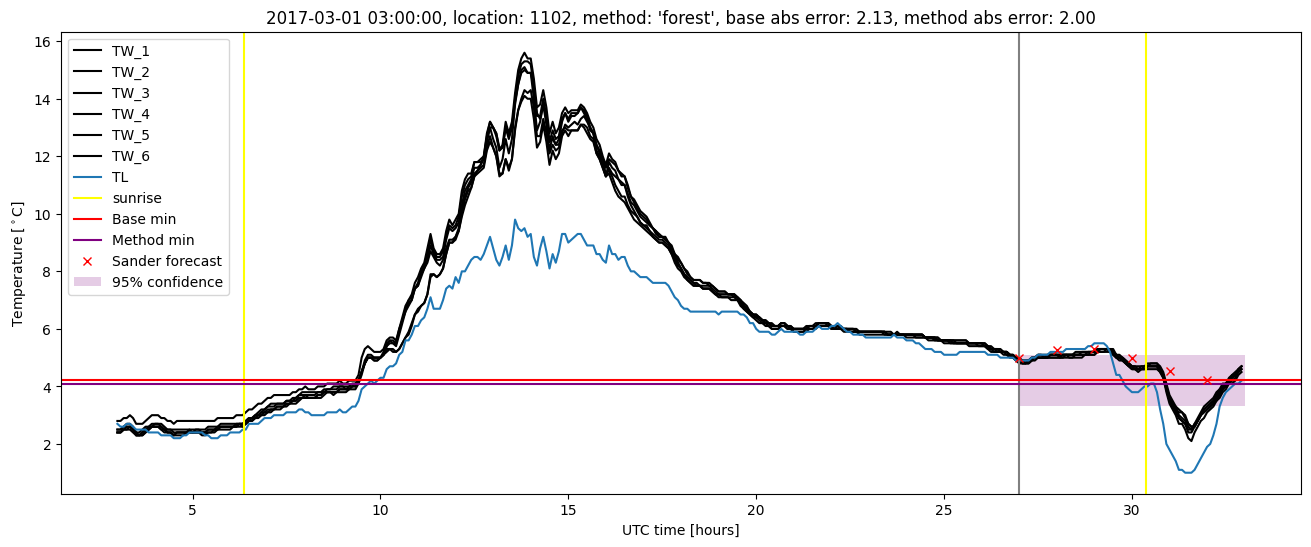
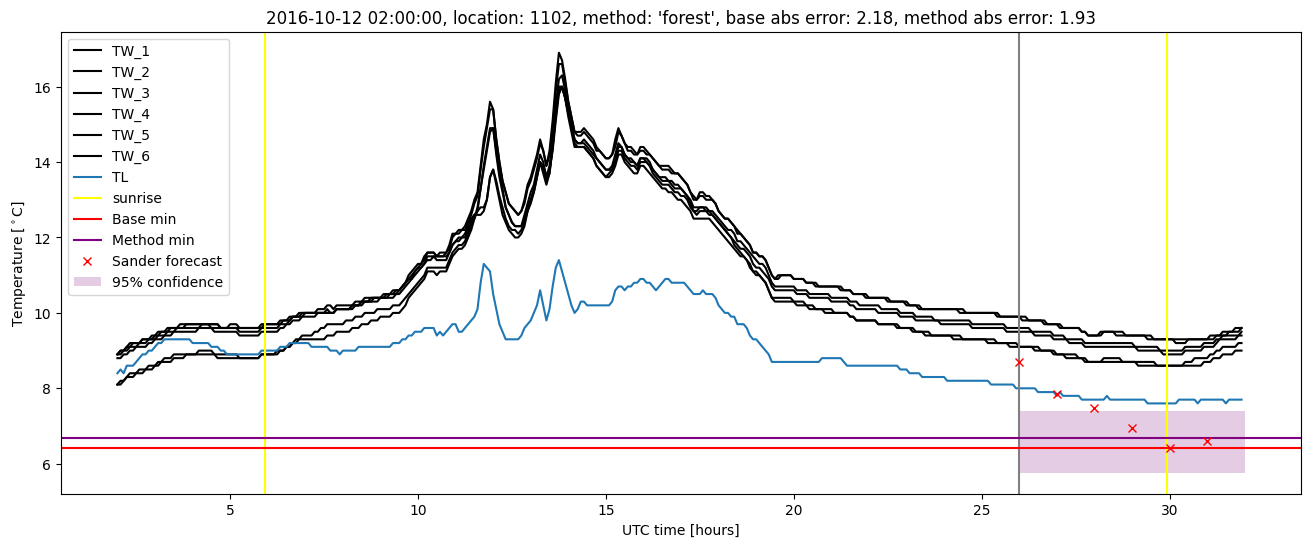
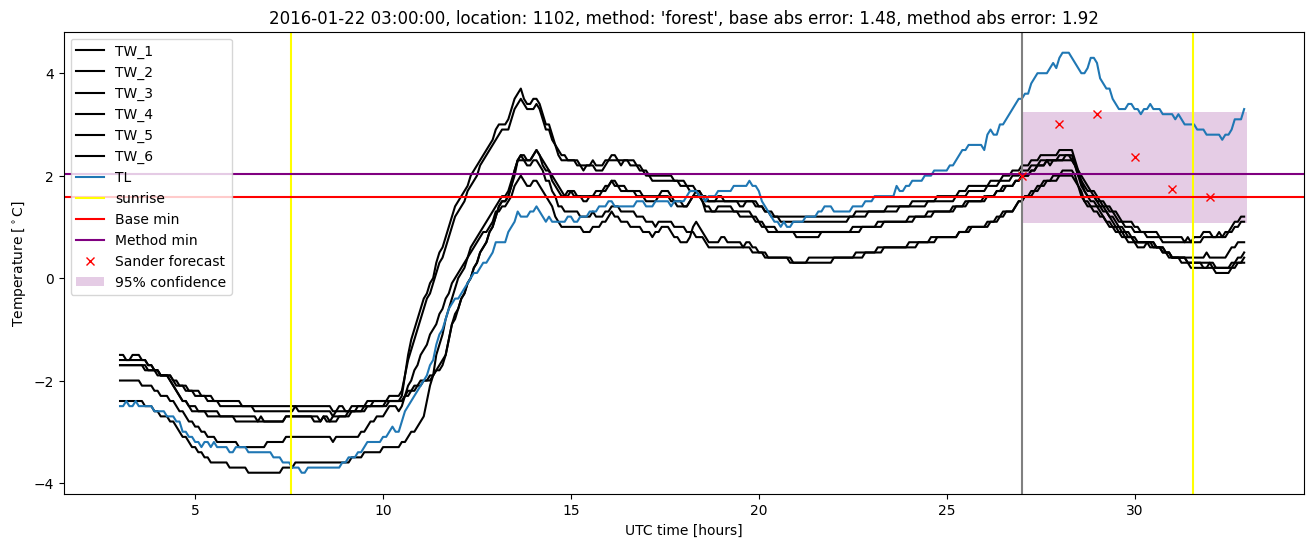
GMS location: 1102
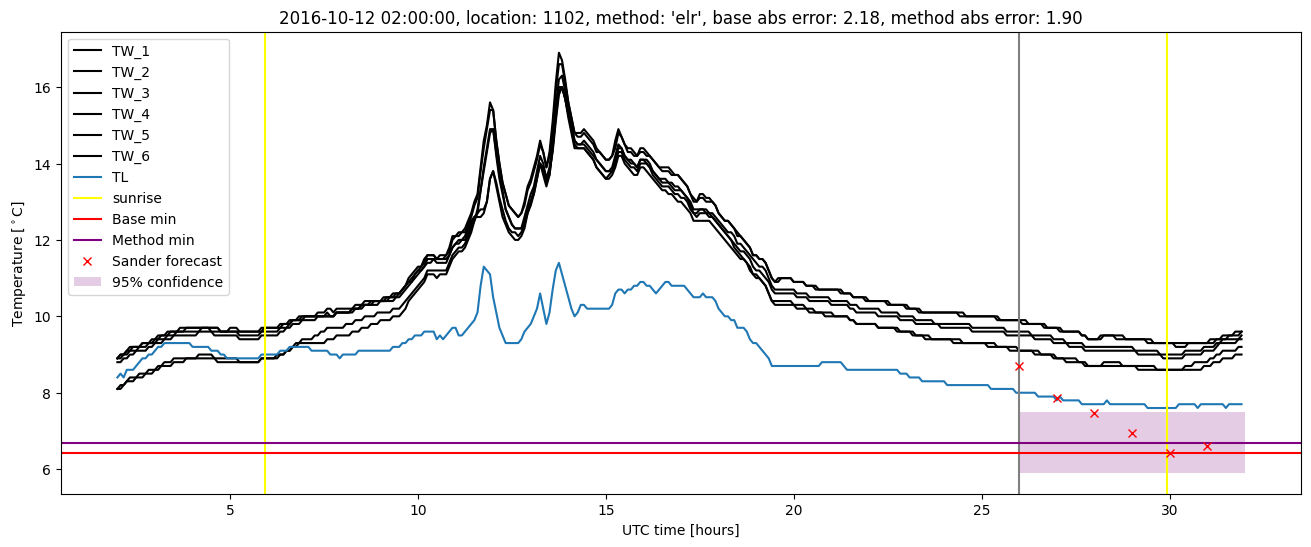
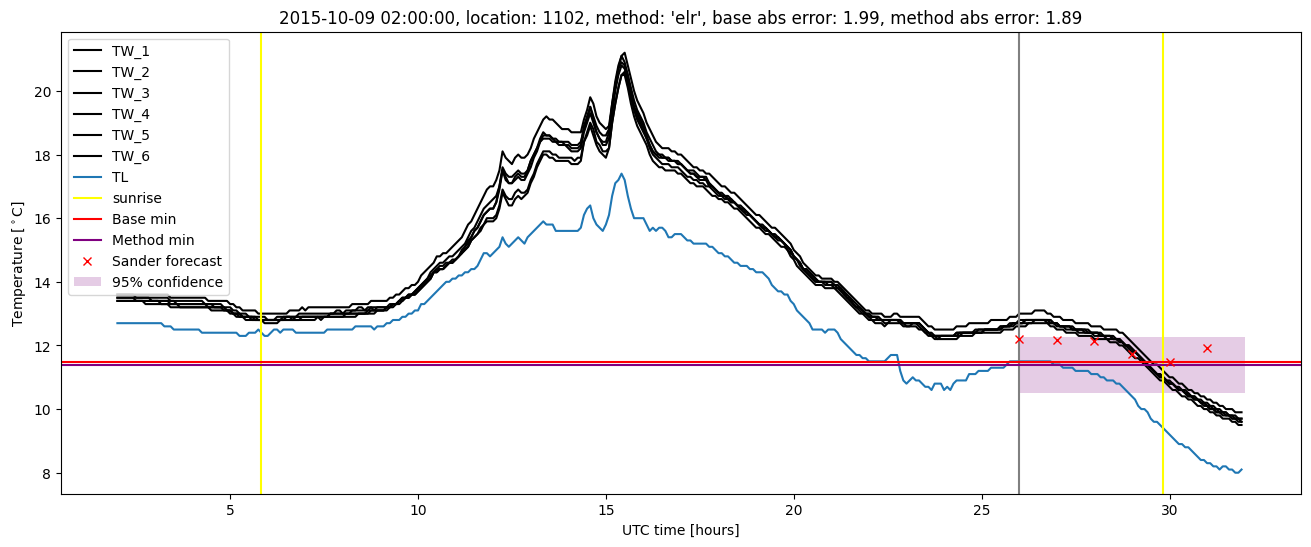
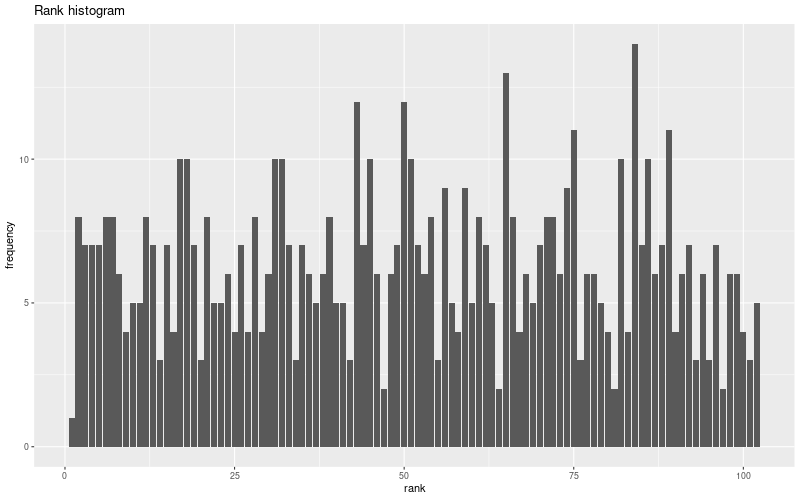
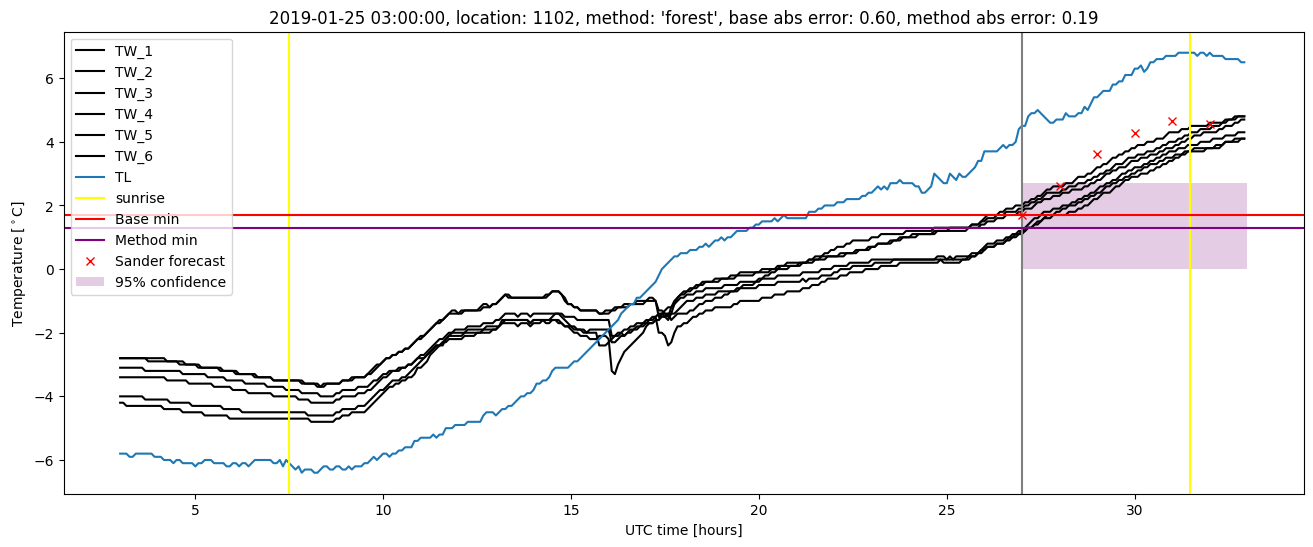
Random forest results
| names |
period |
power |
significance |
meanSquareError |
absError |
maxError |
CRPS |
IGN |
| baseline |
winter 2016 |
0.994 |
0.094 |
0.286 |
0.399 |
1.987 |
NaN |
NaN |
| forest |
winter 2016 |
0.975 |
0.062 |
0.288 |
0.378 |
2.029 |
0.455 |
4.255 |
| baseline |
winter 2017 |
0.983 |
0.051 |
0.434 |
0.465 |
2.185 |
NaN |
NaN |
| forest |
winter 2017 |
0.983 |
0.051 |
0.324 |
0.403 |
1.998 |
0.464 |
5.315 |
| baseline |
winter 2018 |
0.976 |
0.182 |
0.346 |
0.425 |
2.210 |
NaN |
NaN |
| forest |
winter 2018 |
0.984 |
0.151 |
0.331 |
0.420 |
2.184 |
0.466 |
4.447 |
| baseline |
winter 2019 |
0.992 |
0.000e+00 |
0.247 |
0.359 |
1.639 |
NaN |
NaN |
| forest |
winter 2019 |
0.992 |
0.000e+00 |
0.172 |
0.296 |
1.466 |
0.454 |
3.725 |
| baseline |
all |
0.987 |
0.092 |
0.327 |
0.412 |
2.210 |
NaN |
NaN |
| forest |
all |
0.983 |
0.075 |
0.281 |
0.375 |
2.184 |
0.460 |
4.432 |
Random forest plots
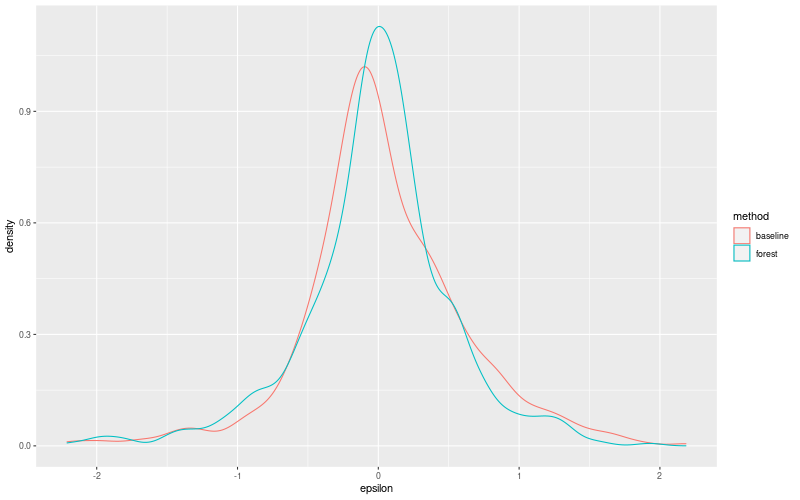
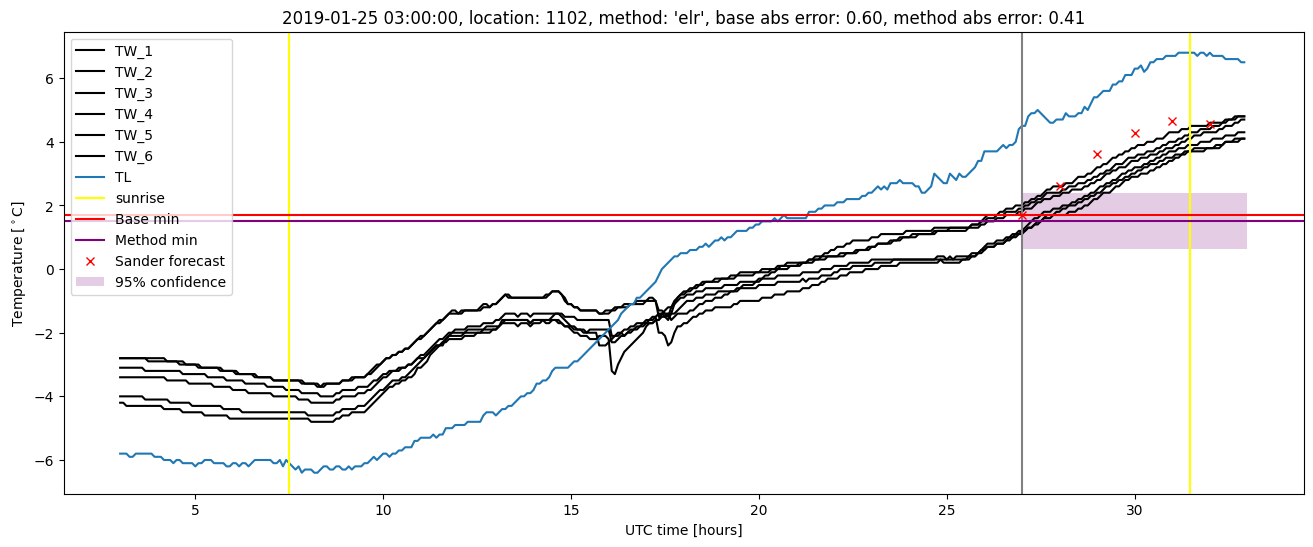
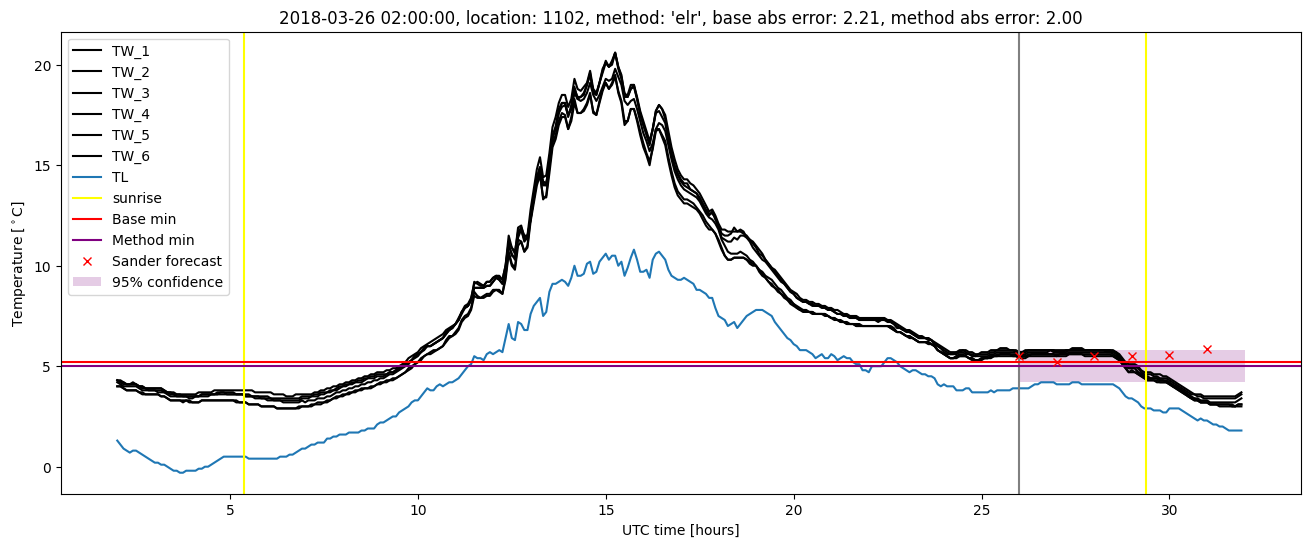
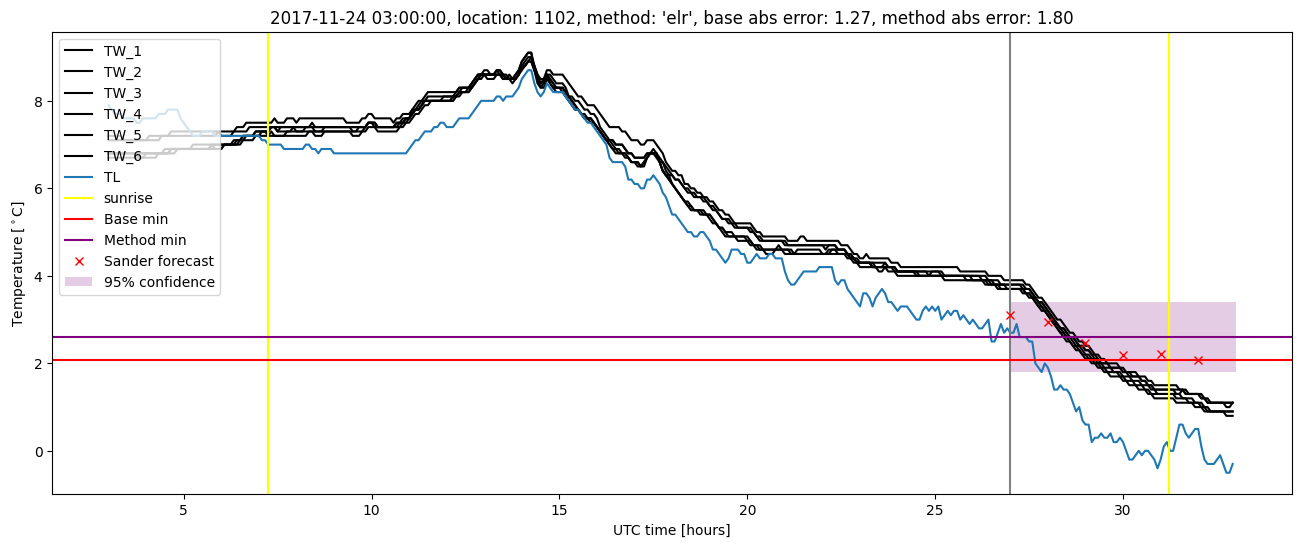
Extended logistic regression results
| names |
period |
power |
significance |
meanSquareError |
absError |
maxError |
CRPS |
IGN |
| baseline |
winter 2016 |
0.994 |
0.094 |
0.286 |
0.399 |
1.987 |
NaN |
NaN |
| elr |
winter 2016 |
0.975 |
0.094 |
0.276 |
0.402 |
1.891 |
0.534 |
4.230 |
| baseline |
winter 2017 |
0.983 |
0.051 |
0.434 |
0.465 |
2.185 |
NaN |
NaN |
| elr |
winter 2017 |
0.983 |
0.026 |
0.374 |
0.445 |
1.903 |
0.549 |
6.489 |
| baseline |
winter 2018 |
0.976 |
0.182 |
0.346 |
0.425 |
2.210 |
NaN |
NaN |
| elr |
winter 2018 |
0.984 |
0.151 |
0.320 |
0.433 |
2.003 |
0.548 |
5.917 |
| baseline |
winter 2019 |
0.992 |
0.000e+00 |
0.247 |
0.359 |
1.639 |
NaN |
NaN |
| elr |
winter 2019 |
1.000 |
0.000e+00 |
0.209 |
0.356 |
1.311 |
0.527 |
3.837 |
| baseline |
all |
0.987 |
0.092 |
0.327 |
0.412 |
2.210 |
NaN |
NaN |
| elr |
all |
0.985 |
0.075 |
0.295 |
0.409 |
2.003 |
0.539 |
5.087 |
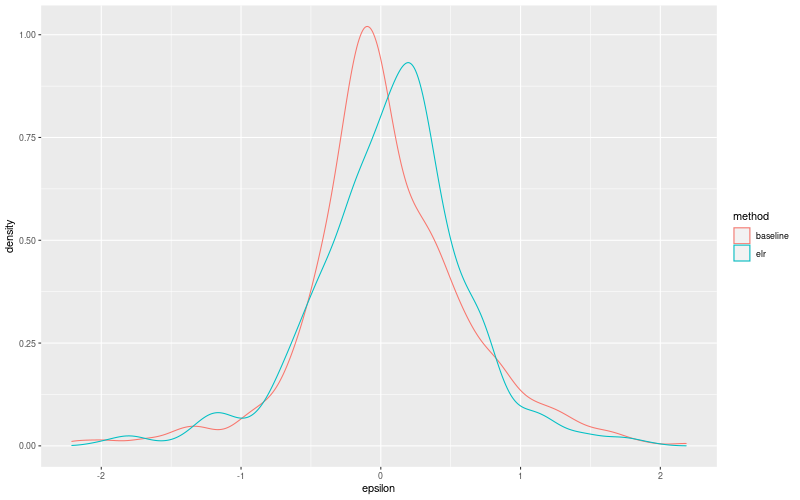
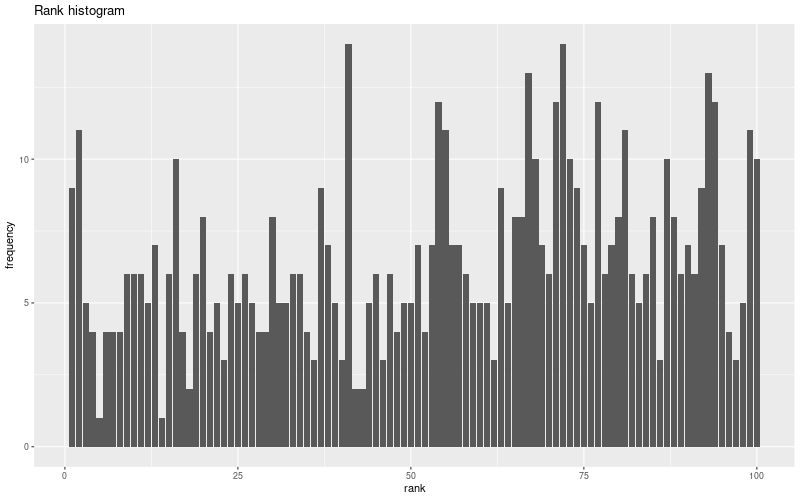
Extended logistic regression plots