GMS location: 109
Random forest results
| names |
period |
power |
significance |
meanSquareError |
absError |
maxError |
CRPS |
IGN |
| baseline |
winter 2016 |
0.982 |
0.042 |
0.293 |
0.400 |
2.072 |
NaN |
NaN |
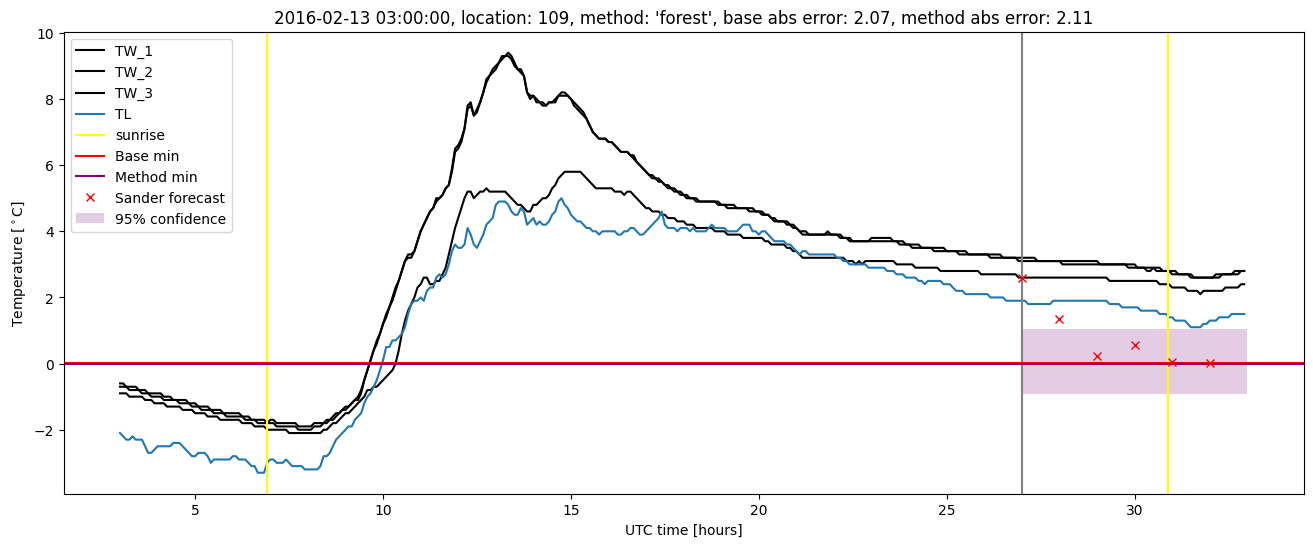
| forest |
winter 2016 |
0.988 |
0.042 |
0.246 |
0.353 |
2.106 |
0.453 |
3.644 |
| baseline |
winter 2017 |
0.982 |
0.023 |
0.466 |
0.494 |
2.007 |
NaN |
NaN |
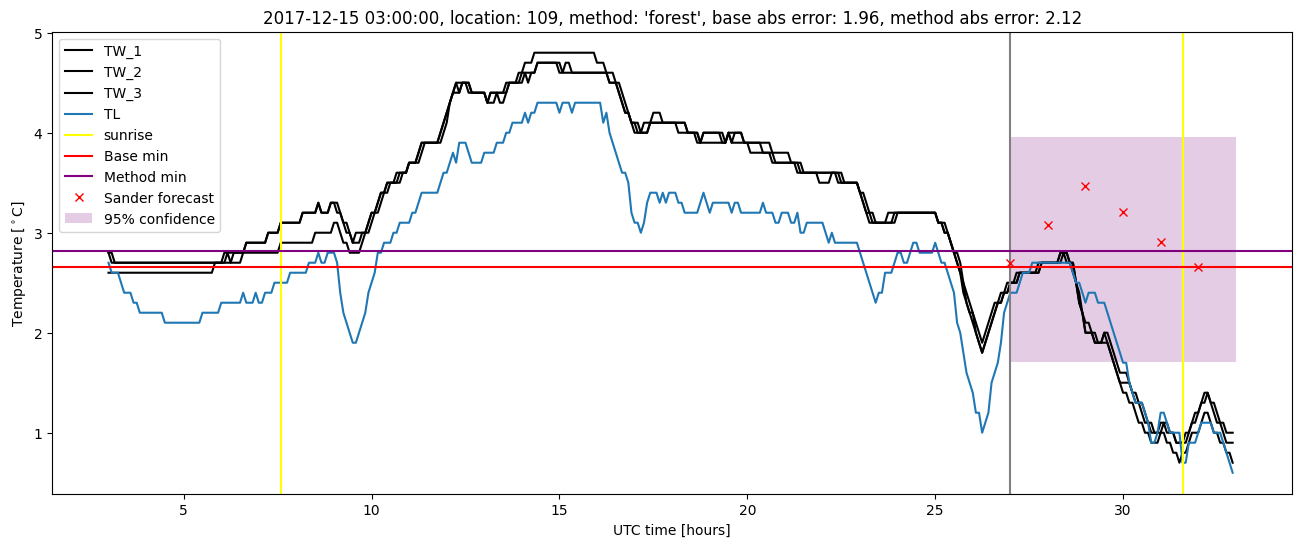
| forest |
winter 2017 |
0.991 |
0.046 |
0.324 |
0.408 |
1.760 |
0.450 |
2.872 |
| baseline |
winter 2018 |
0.987 |
0.077 |
0.333 |
0.428 |
2.602 |
NaN |
NaN |
| forest |
winter 2018 |
0.993 |
0.077 |
0.249 |
0.357 |
2.470 |
0.448 |
3.529 |
| baseline |
winter 2019 |
0.979 |
0.067 |
0.368 |
0.444 |
1.968 |
NaN |
NaN |
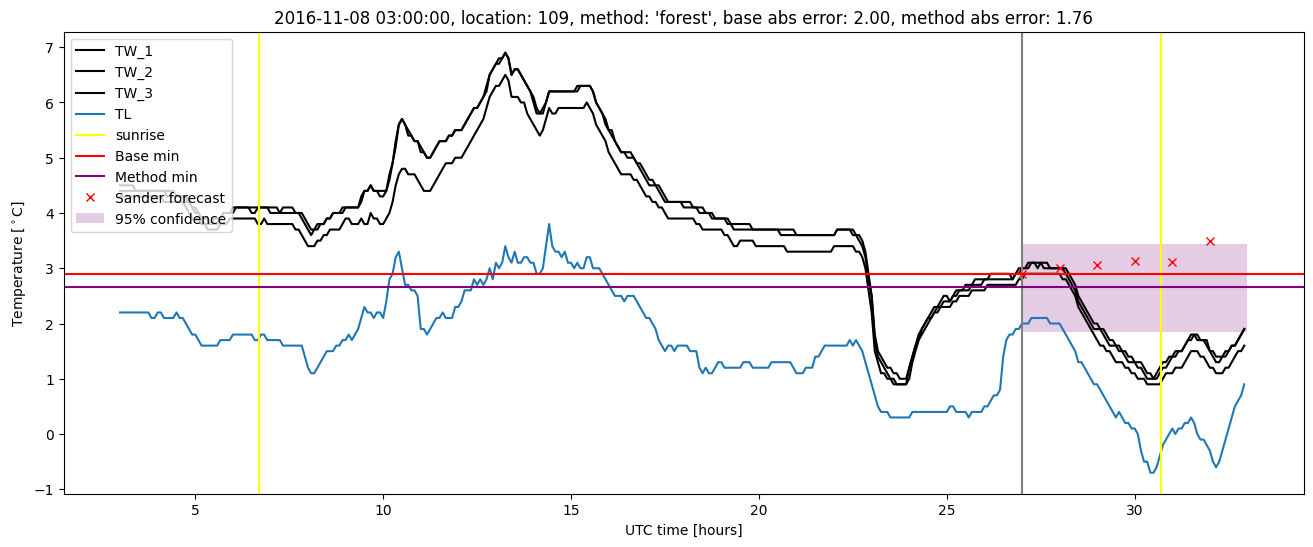
| forest |
winter 2019 |
1.000 |
0.067 |
0.258 |
0.385 |
1.385 |
0.434 |
2.779 |
| baseline |
all |
0.982 |
0.046 |
0.360 |
0.439 |
2.602 |
NaN |
NaN |
| forest |
all |
0.993 |
0.056 |
0.267 |
0.374 |
2.470 |
0.447 |
3.237 |
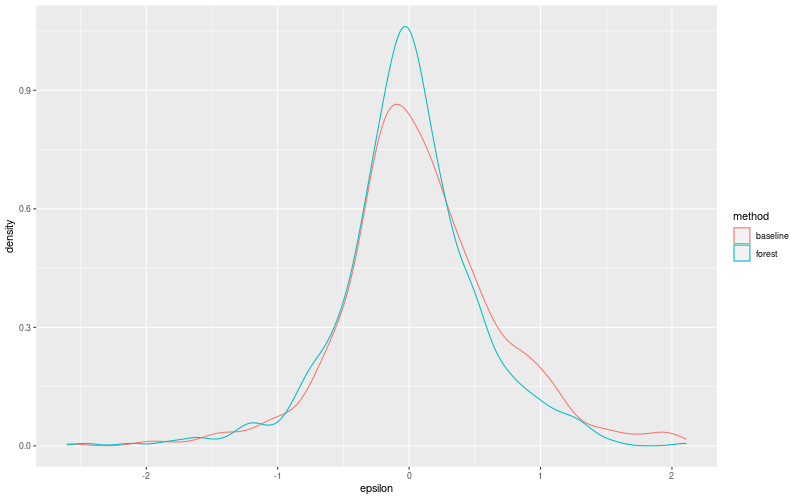
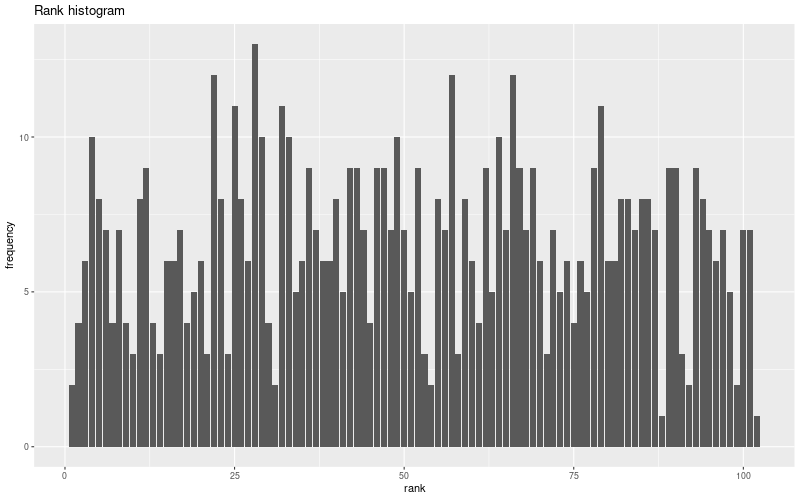
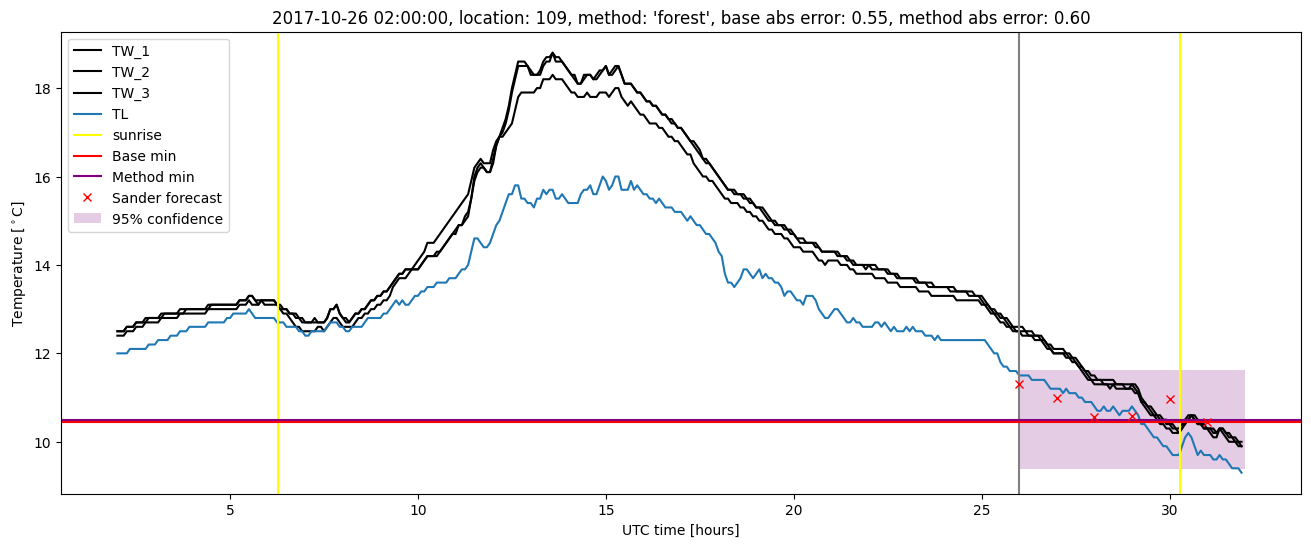
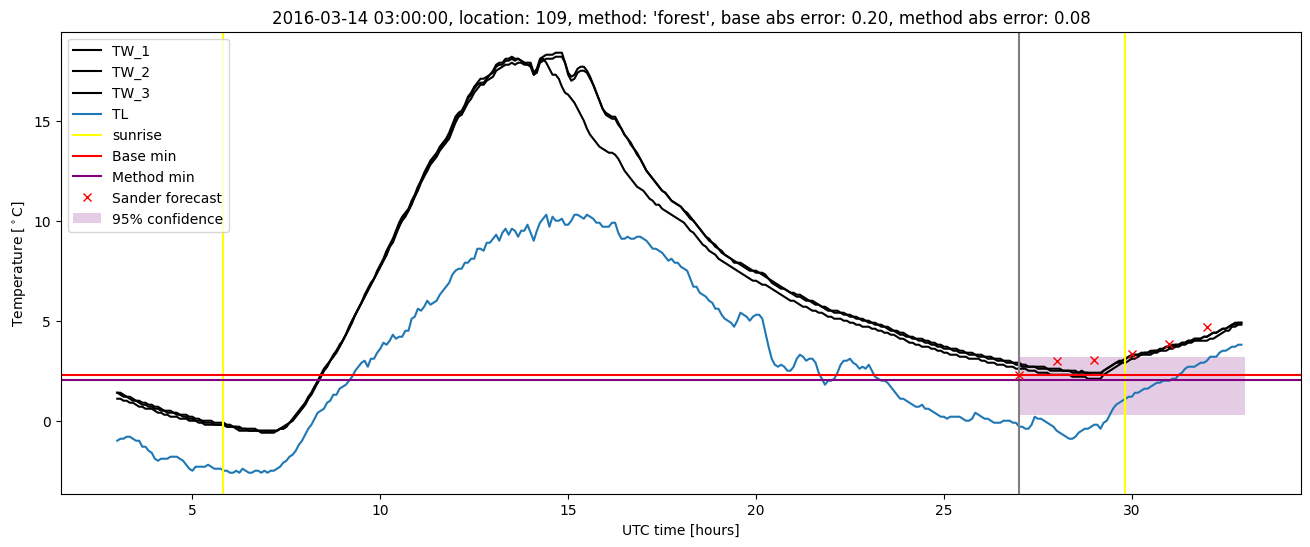
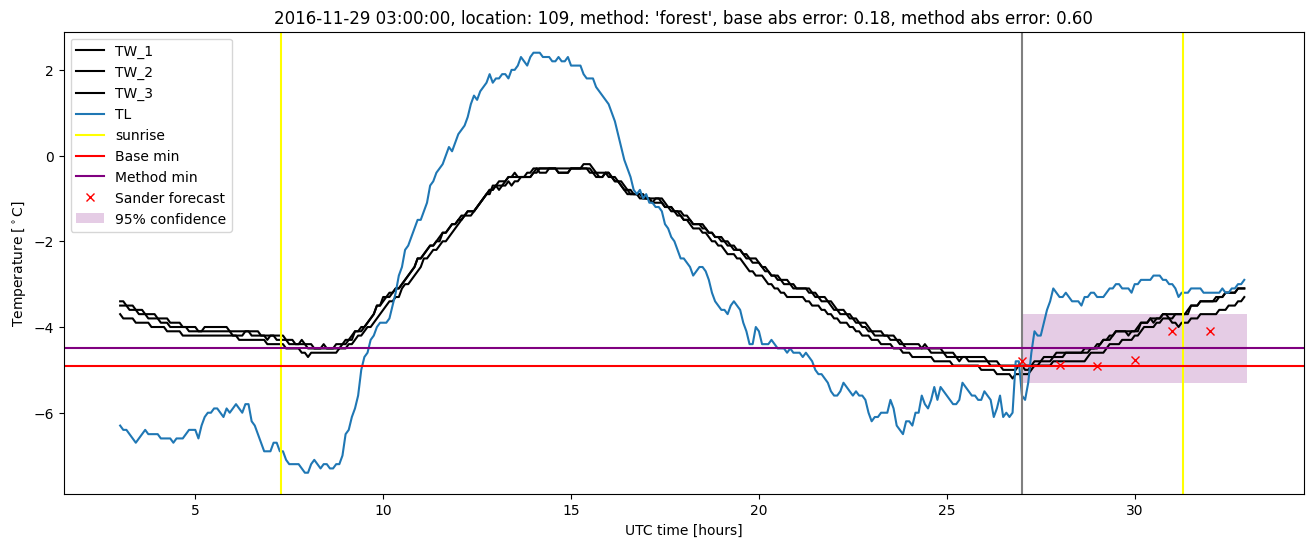
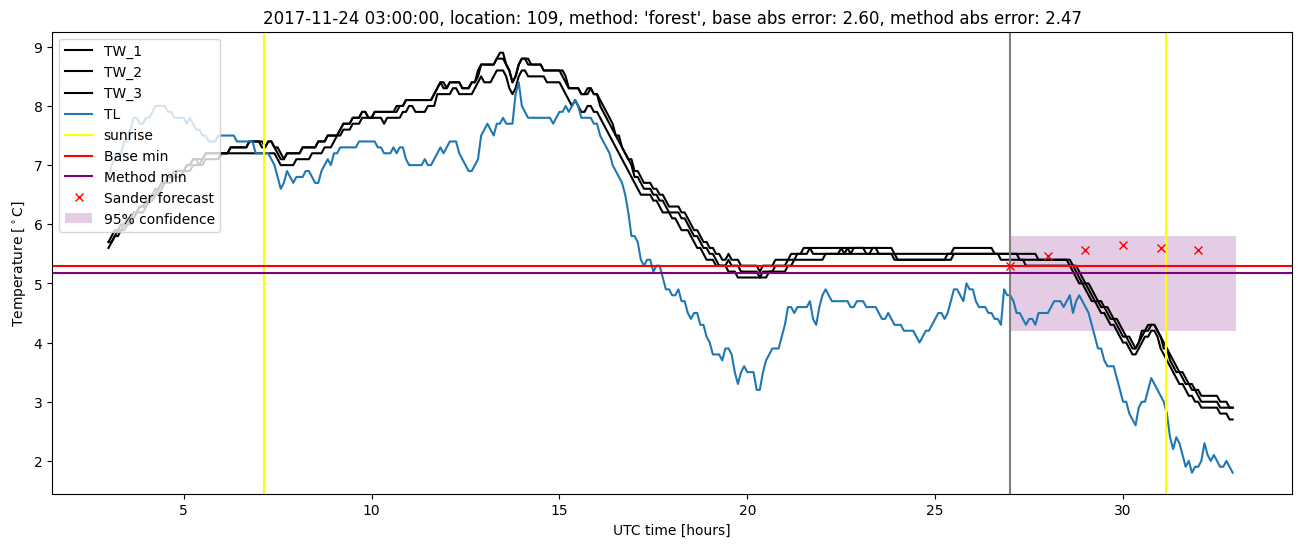
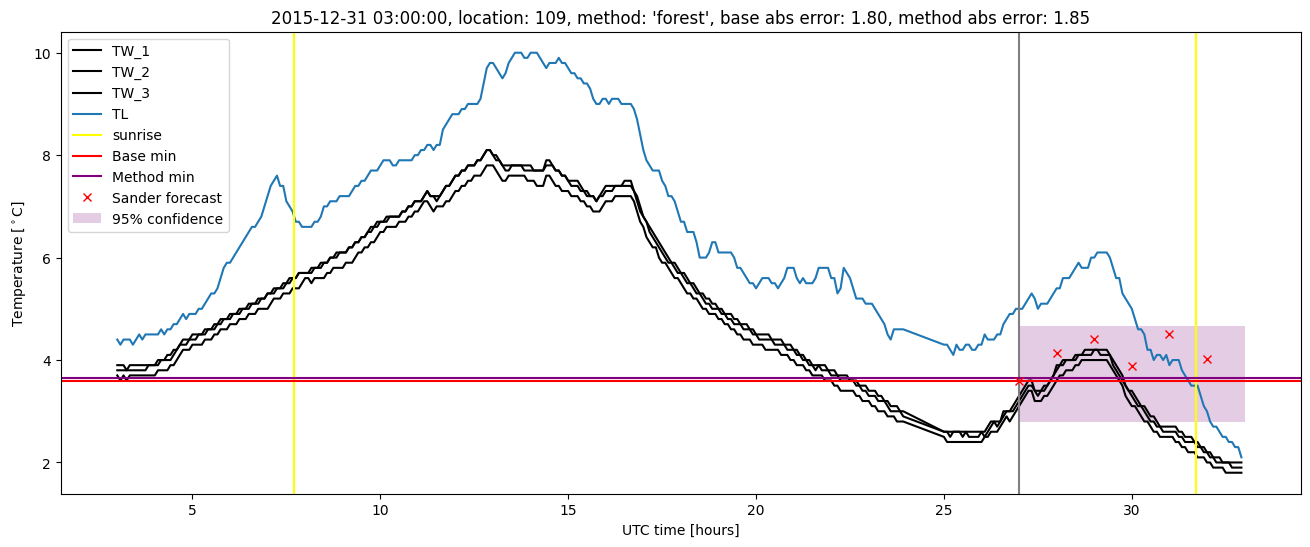
Random forest plots
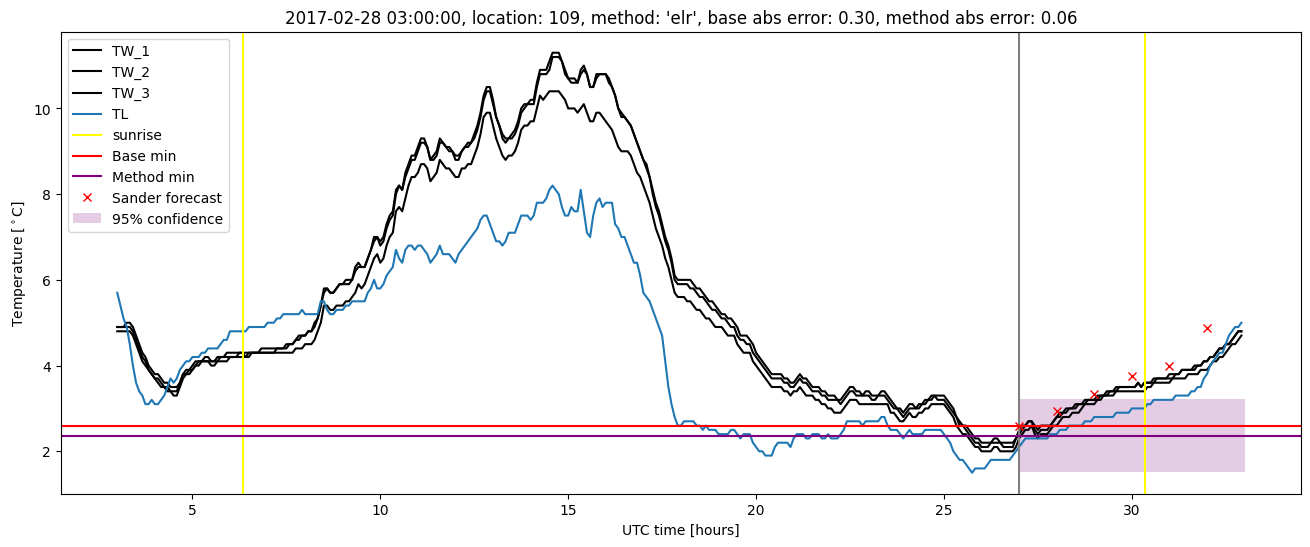
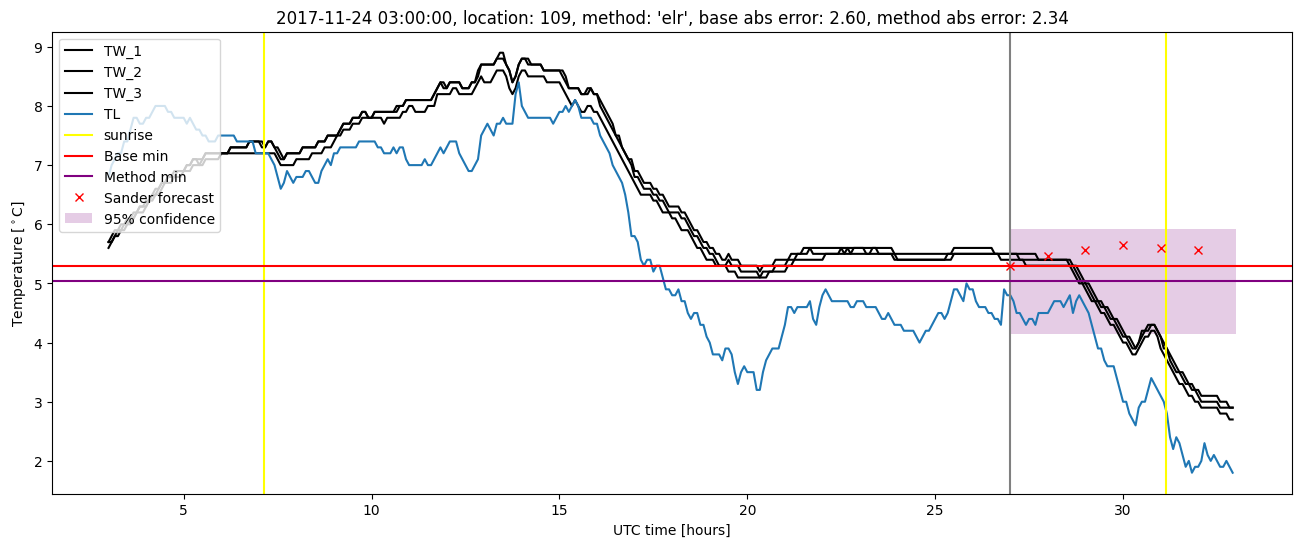
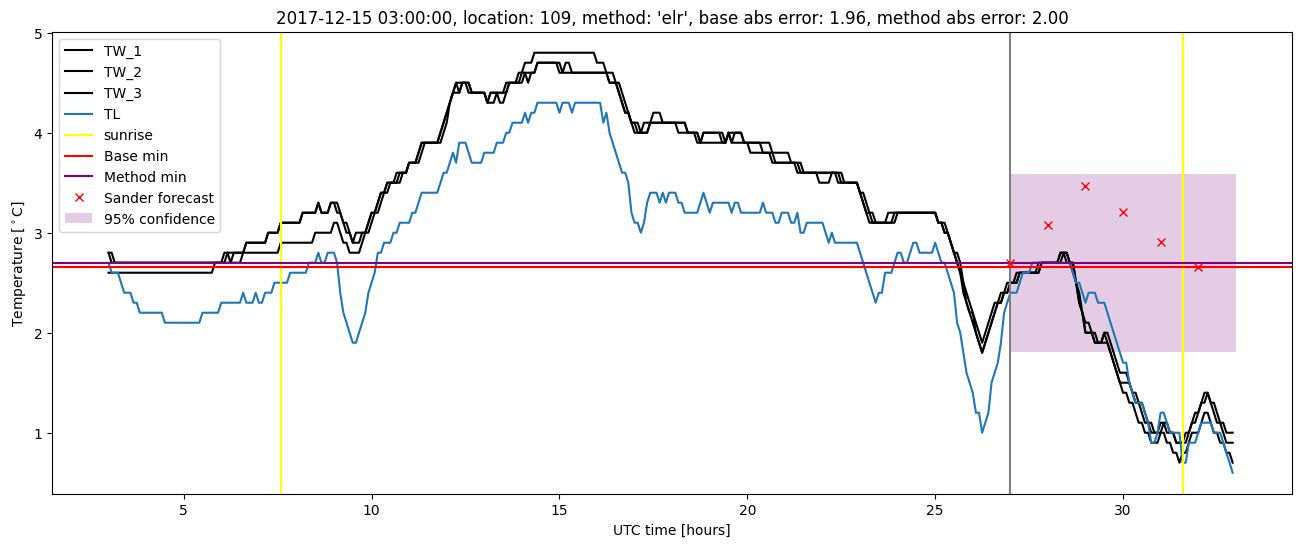
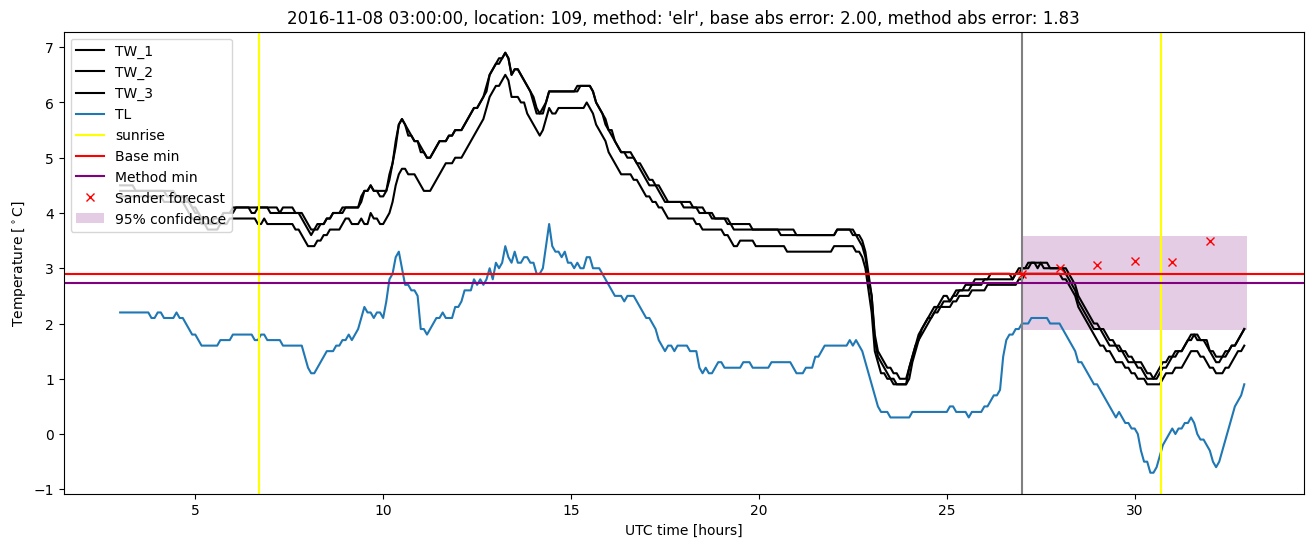
Extended logistic regression results
| names |
period |
power |
significance |
meanSquareError |
absError |
maxError |
CRPS |
IGN |
| baseline |
winter 2016 |
0.982 |
0.042 |
0.293 |
0.400 |
2.072 |
NaN |
NaN |
| elr |
winter 2016 |
0.982 |
0.042 |
0.266 |
0.388 |
1.782 |
0.506 |
3.824 |
| baseline |
winter 2017 |
0.982 |
0.023 |
0.466 |
0.494 |
2.007 |
NaN |
NaN |
| elr |
winter 2017 |
0.973 |
0.023 |
0.386 |
0.447 |
1.831 |
0.492 |
4.066 |
| baseline |
winter 2018 |
0.987 |
0.077 |
0.333 |
0.428 |
2.602 |
NaN |
NaN |
| elr |
winter 2018 |
0.980 |
0.038 |
0.265 |
0.375 |
2.337 |
0.506 |
3.627 |
| baseline |
winter 2019 |
0.979 |
0.067 |
0.368 |
0.444 |
1.968 |
NaN |
NaN |
| elr |
winter 2019 |
1.000 |
0.067 |
0.323 |
0.446 |
1.690 |
0.478 |
3.608 |
| baseline |
all |
0.982 |
0.046 |
0.360 |
0.439 |
2.602 |
NaN |
NaN |
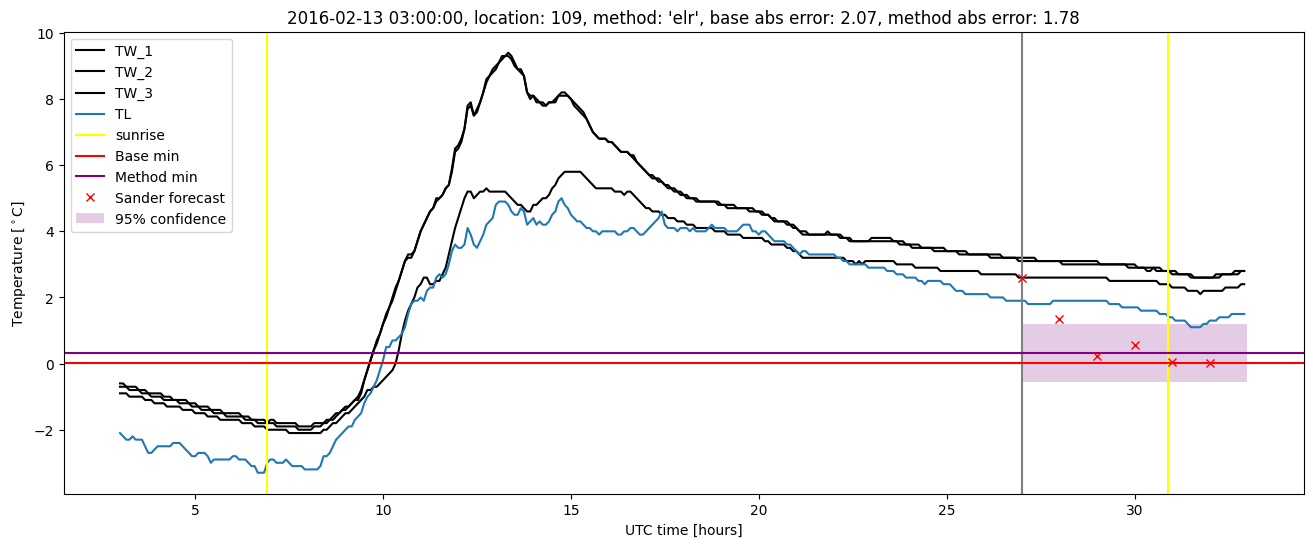
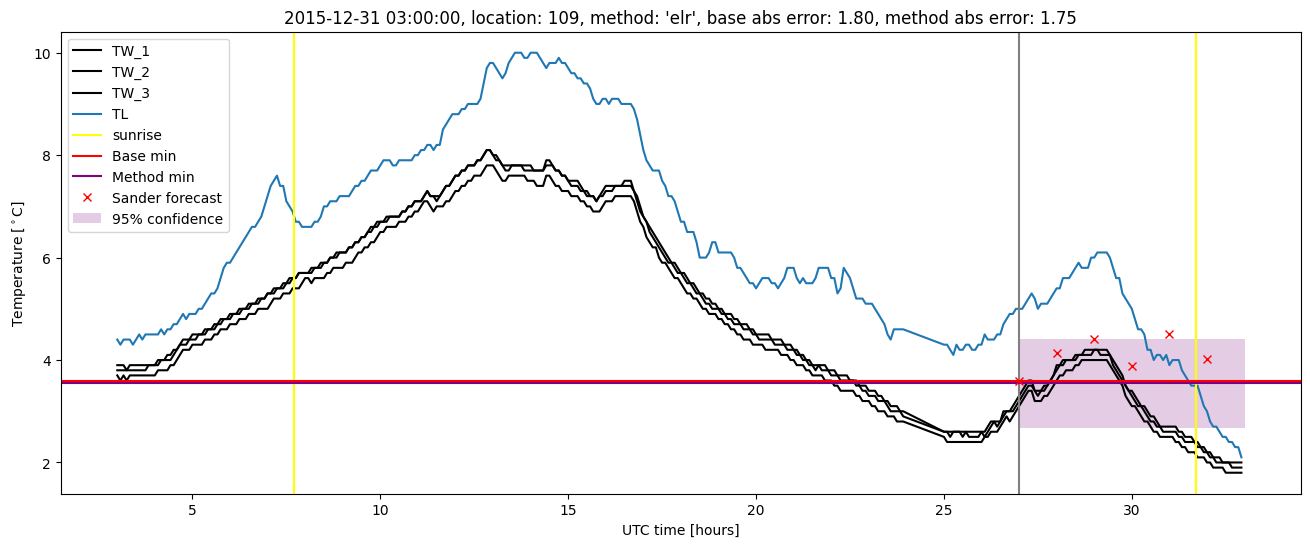
| elr |
all |
0.984 |
0.037 |
0.306 |
0.411 |
2.337 |
0.496 |
3.777 |
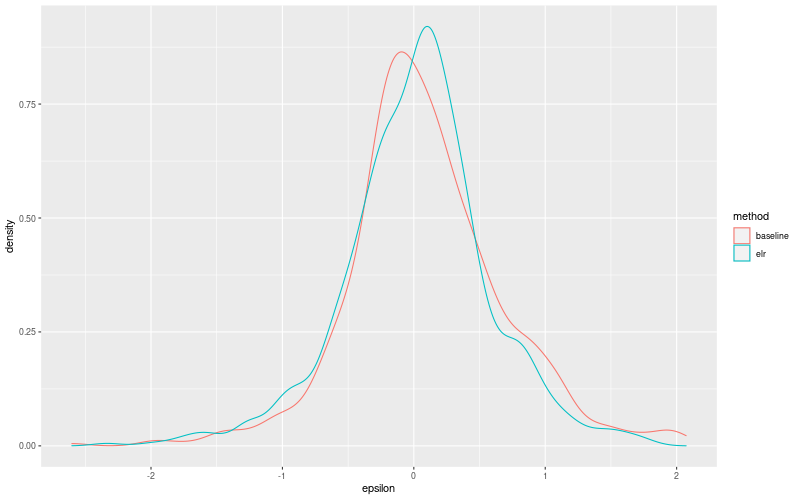
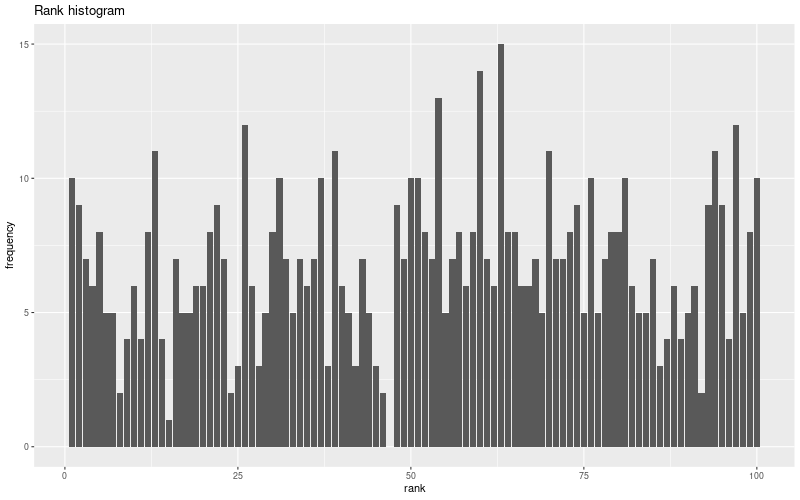
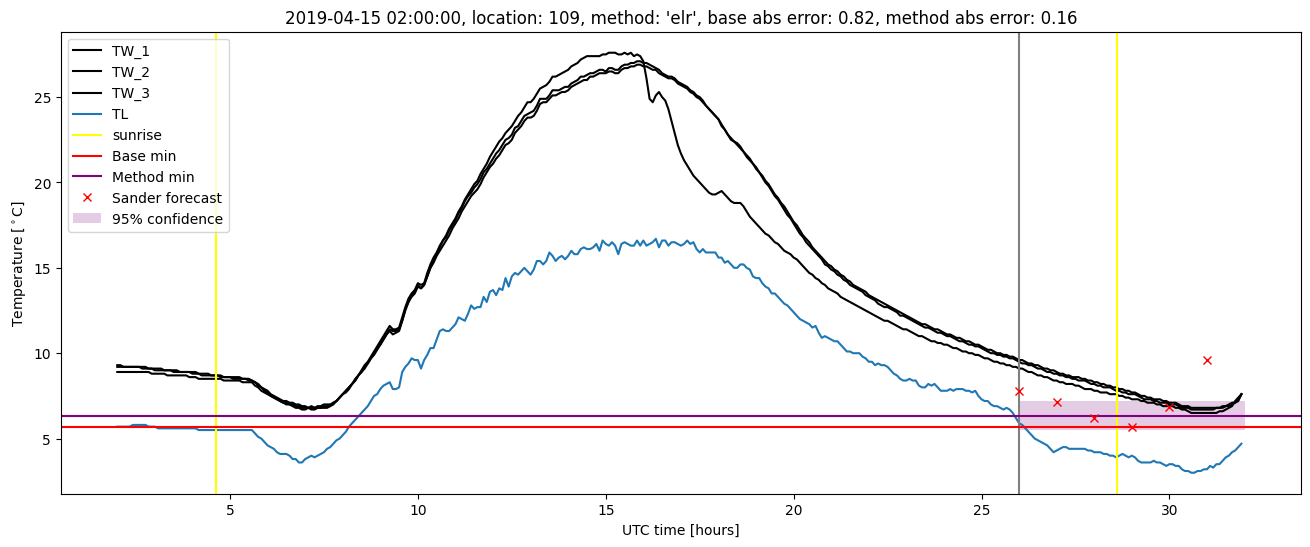
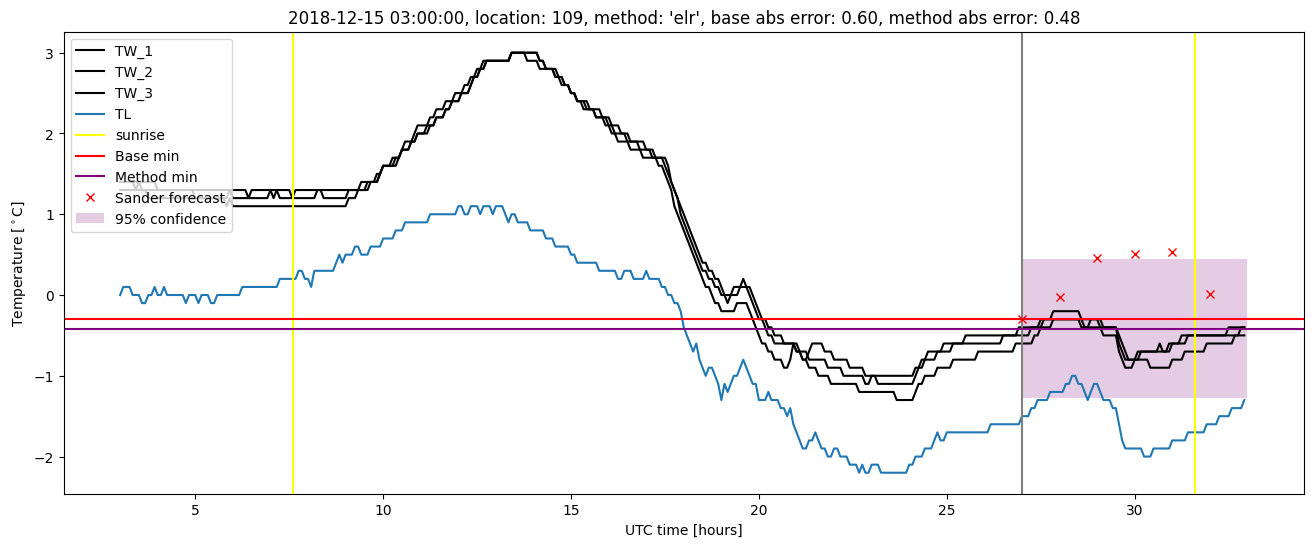
Extended logistic regression plots