GMS location: 107
Random forest results
| names |
period |
power |
significance |
meanSquareError |
absError |
maxError |
CRPS |
IGN |
| baseline |
winter 2016 |
0.978 |
0.154 |
0.441 |
0.475 |
2.691 |
NaN |
NaN |
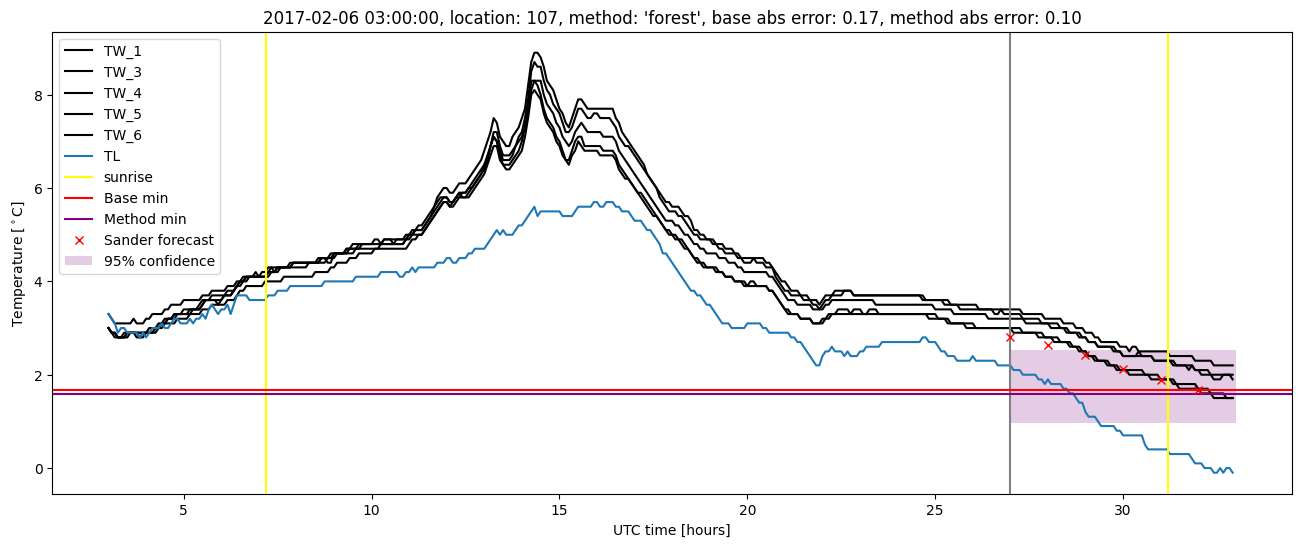
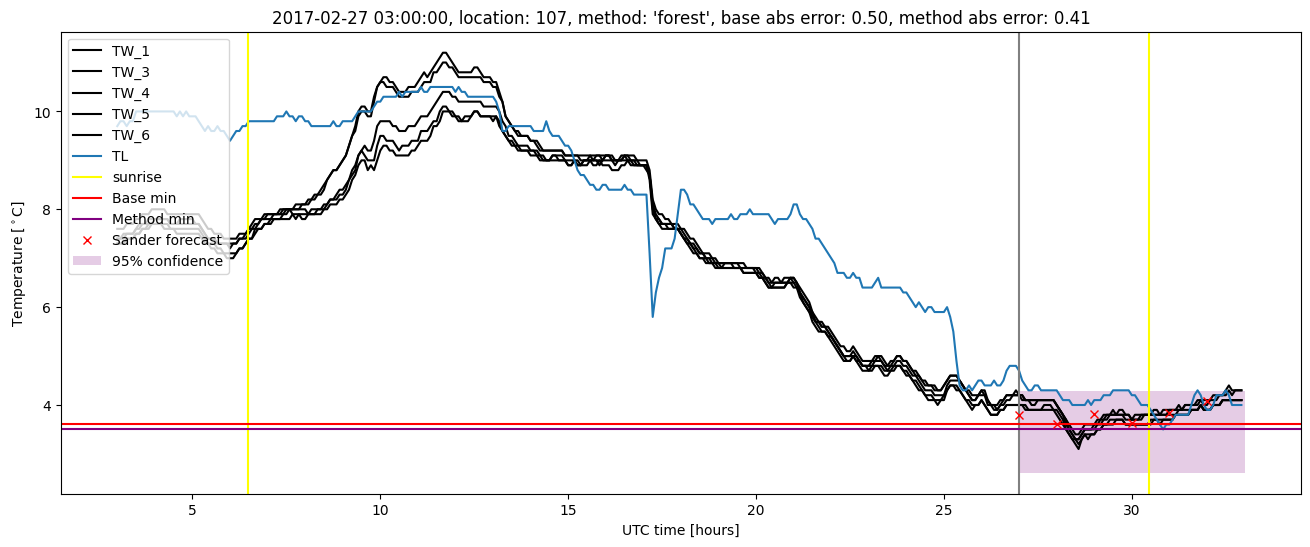
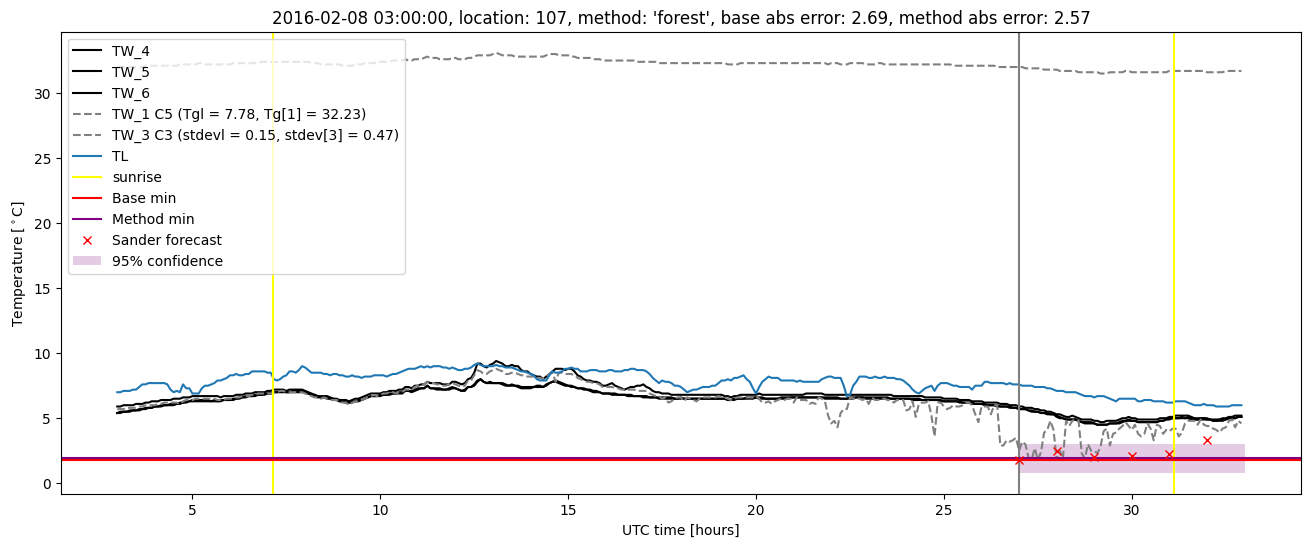
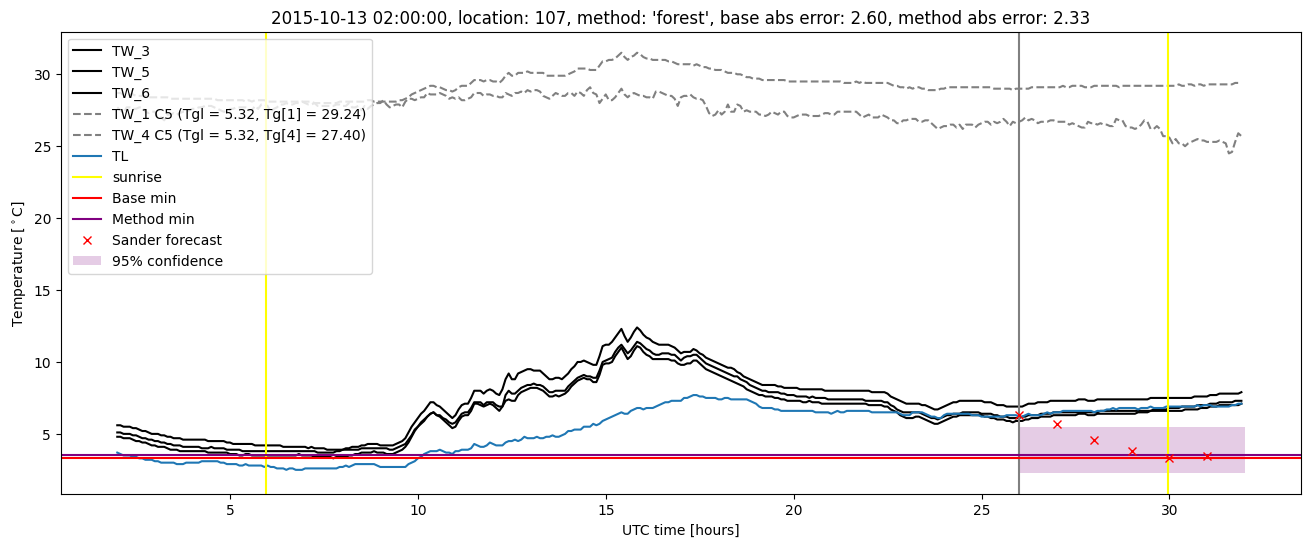
| forest |
winter 2016 |
0.983 |
0.115 |
0.347 |
0.402 |
2.570 |
0.464 |
4.734 |
| baseline |
winter 2017 |
0.970 |
0.061 |
0.545 |
0.505 |
3.358 |
NaN |
NaN |
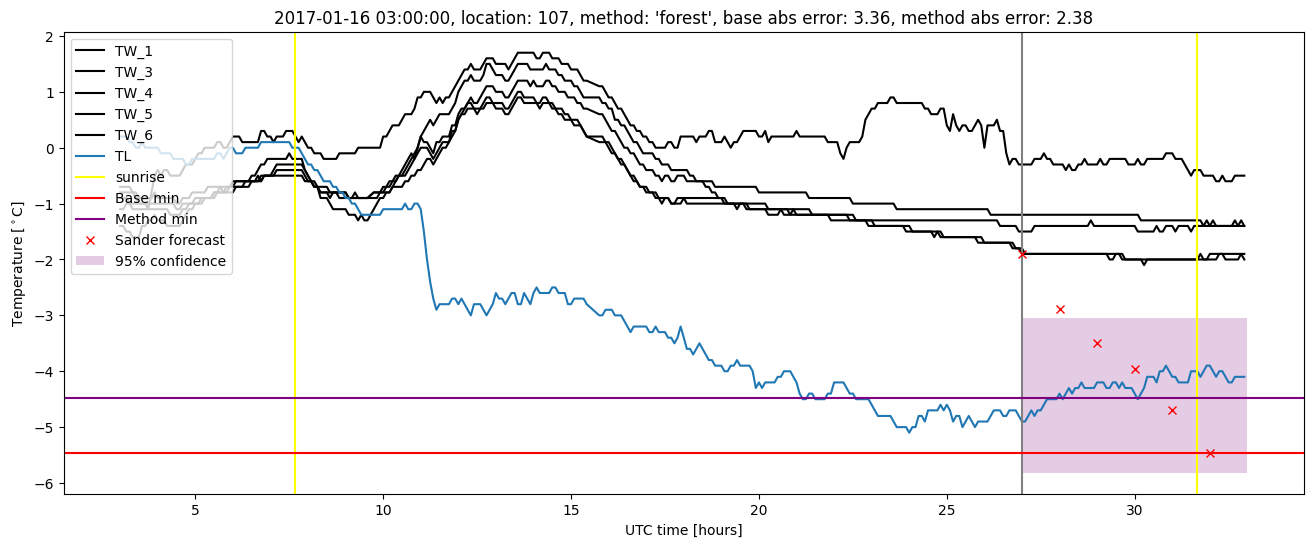
| forest |
winter 2017 |
0.980 |
0.061 |
0.343 |
0.415 |
2.380 |
0.458 |
4.088 |
| baseline |
winter 2018 |
0.984 |
0.091 |
0.407 |
0.456 |
2.418 |
NaN |
NaN |
| forest |
winter 2018 |
0.984 |
0.061 |
0.302 |
0.398 |
1.997 |
0.455 |
3.902 |
| baseline |
winter 2019 |
1.000 |
0.000e+00 |
0.266 |
0.374 |
1.823 |
NaN |
NaN |
| forest |
winter 2019 |
1.000 |
0.000e+00 |
0.219 |
0.347 |
1.839 |
0.463 |
3.078 |
| baseline |
all |
0.984 |
0.086 |
0.408 |
0.450 |
3.358 |
NaN |
NaN |
| forest |
all |
0.988 |
0.067 |
0.302 |
0.389 |
2.570 |
0.460 |
3.977 |
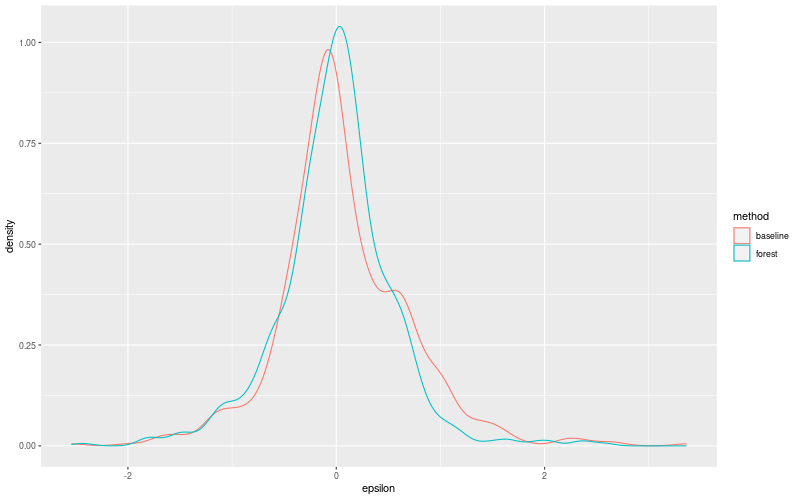
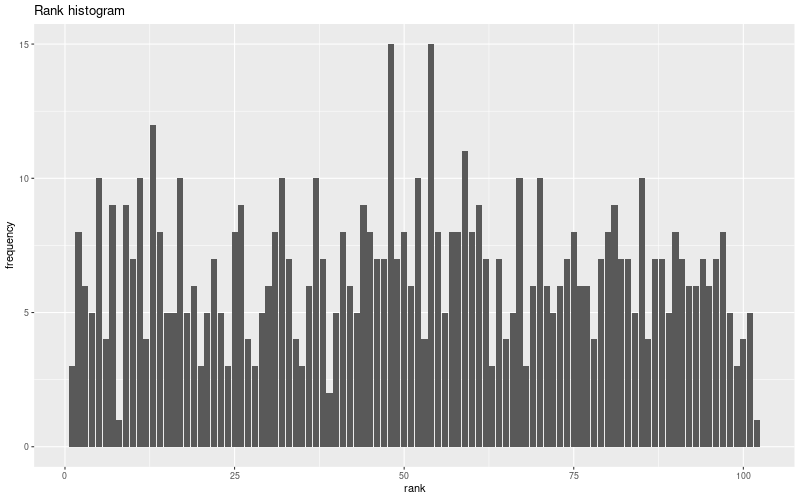
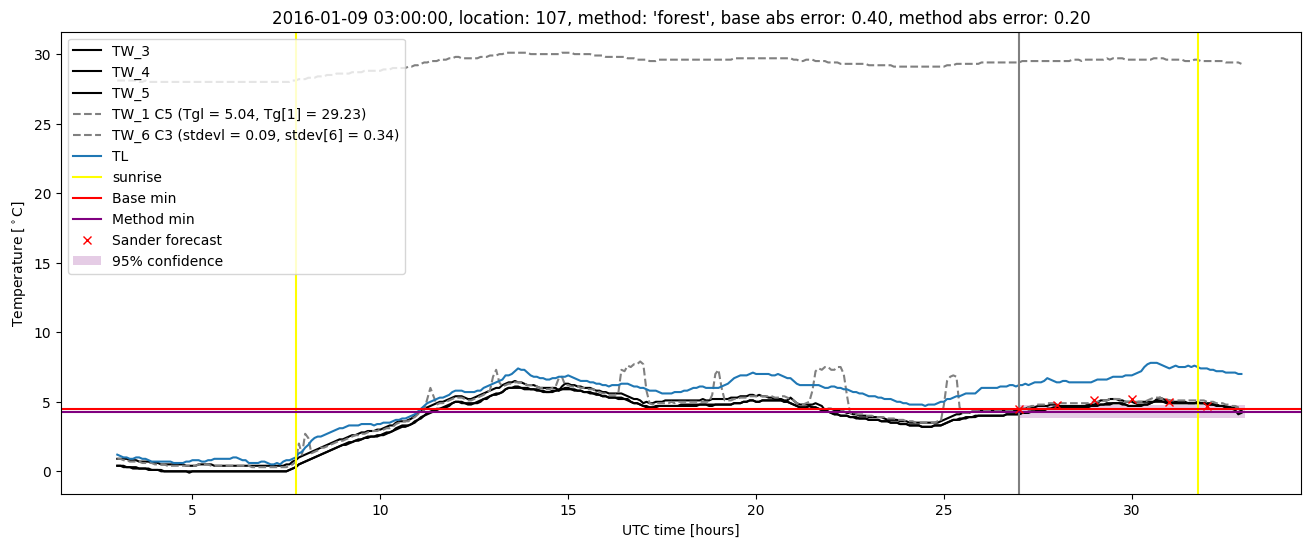
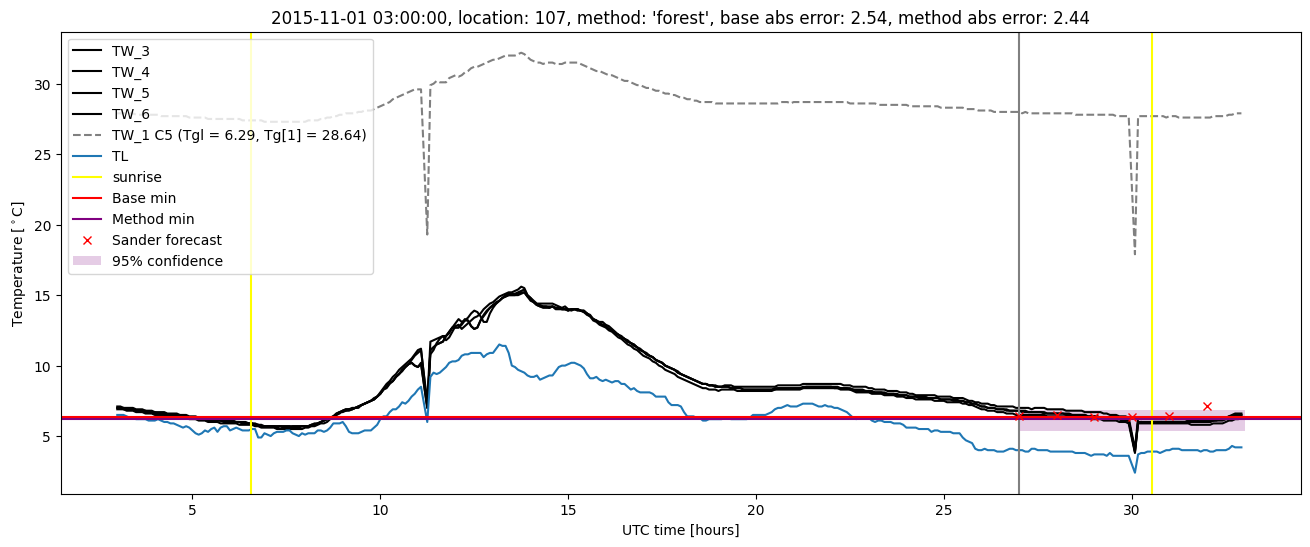
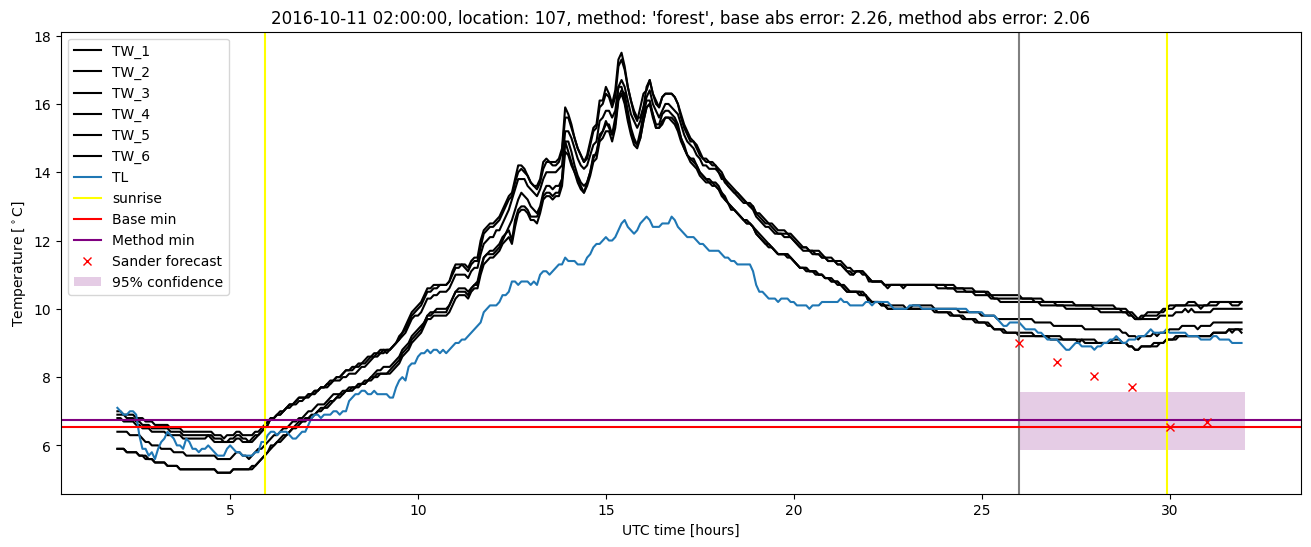
Random forest plots
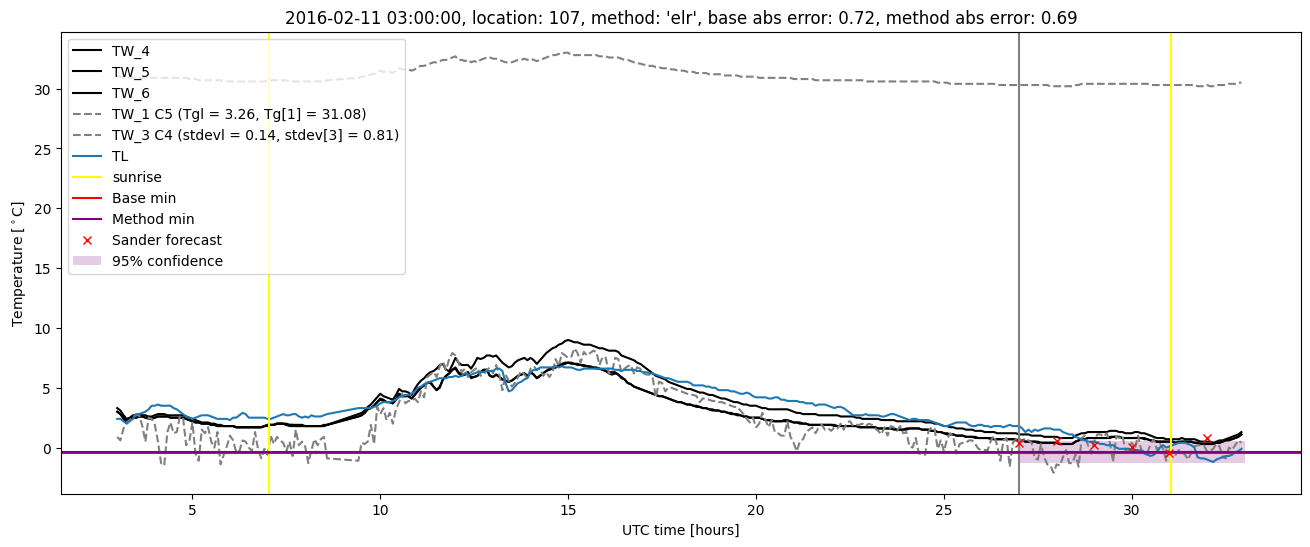
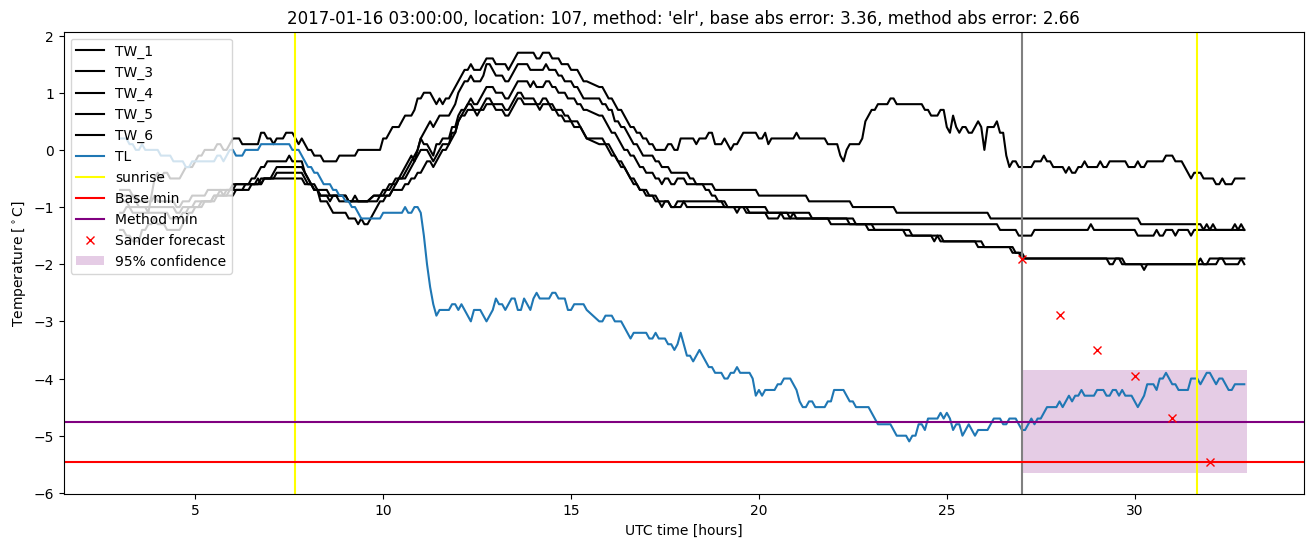
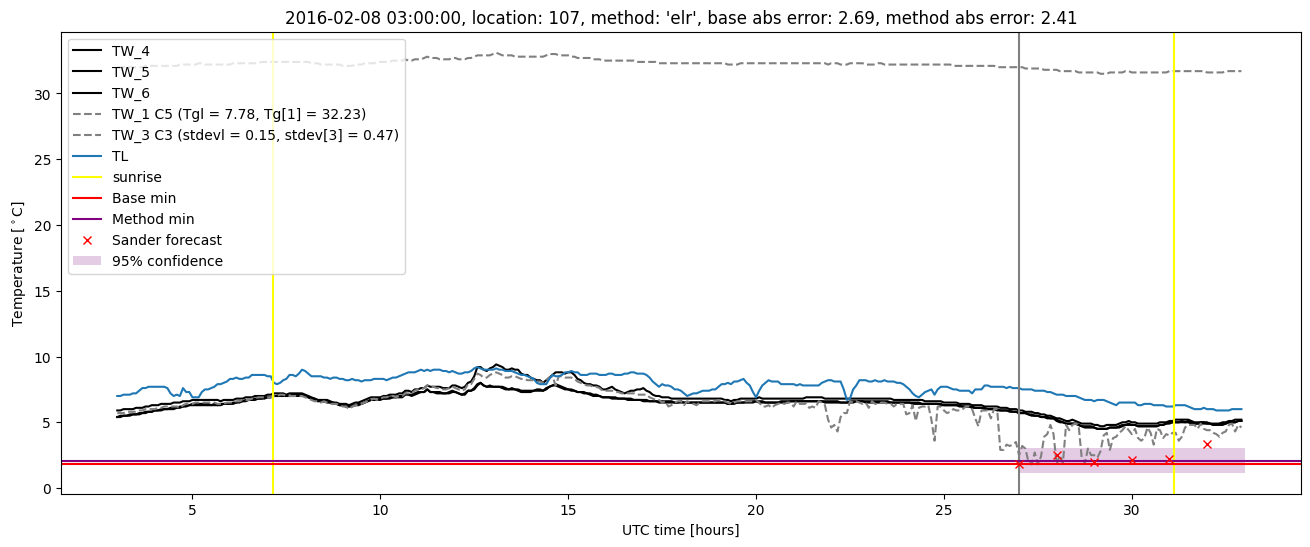
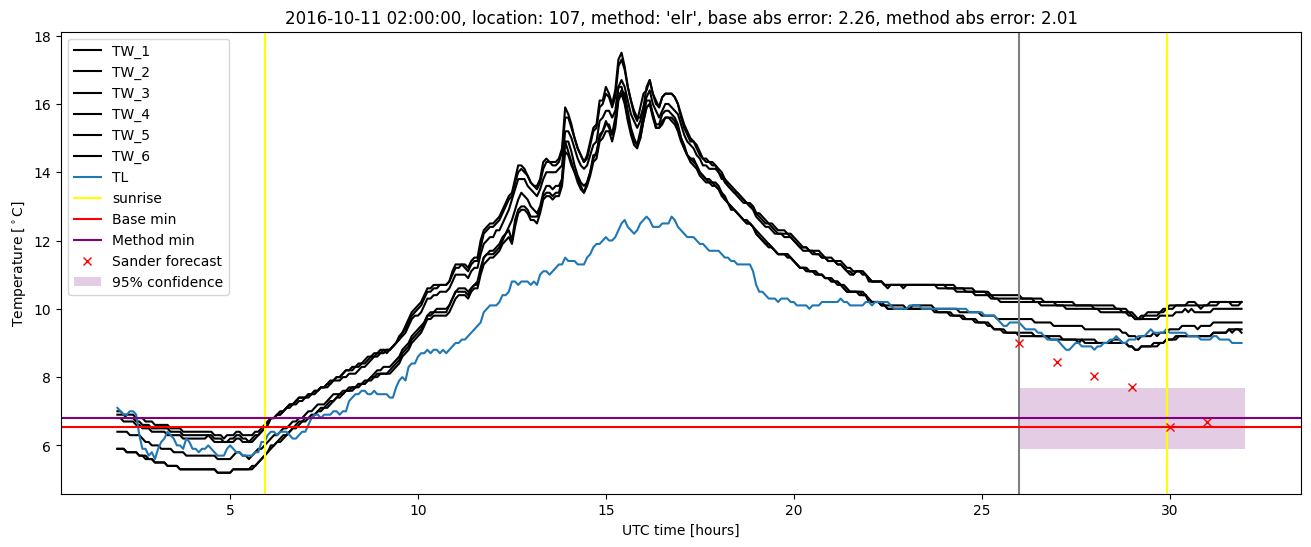
Extended logistic regression results
| names |
period |
power |
significance |
meanSquareError |
absError |
maxError |
CRPS |
IGN |
| baseline |
winter 2016 |
0.978 |
0.154 |
0.441 |
0.475 |
2.691 |
NaN |
NaN |
| elr |
winter 2016 |
0.989 |
0.154 |
0.355 |
0.452 |
2.415 |
0.569 |
4.004 |
| baseline |
winter 2017 |
0.970 |
0.061 |
0.545 |
0.505 |
3.358 |
NaN |
NaN |
| elr |
winter 2017 |
0.970 |
0.091 |
0.372 |
0.433 |
2.659 |
0.501 |
3.474 |
| baseline |
winter 2018 |
0.984 |
0.091 |
0.407 |
0.456 |
2.418 |
NaN |
NaN |
| elr |
winter 2018 |
0.992 |
0.121 |
0.313 |
0.430 |
1.880 |
0.549 |
4.068 |
| baseline |
winter 2019 |
1.000 |
0.000e+00 |
0.266 |
0.374 |
1.823 |
NaN |
NaN |
| elr |
winter 2019 |
1.000 |
0.000e+00 |
0.250 |
0.403 |
1.490 |
0.526 |
3.152 |
| baseline |
all |
0.984 |
0.086 |
0.408 |
0.450 |
3.358 |
NaN |
NaN |
| elr |
all |
0.989 |
0.106 |
0.321 |
0.430 |
2.659 |
0.539 |
3.692 |
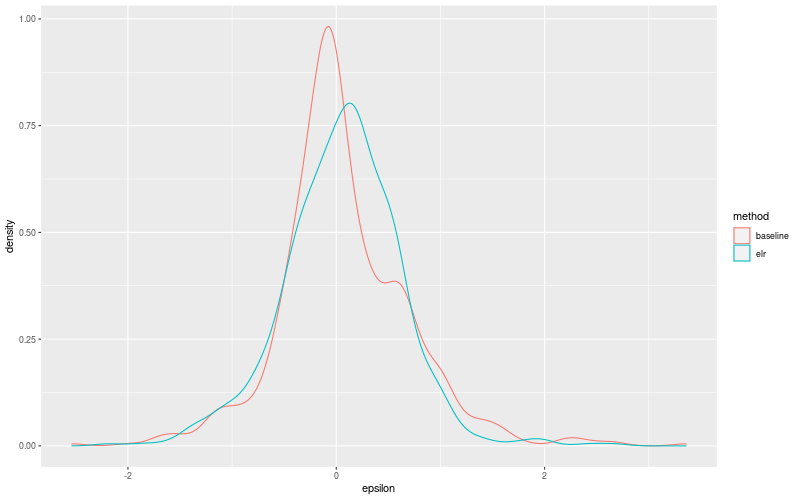
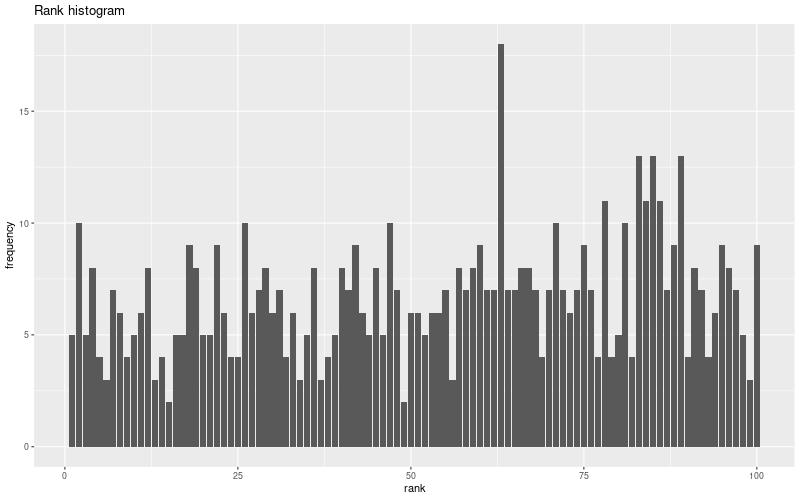
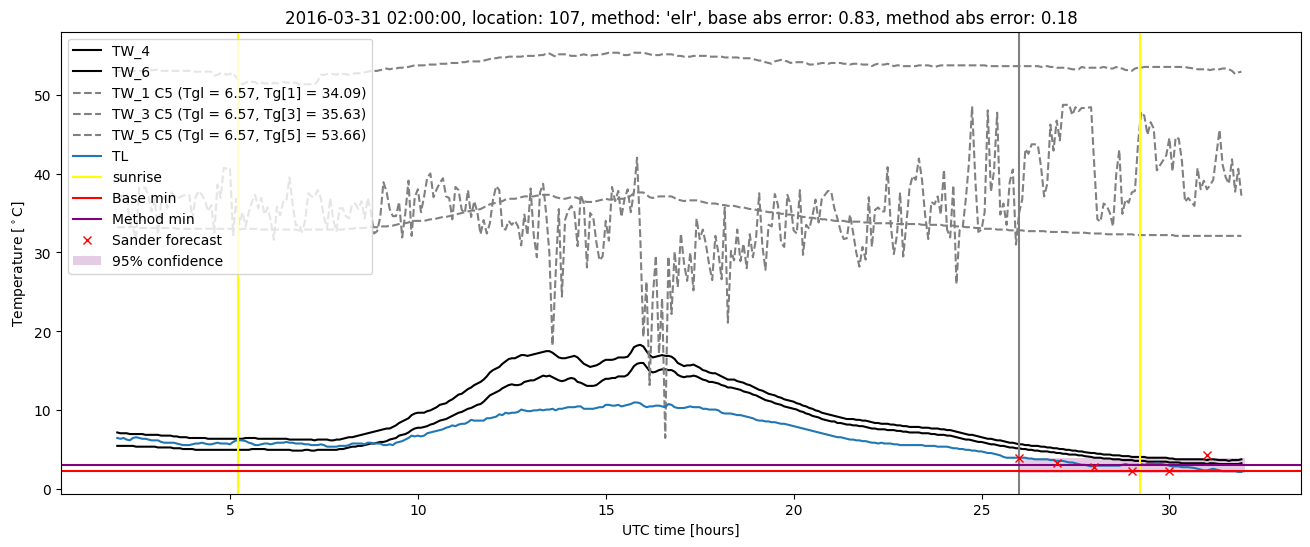
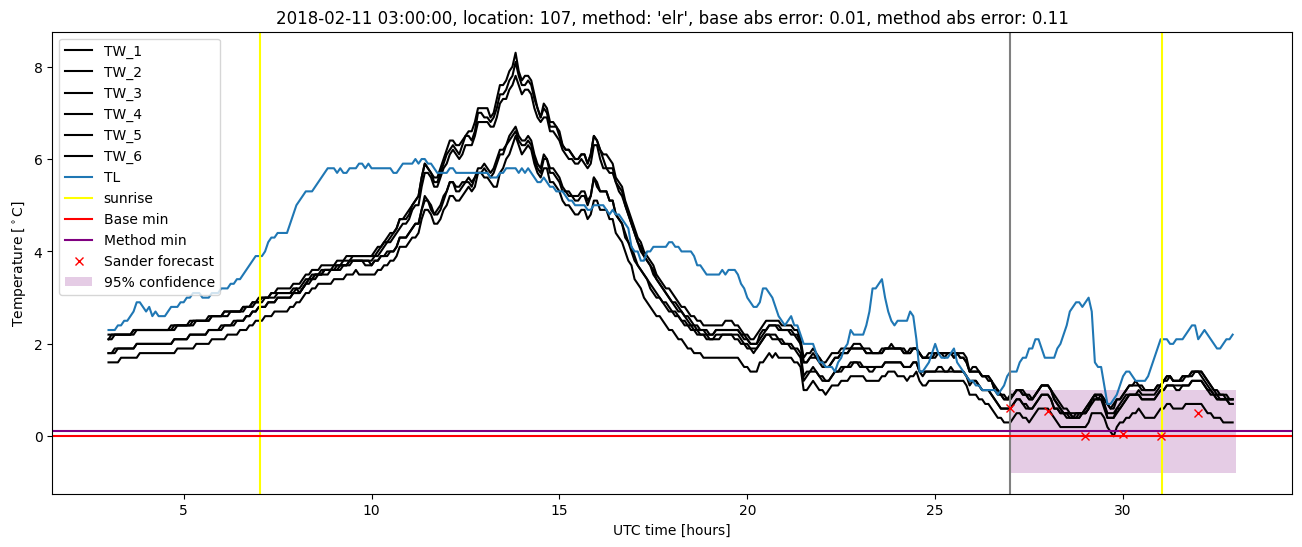
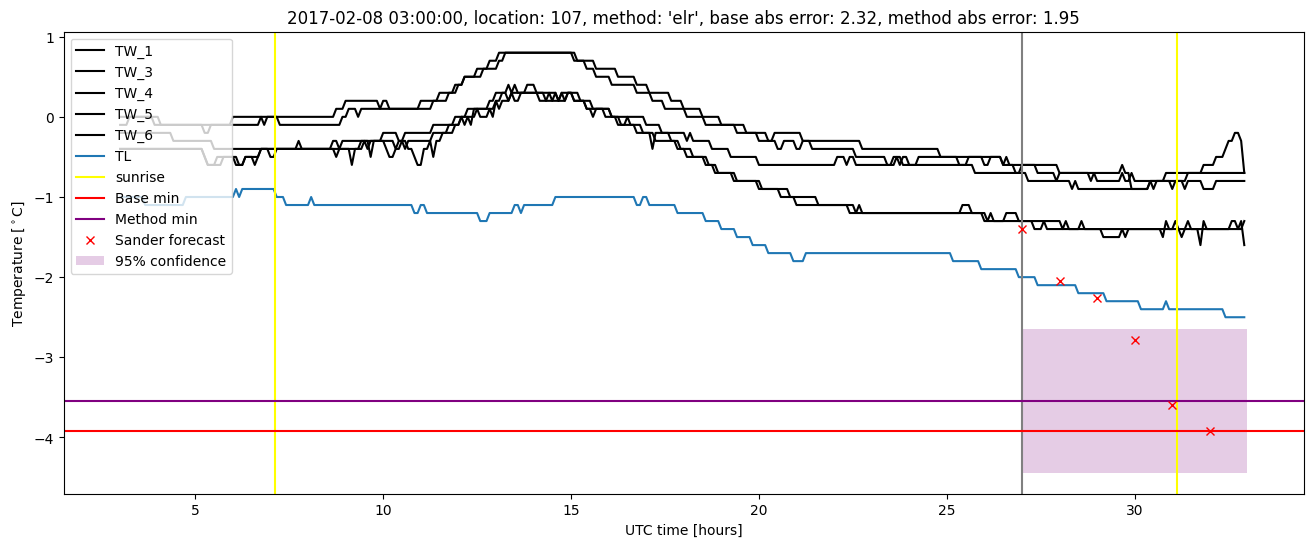
Extended logistic regression plots