GMS location: 106
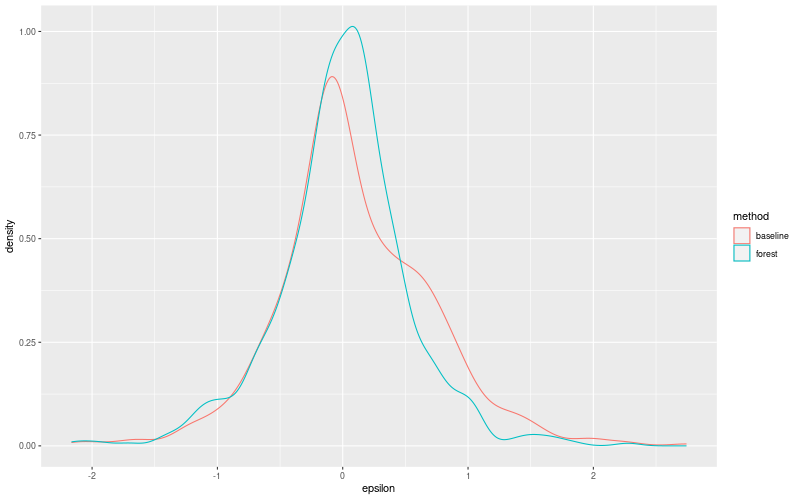
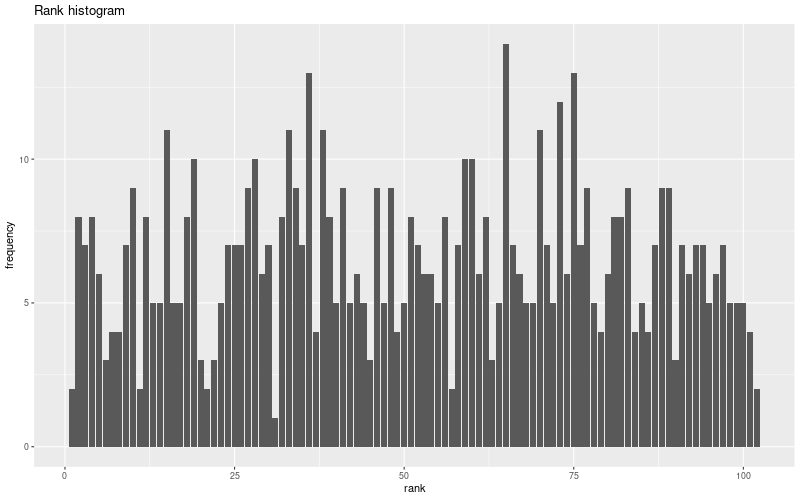
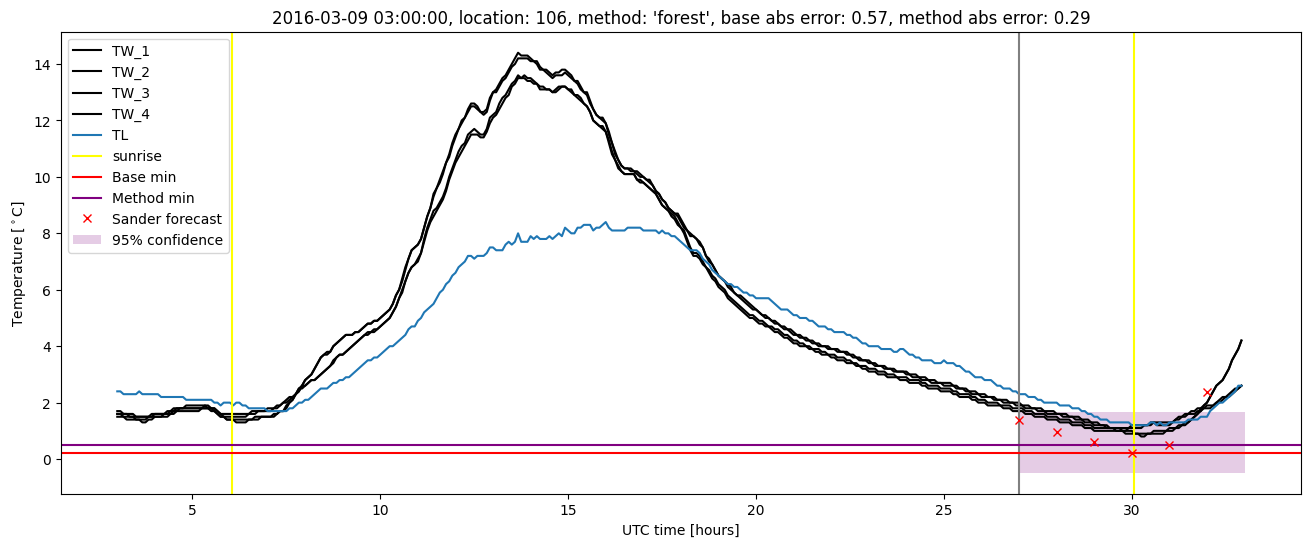
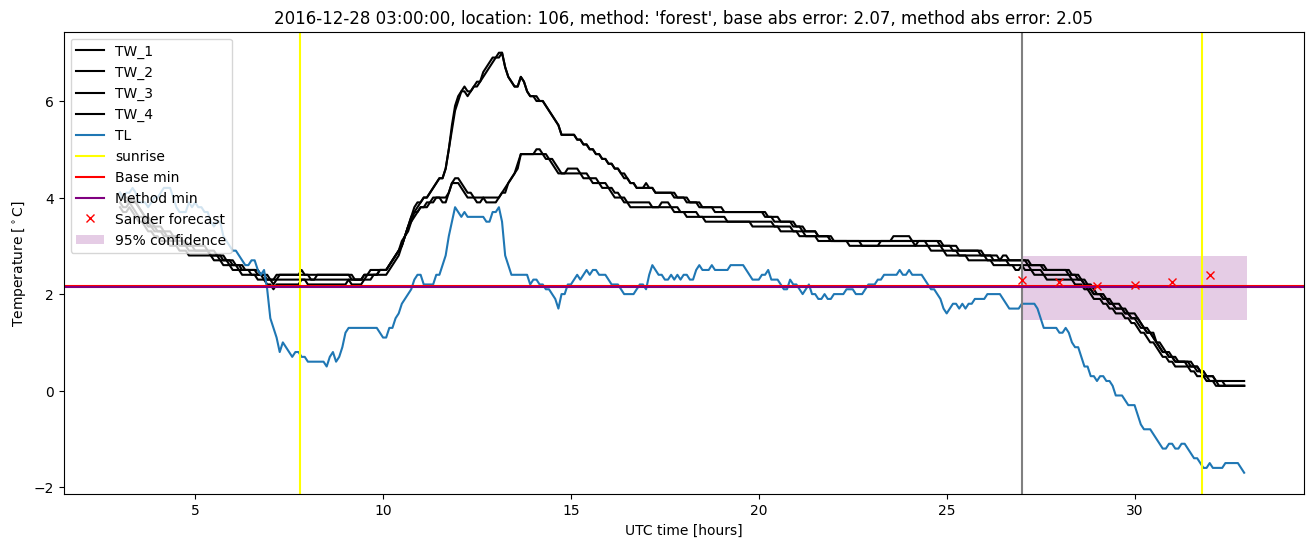
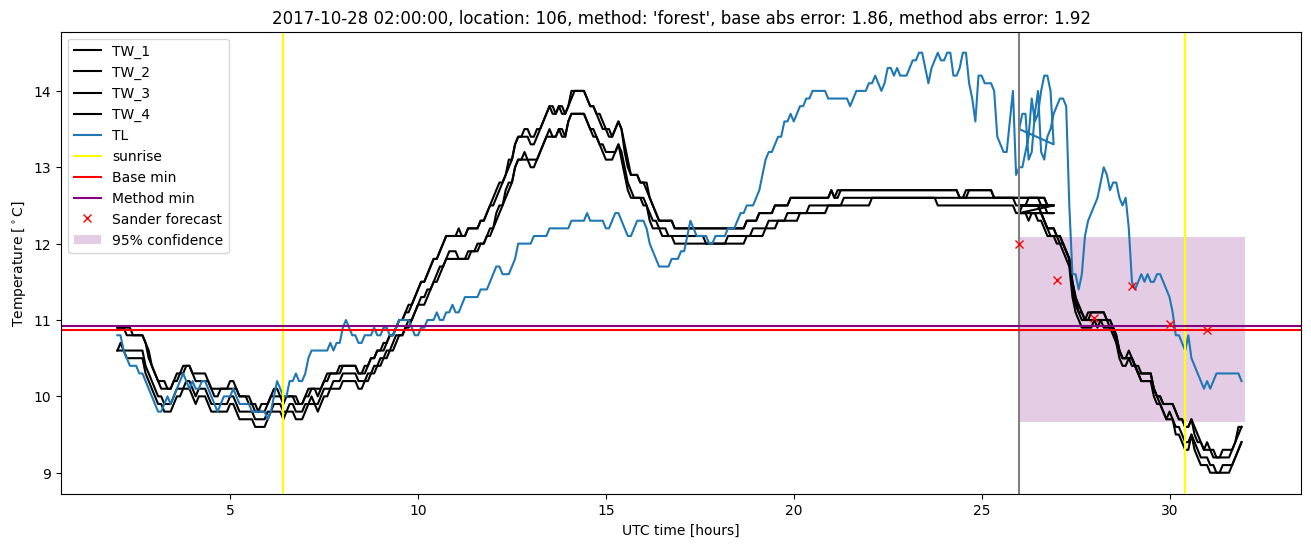
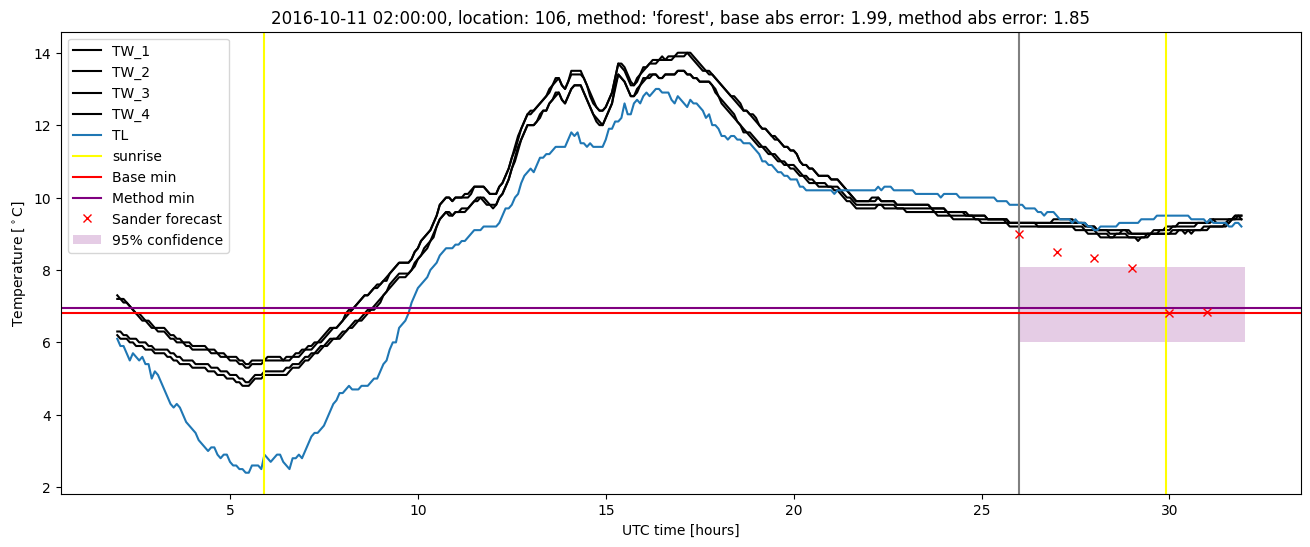
Random forest results
| names |
period |
power |
significance |
meanSquareError |
absError |
maxError |
CRPS |
IGN |
| baseline |
winter 2016 |
0.994 |
0.042 |
0.377 |
0.442 |
2.287 |
NaN |
NaN |
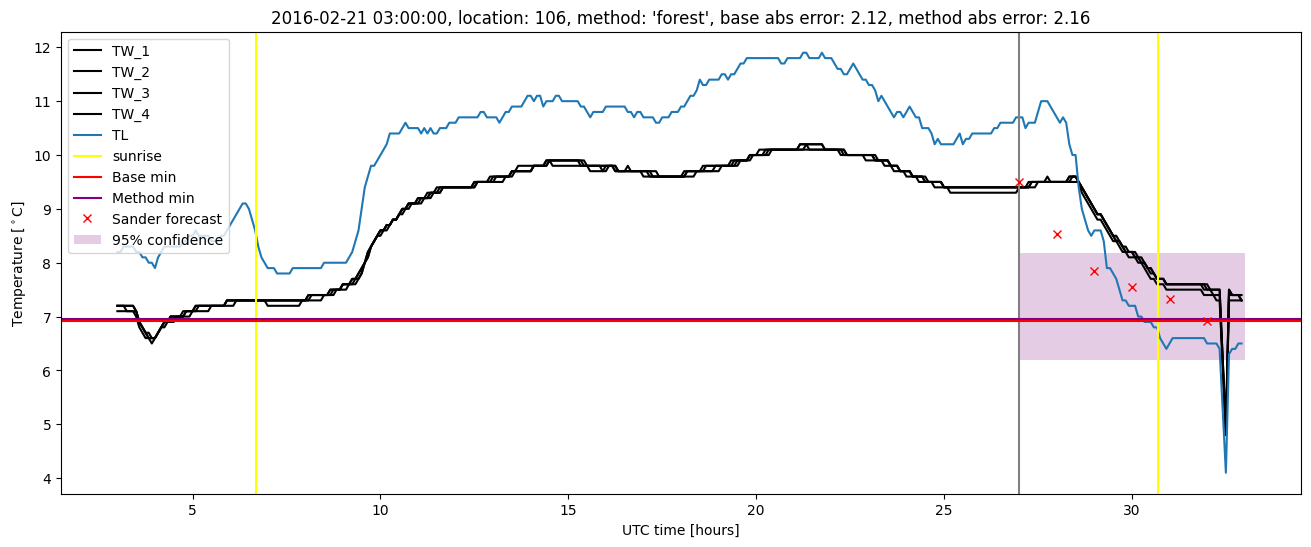
| forest |
winter 2016 |
0.989 |
0.000e+00 |
0.264 |
0.375 |
2.161 |
0.472 |
4.304 |
| baseline |
winter 2017 |
0.979 |
0.097 |
0.523 |
0.535 |
2.740 |
NaN |
NaN |
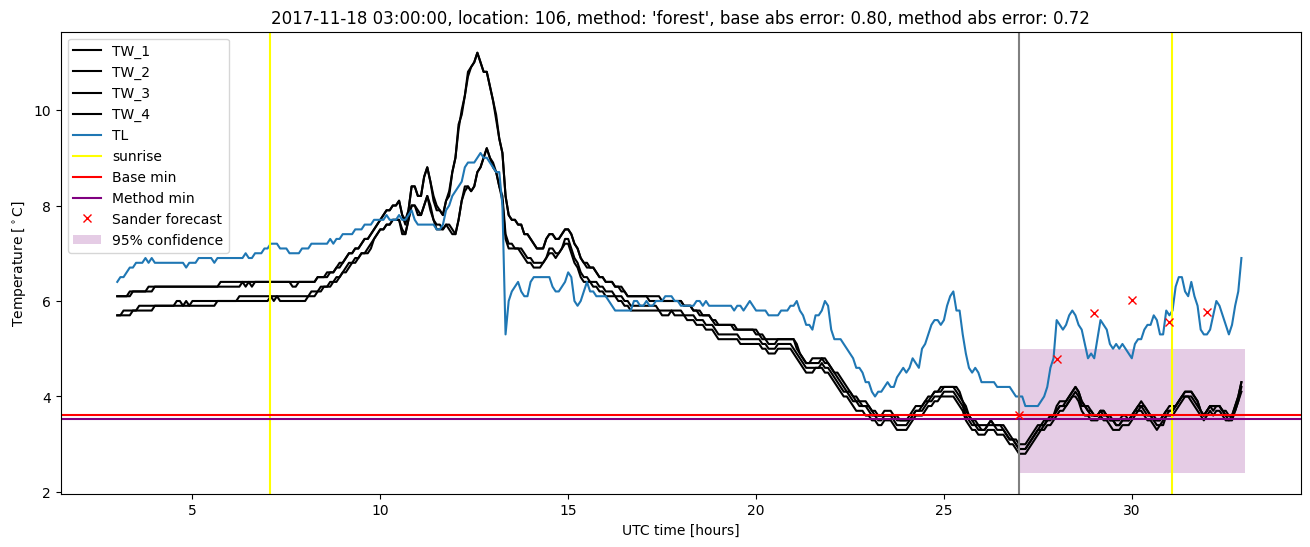
| forest |
winter 2017 |
0.989 |
0.065 |
0.336 |
0.418 |
2.049 |
0.459 |
4.169 |
| baseline |
winter 2018 |
0.986 |
0.125 |
0.384 |
0.471 |
1.963 |
NaN |
NaN |
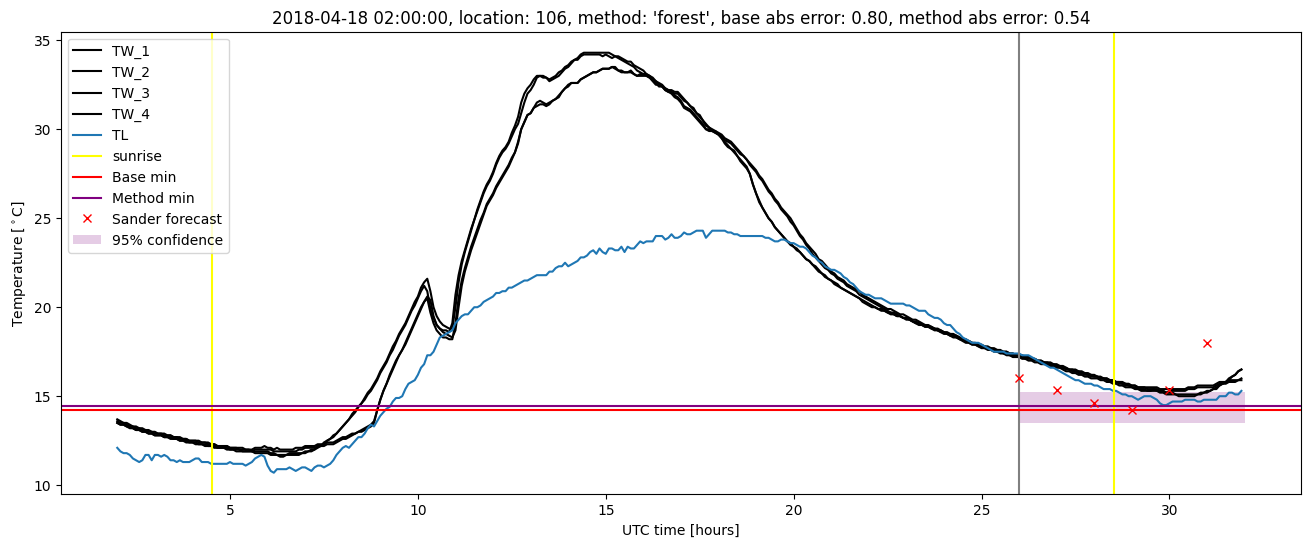
| forest |
winter 2018 |
0.979 |
0.094 |
0.288 |
0.387 |
2.275 |
0.473 |
3.599 |
| baseline |
winter 2019 |
0.993 |
0.000e+00 |
0.285 |
0.404 |
2.203 |
NaN |
NaN |
| forest |
winter 2019 |
0.993 |
0.000e+00 |
0.204 |
0.338 |
1.295 |
0.455 |
2.953 |
| baseline |
all |
0.989 |
0.082 |
0.384 |
0.458 |
2.740 |
NaN |
NaN |
| forest |
all |
0.988 |
0.051 |
0.270 |
0.377 |
2.275 |
0.466 |
3.767 |
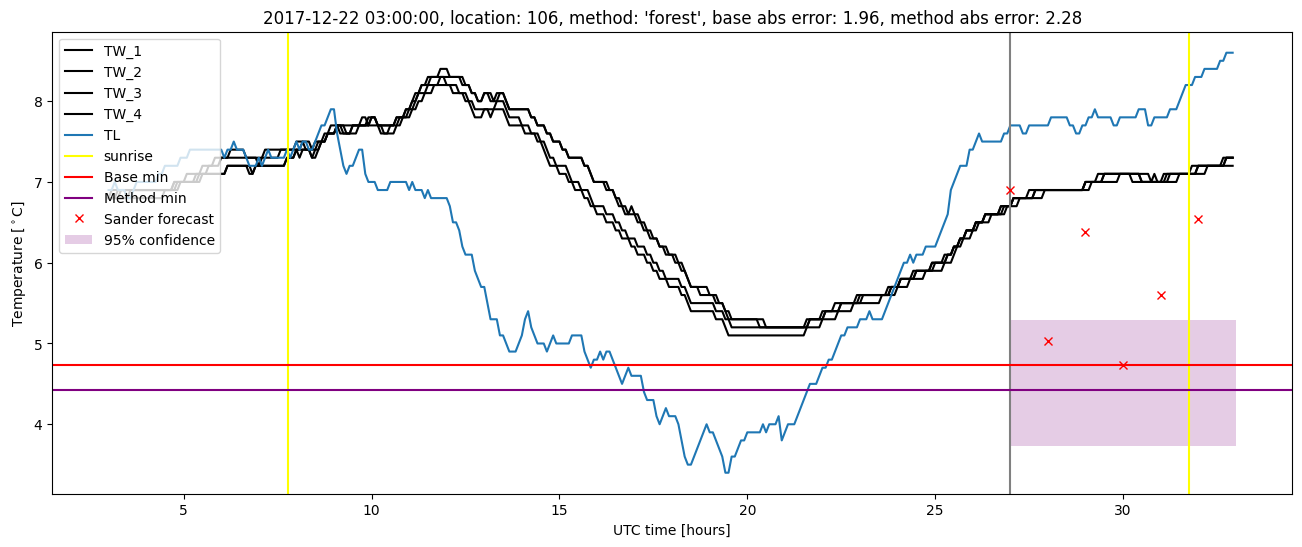
Random forest plots
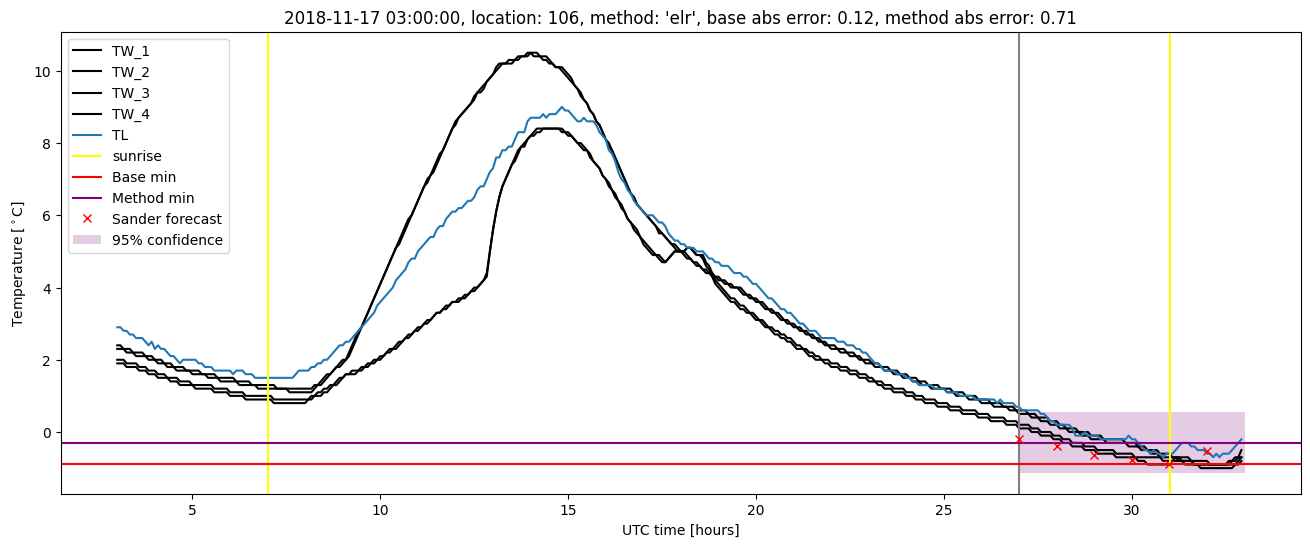
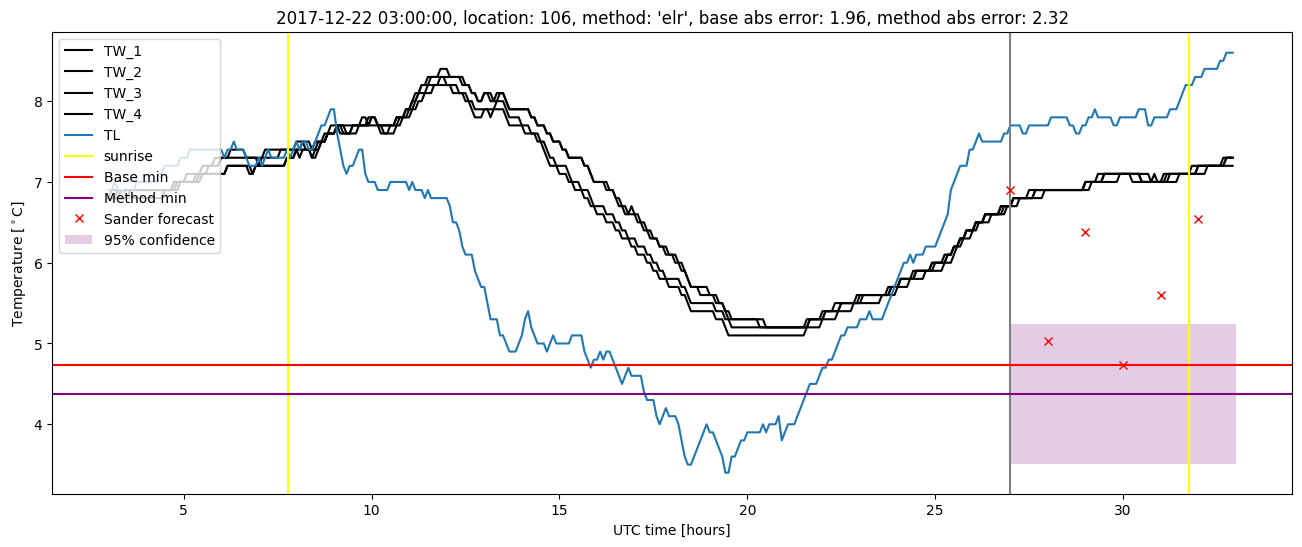
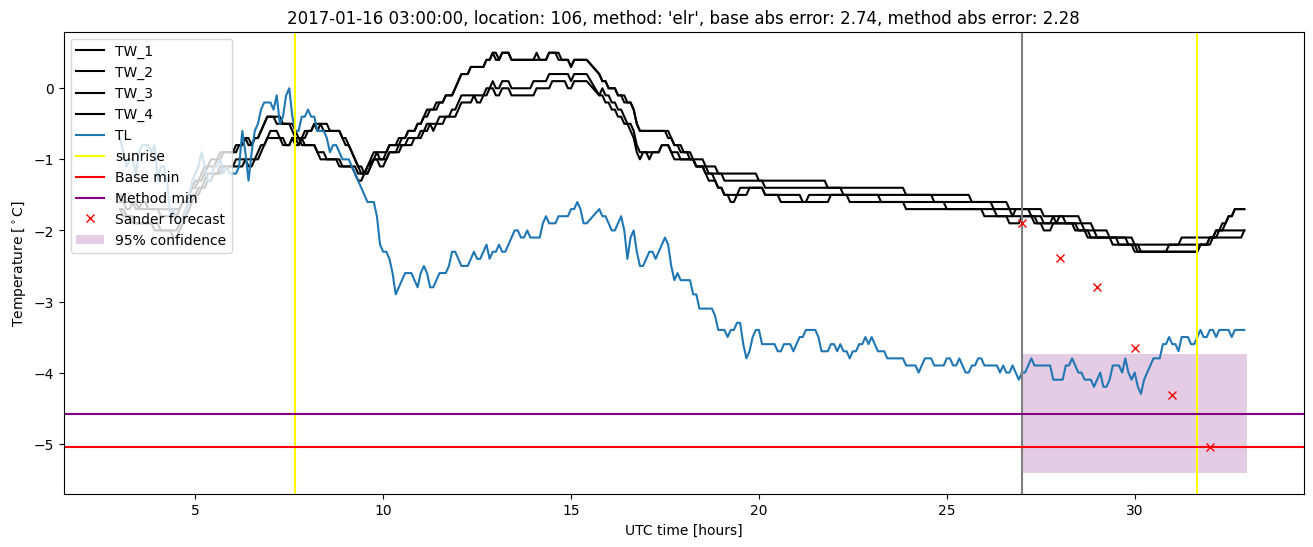
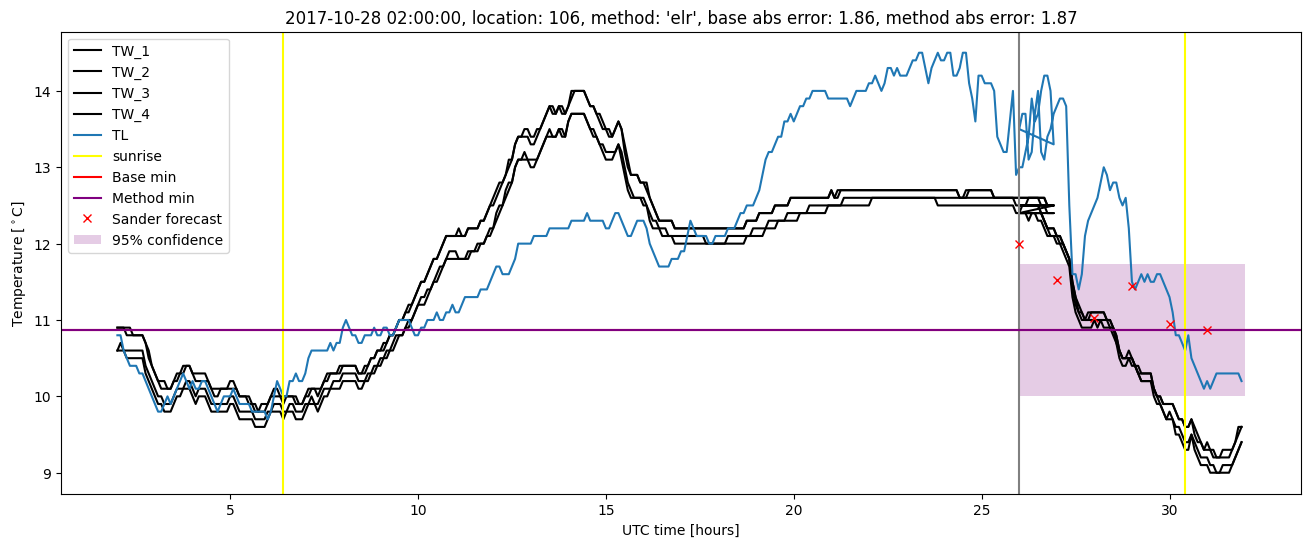
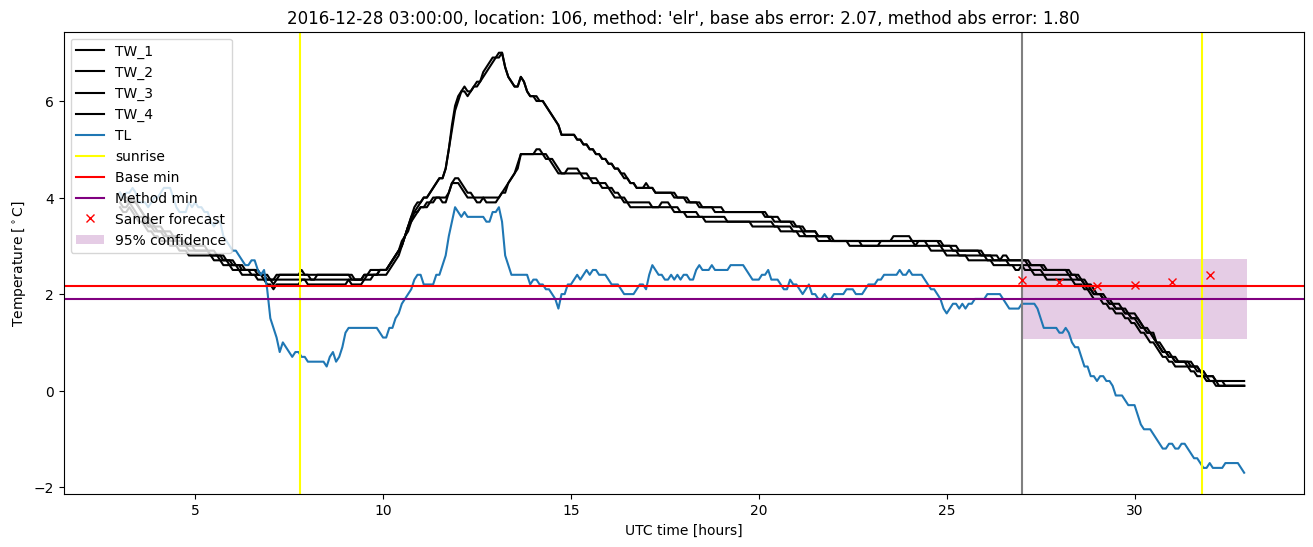
Extended logistic regression results
| names |
period |
power |
significance |
meanSquareError |
absError |
maxError |
CRPS |
IGN |
| baseline |
winter 2016 |
0.994 |
0.042 |
0.377 |
0.442 |
2.287 |
NaN |
NaN |
| elr |
winter 2016 |
0.994 |
0.042 |
0.297 |
0.422 |
2.077 |
0.550 |
5.539 |
| baseline |
winter 2017 |
0.979 |
0.097 |
0.523 |
0.535 |
2.740 |
NaN |
NaN |
| elr |
winter 2017 |
0.979 |
0.065 |
0.357 |
0.436 |
2.279 |
0.512 |
4.691 |
| baseline |
winter 2018 |
0.986 |
0.125 |
0.384 |
0.471 |
1.963 |
NaN |
NaN |
| elr |
winter 2018 |
0.993 |
0.094 |
0.309 |
0.428 |
2.320 |
0.546 |
4.464 |
| baseline |
winter 2019 |
0.993 |
0.000e+00 |
0.285 |
0.404 |
2.203 |
NaN |
NaN |
| elr |
winter 2019 |
0.993 |
0.000e+00 |
0.243 |
0.383 |
1.418 |
0.525 |
4.667 |
| baseline |
all |
0.989 |
0.082 |
0.384 |
0.458 |
2.740 |
NaN |
NaN |
| elr |
all |
0.991 |
0.061 |
0.298 |
0.417 |
2.320 |
0.536 |
4.885 |
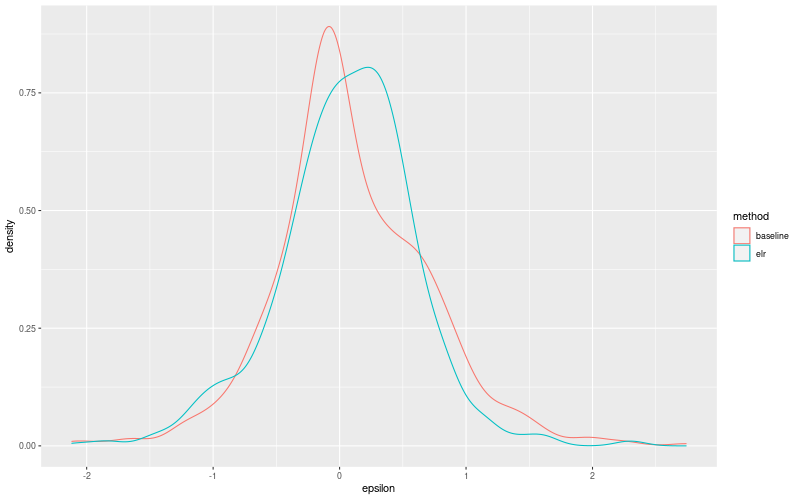
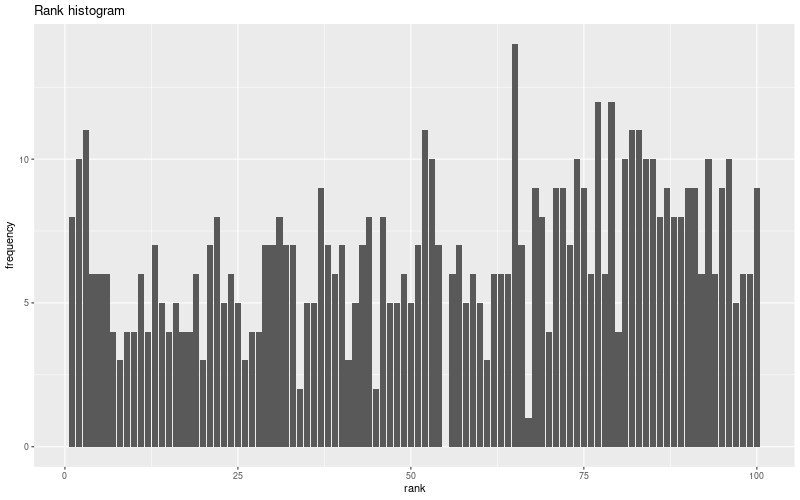
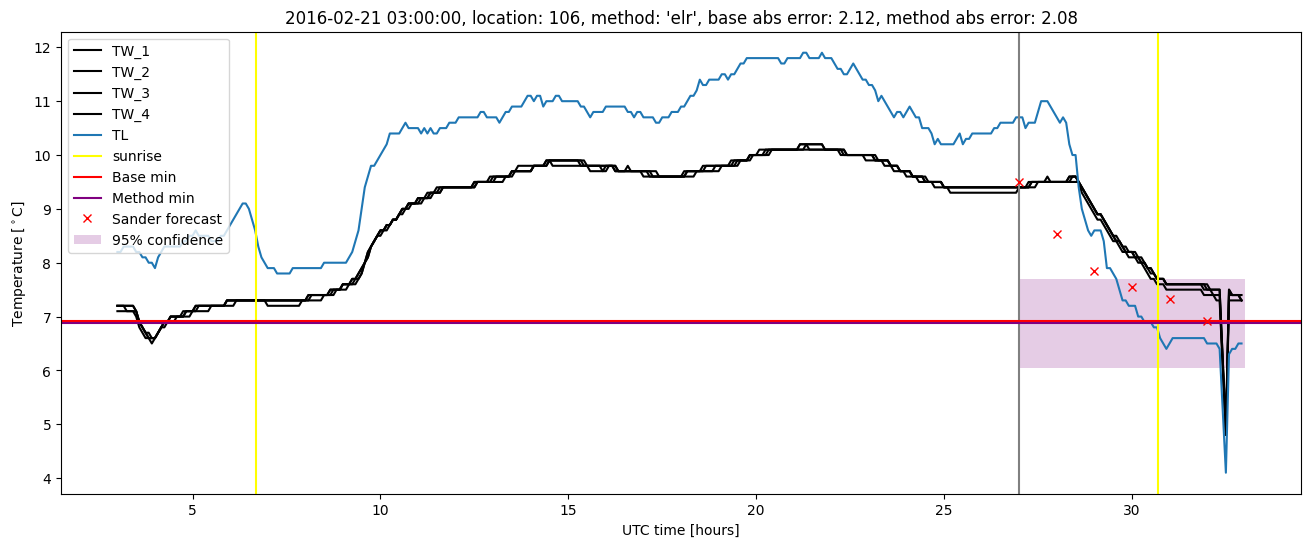
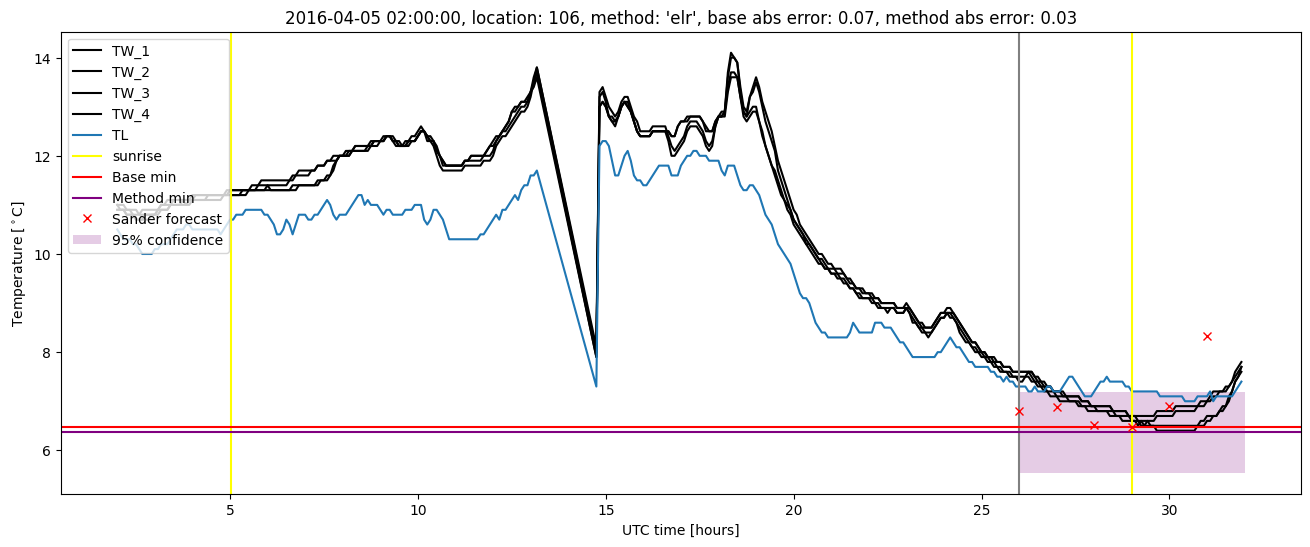
Extended logistic regression plots