GMS location: 105
Random forest results
| names |
period |
power |
significance |
meanSquareError |
absError |
maxError |
CRPS |
IGN |
| baseline |
winter 2016 |
0.994 |
0.000e+00 |
0.355 |
0.412 |
3.296 |
NaN |
NaN |
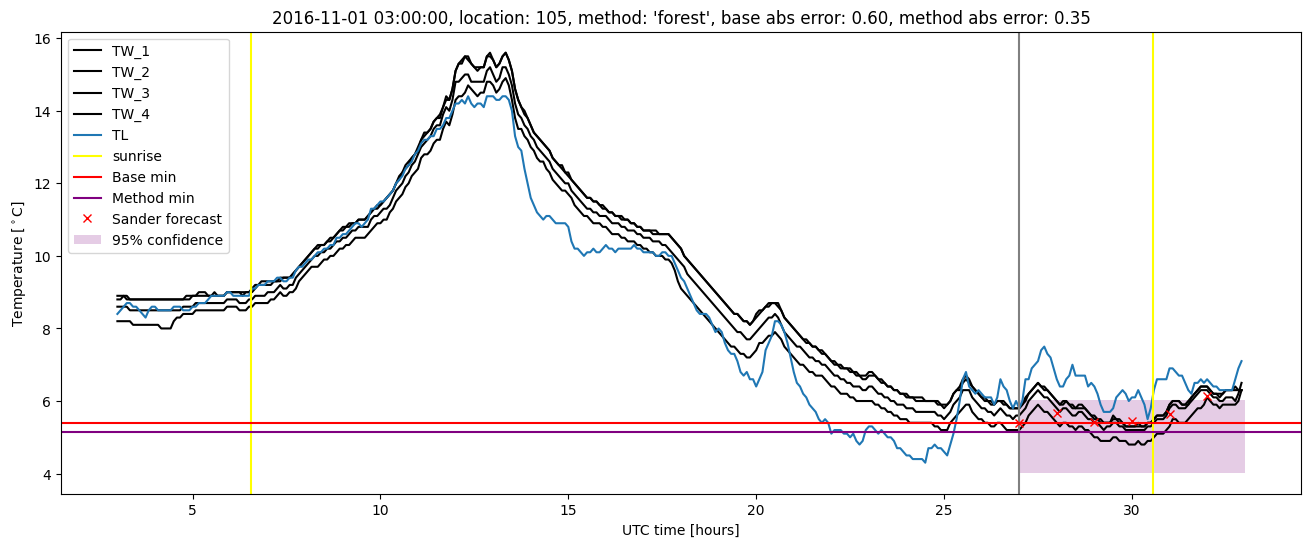
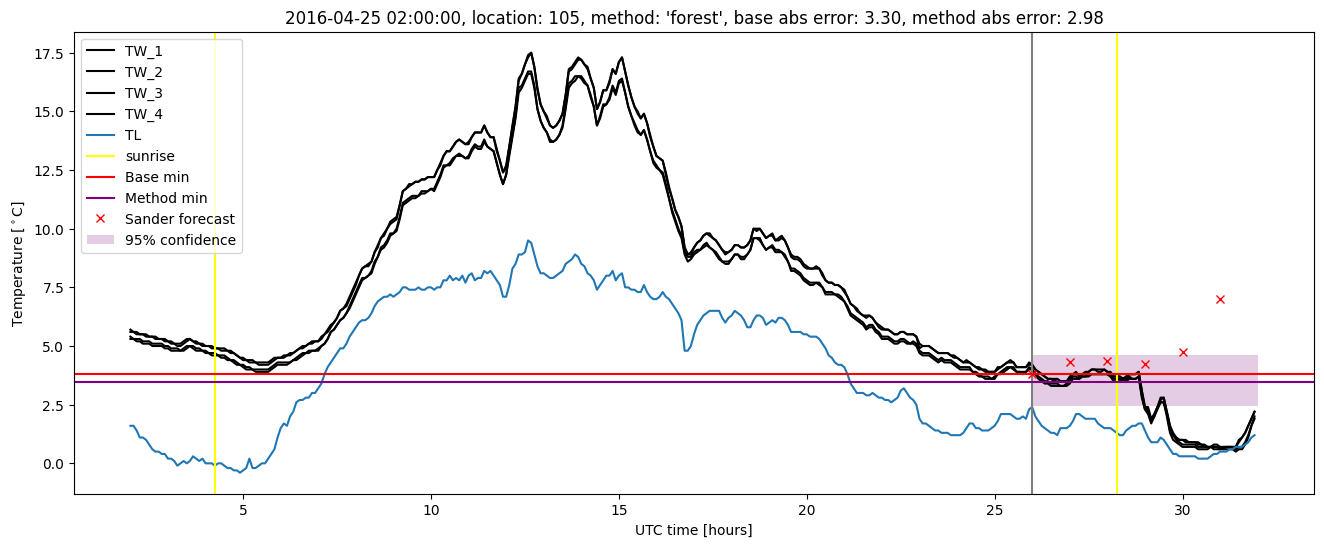
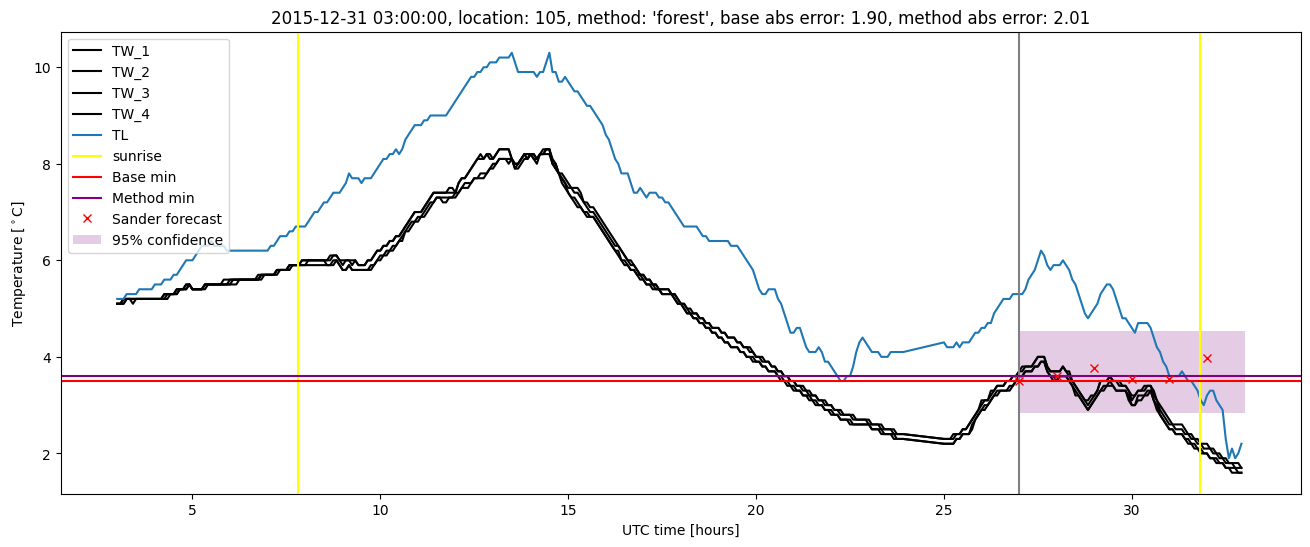
| forest |
winter 2016 |
0.988 |
0.000e+00 |
0.296 |
0.379 |
2.977 |
0.505 |
3.542 |
| baseline |
winter 2017 |
0.982 |
0.071 |
0.435 |
0.477 |
2.288 |
NaN |
NaN |
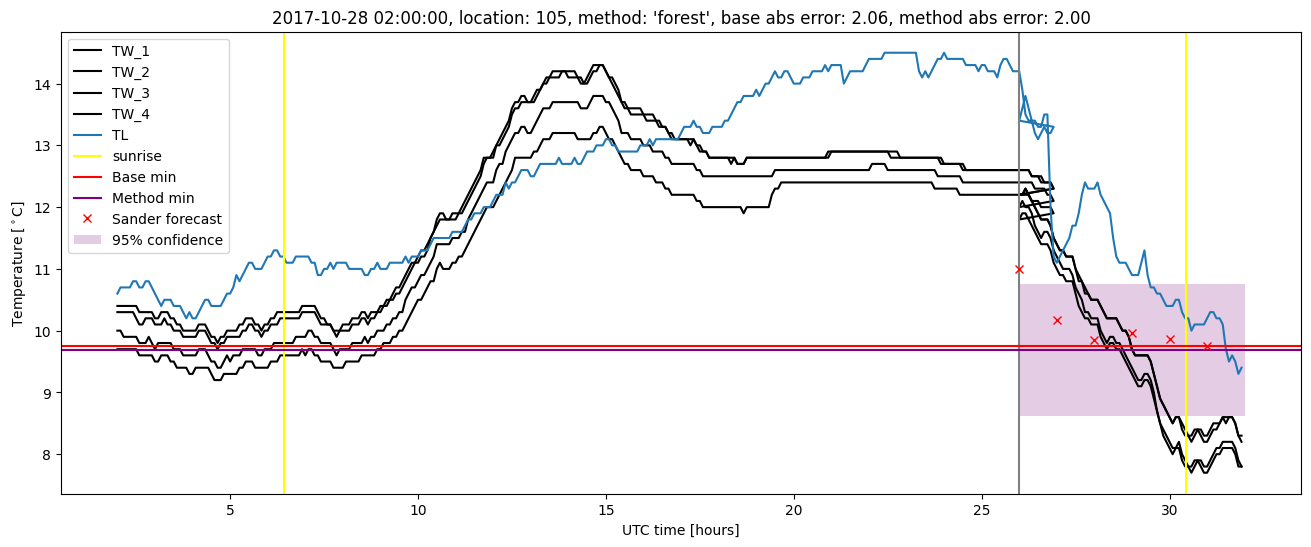
| forest |
winter 2017 |
0.982 |
0.071 |
0.331 |
0.418 |
1.893 |
0.501 |
6.277 |
| baseline |
winter 2018 |
0.985 |
0.108 |
0.377 |
0.441 |
2.302 |
NaN |
NaN |
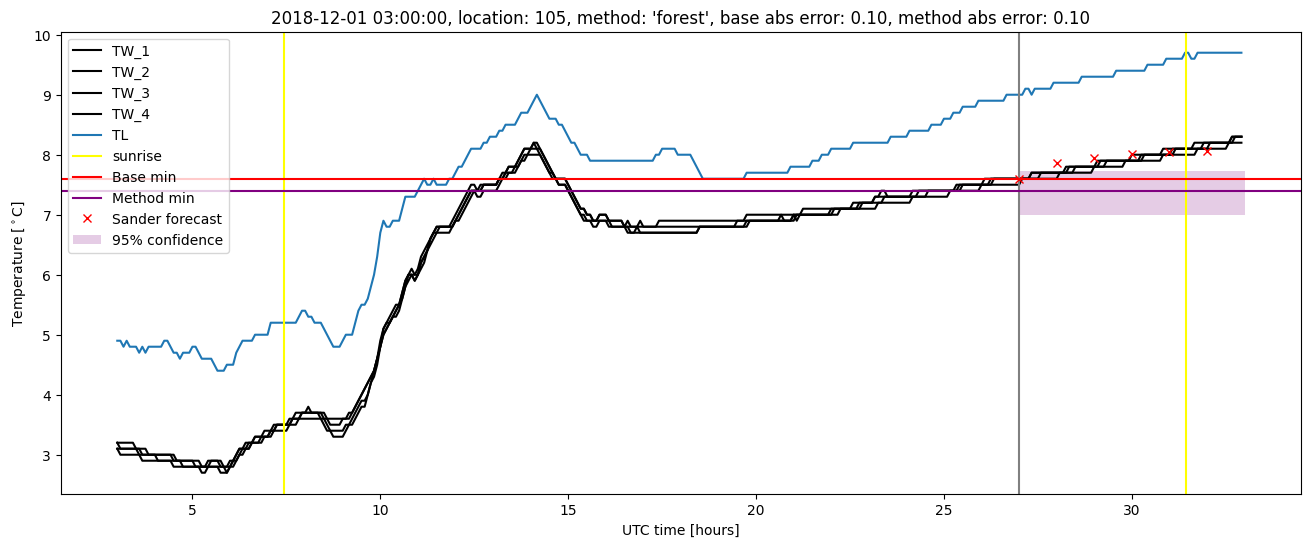
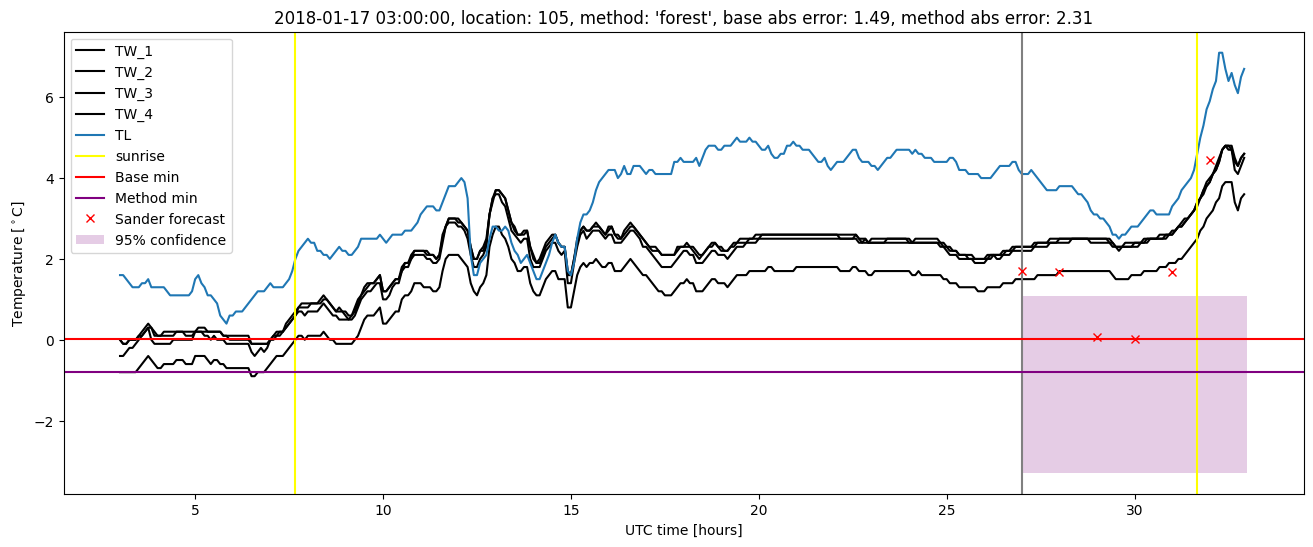
| forest |
winter 2018 |
0.962 |
0.081 |
0.355 |
0.434 |
2.307 |
0.510 |
3.770 |
| baseline |
winter 2019 |
0.992 |
0.083 |
0.272 |
0.368 |
1.652 |
NaN |
NaN |
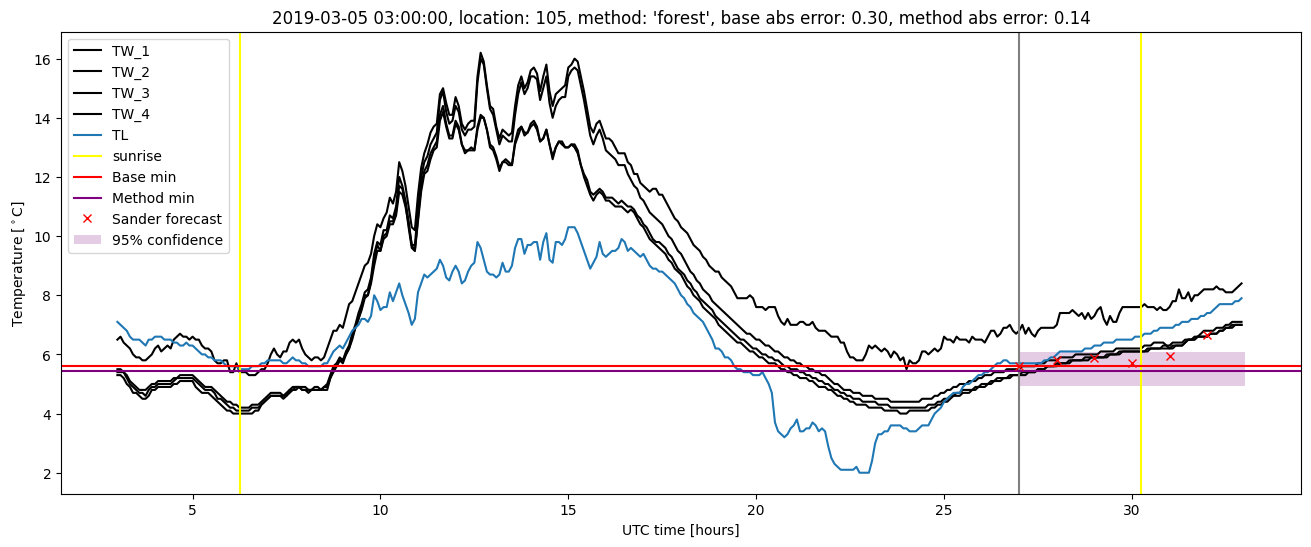
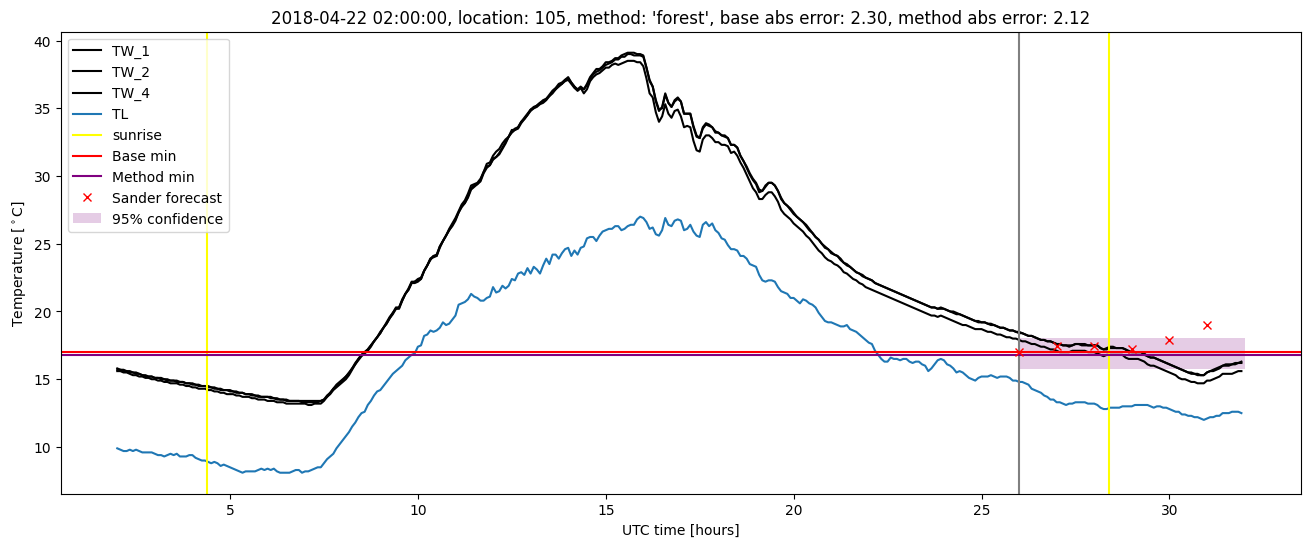
| forest |
winter 2019 |
1.000 |
0.083 |
0.196 |
0.323 |
1.474 |
0.498 |
4.038 |
| baseline |
all |
0.989 |
0.065 |
0.362 |
0.426 |
3.296 |
NaN |
NaN |
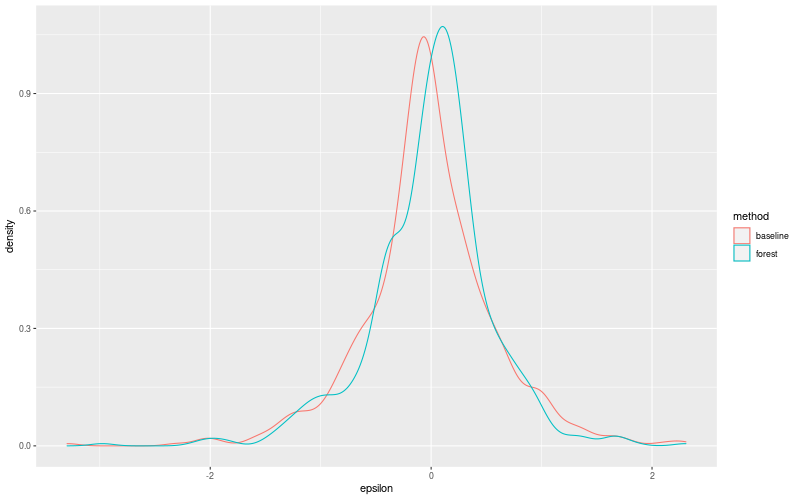
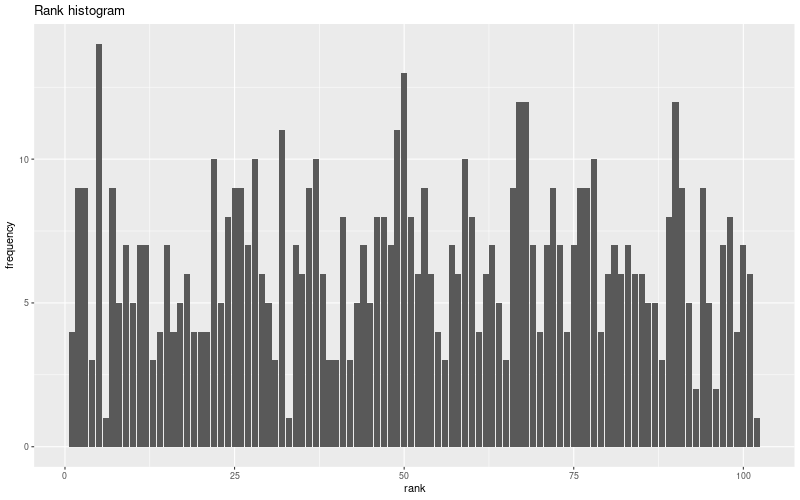
| forest |
all |
0.983 |
0.057 |
0.299 |
0.391 |
2.977 |
0.504 |
4.333 |
Random forest plots
Extended logistic regression results
| names |
period |
power |
significance |
meanSquareError |
absError |
maxError |
CRPS |
IGN |
| baseline |
winter 2016 |
0.994 |
0.000e+00 |
0.355 |
0.412 |
3.296 |
NaN |
NaN |
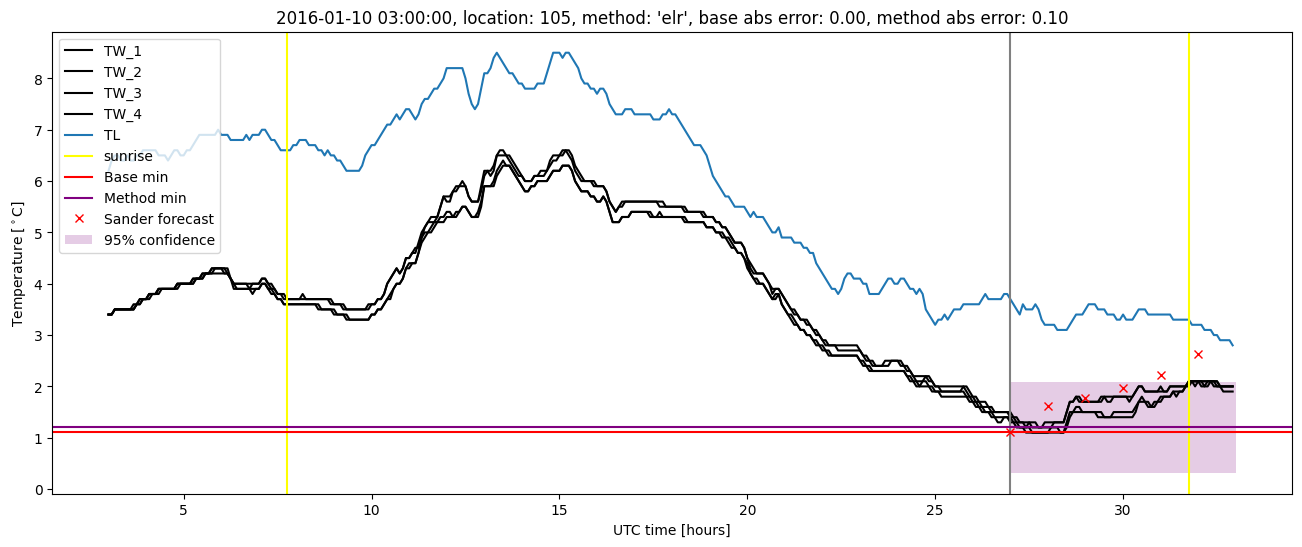
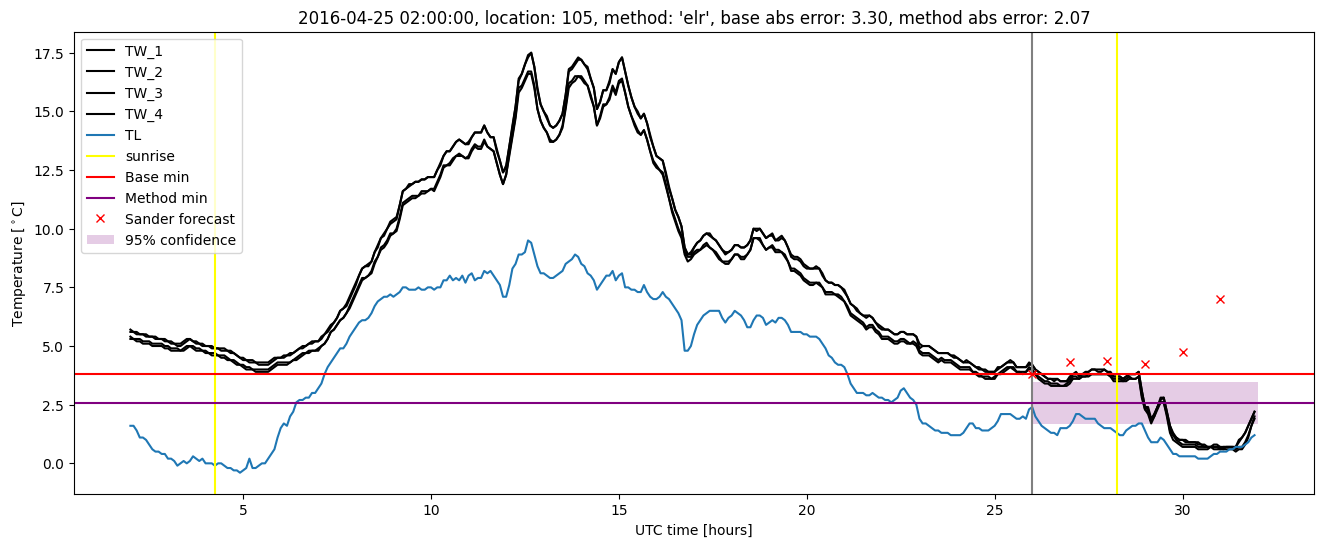
| elr |
winter 2016 |
1.000 |
0.000e+00 |
0.289 |
0.407 |
2.073 |
0.596 |
4.983 |
| baseline |
winter 2017 |
0.982 |
0.071 |
0.435 |
0.477 |
2.288 |
NaN |
NaN |
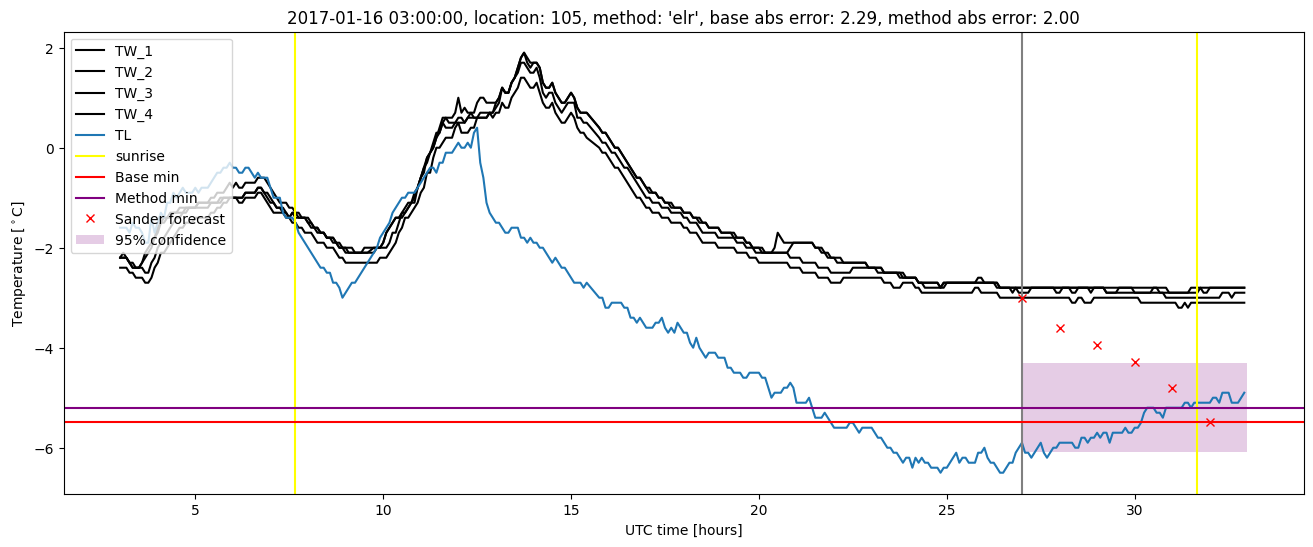
| elr |
winter 2017 |
0.973 |
0.048 |
0.332 |
0.422 |
1.997 |
0.536 |
4.114 |
| baseline |
winter 2018 |
0.985 |
0.108 |
0.377 |
0.441 |
2.302 |
NaN |
NaN |
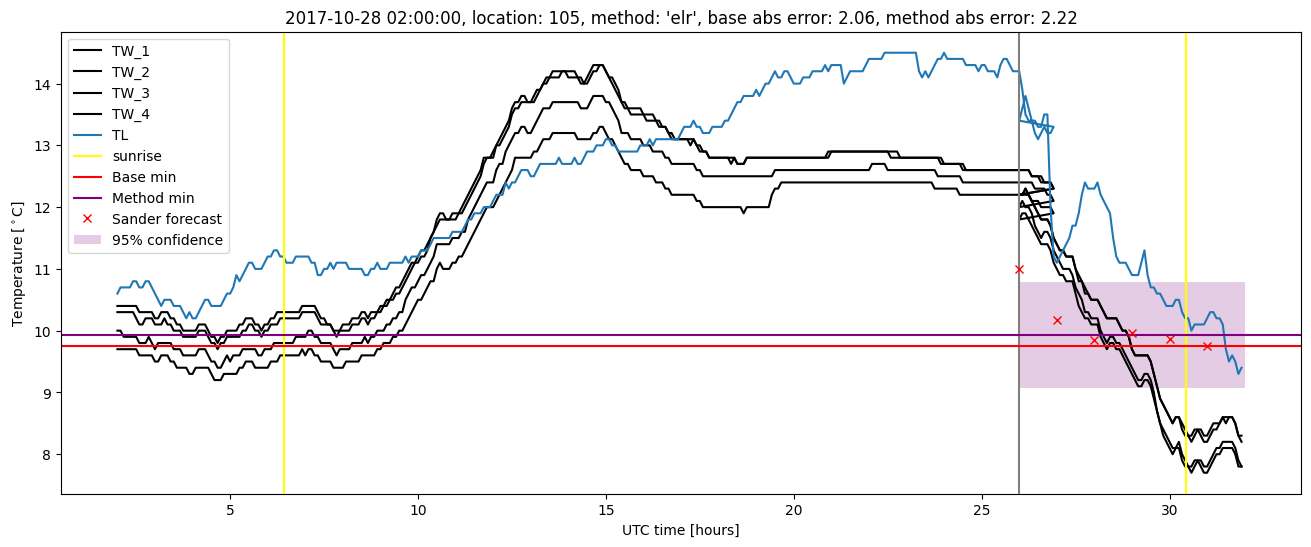
| elr |
winter 2018 |
0.977 |
0.054 |
0.310 |
0.425 |
2.224 |
0.597 |
5.562 |
| baseline |
winter 2019 |
0.992 |
0.083 |
0.272 |
0.368 |
1.652 |
NaN |
NaN |
| elr |
winter 2019 |
1.000 |
0.083 |
0.222 |
0.373 |
1.486 |
0.548 |
3.916 |
| baseline |
all |
0.989 |
0.065 |
0.362 |
0.426 |
3.296 |
NaN |
NaN |
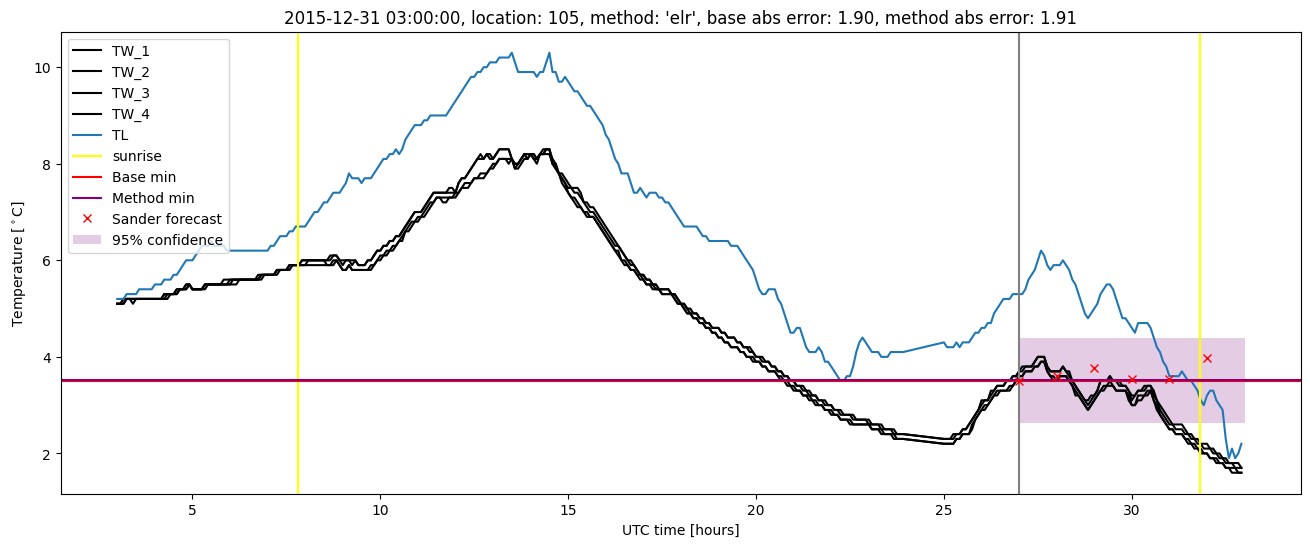
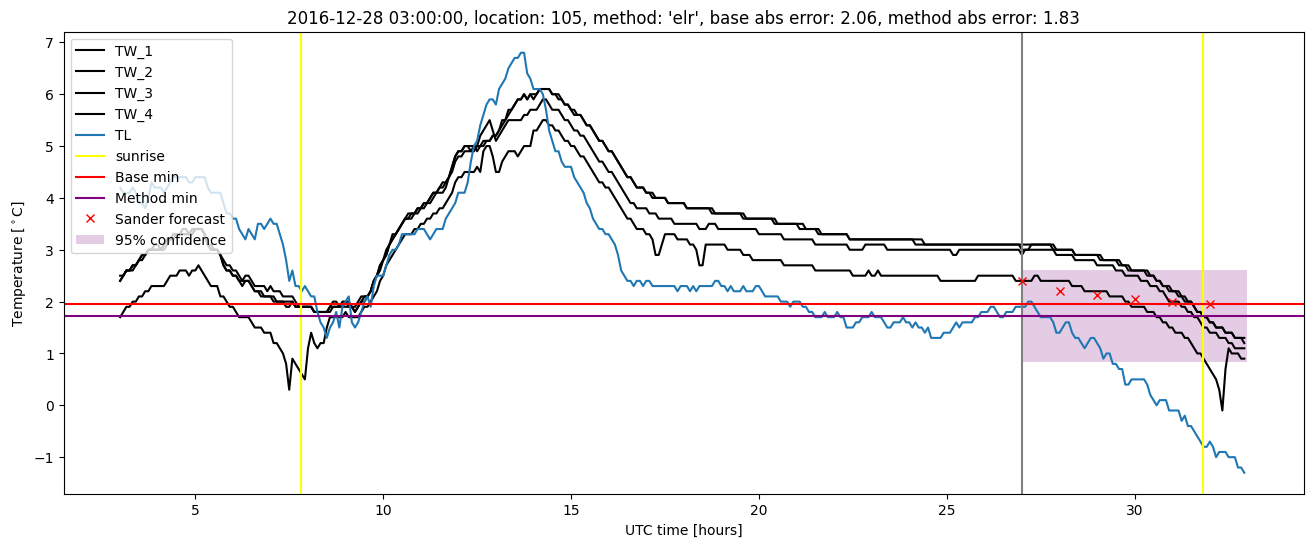
| elr |
all |
0.989 |
0.040 |
0.291 |
0.408 |
2.224 |
0.573 |
4.714 |
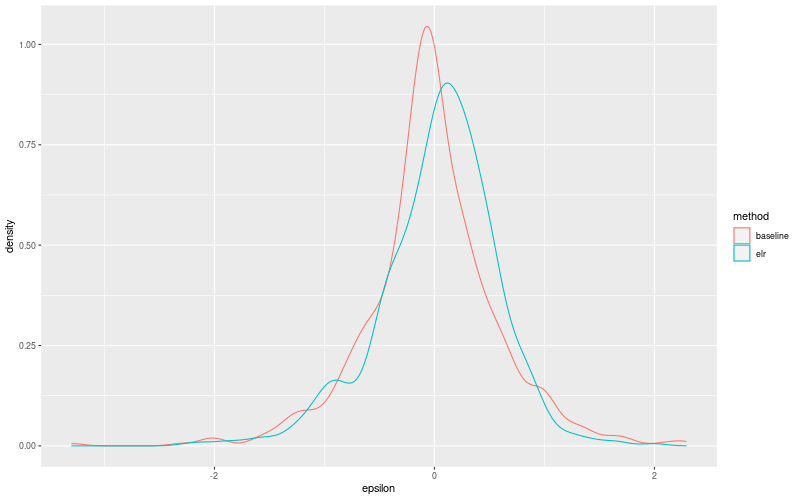
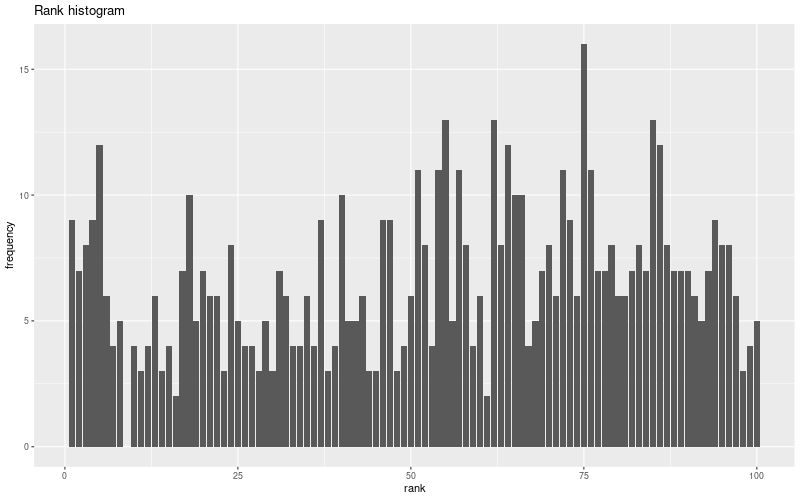
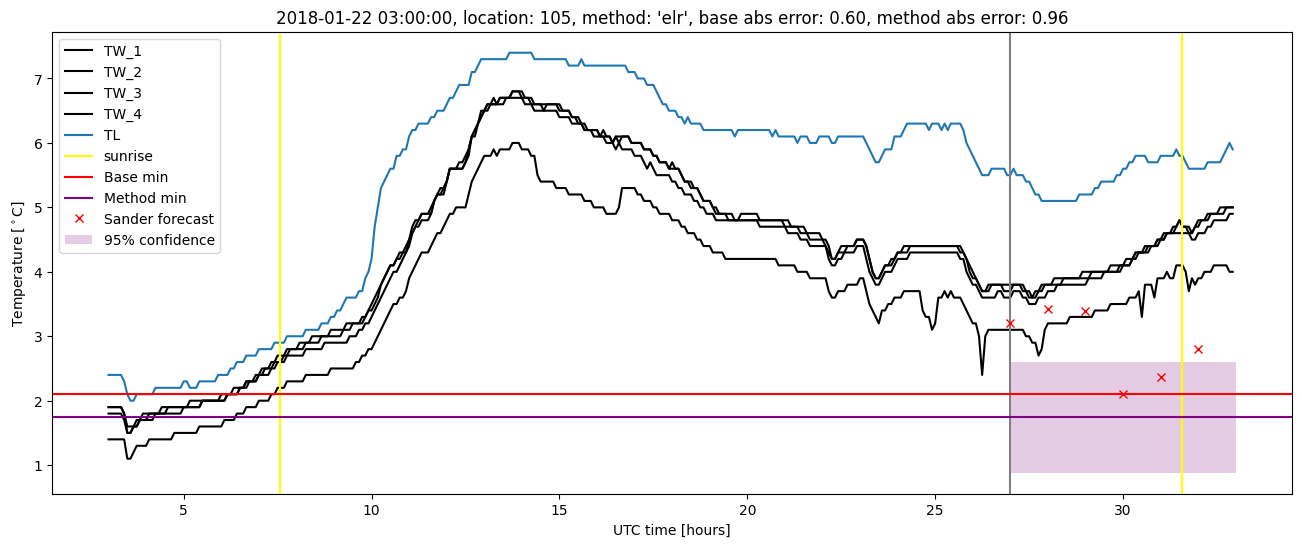
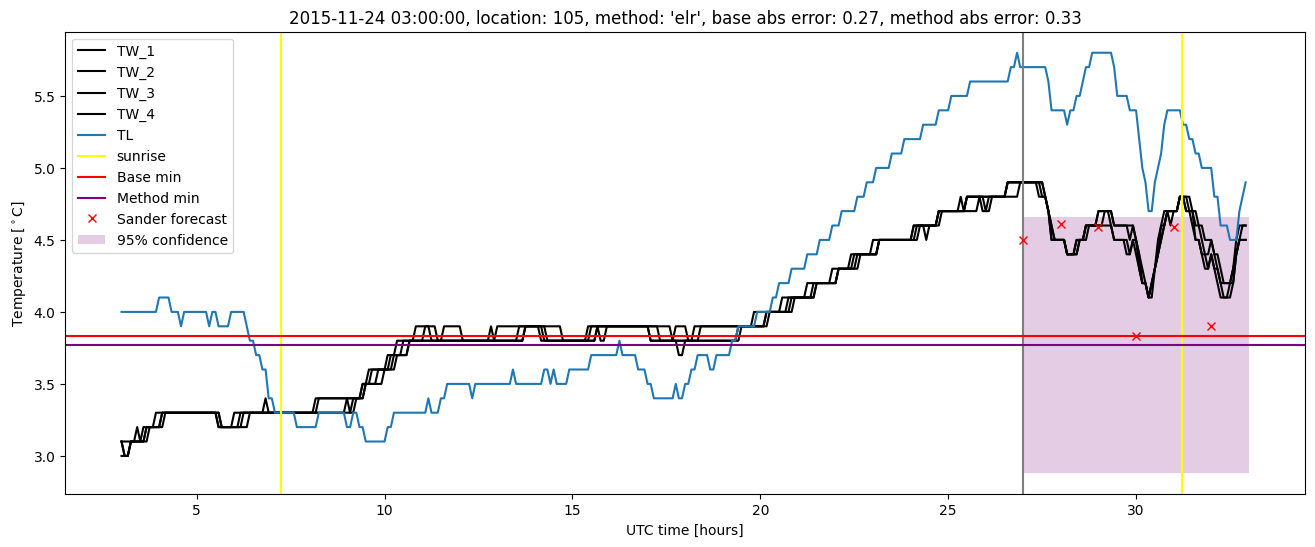
Extended logistic regression plots