GMS location: 104
Random forest results
| names |
period |
power |
significance |
meanSquareError |
absError |
maxError |
CRPS |
IGN |
| baseline |
winter 2016 |
0.988 |
0.065 |
0.322 |
0.424 |
1.800 |
NaN |
NaN |
| forest |
winter 2016 |
0.988 |
0.032 |
0.243 |
0.359 |
1.966 |
0.443 |
4.121 |
| baseline |
winter 2017 |
0.973 |
0.075 |
0.582 |
0.532 |
3.474 |
NaN |
NaN |
| forest |
winter 2017 |
0.982 |
0.050 |
0.381 |
0.421 |
3.246 |
0.451 |
6.226 |
| baseline |
winter 2018 |
0.986 |
0.091 |
0.360 |
0.446 |
2.112 |
NaN |
NaN |
| forest |
winter 2018 |
0.993 |
0.091 |
0.290 |
0.407 |
1.958 |
0.444 |
4.408 |
| baseline |
winter 2019 |
0.993 |
0.000e+00 |
0.316 |
0.394 |
1.804 |
NaN |
NaN |
| forest |
winter 2019 |
0.993 |
0.000e+00 |
0.212 |
0.340 |
1.389 |
0.447 |
4.071 |
| baseline |
all |
0.986 |
0.068 |
0.388 |
0.447 |
3.474 |
NaN |
NaN |
| forest |
all |
0.989 |
0.051 |
0.279 |
0.381 |
3.246 |
0.446 |
4.650 |
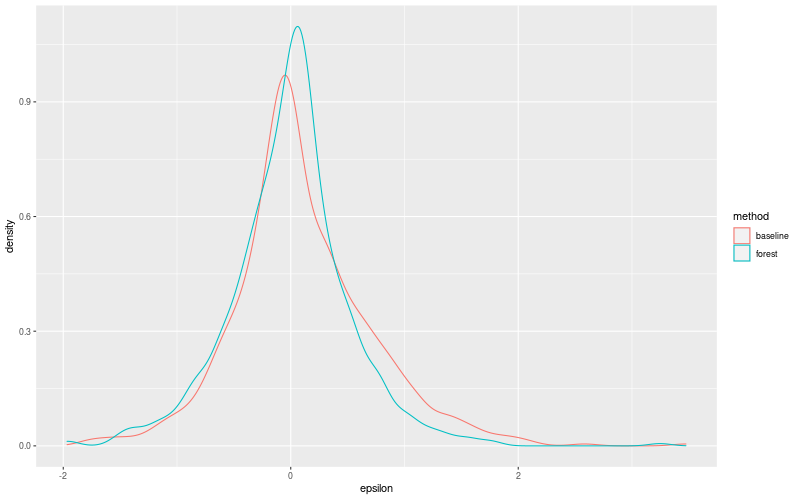
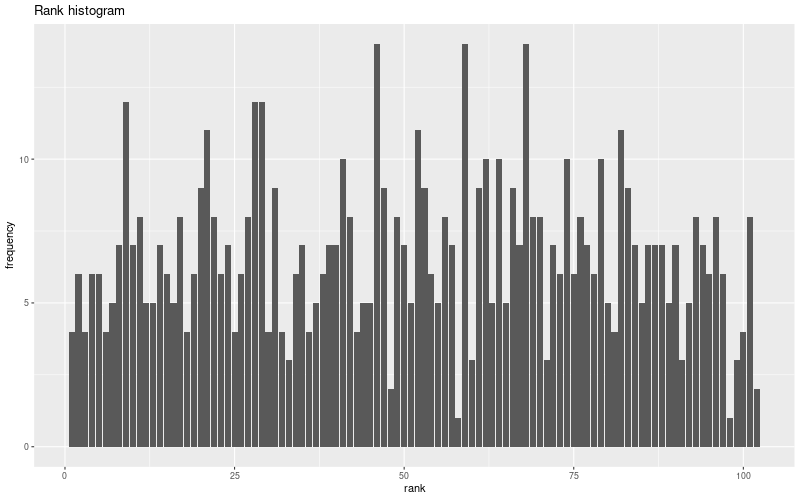
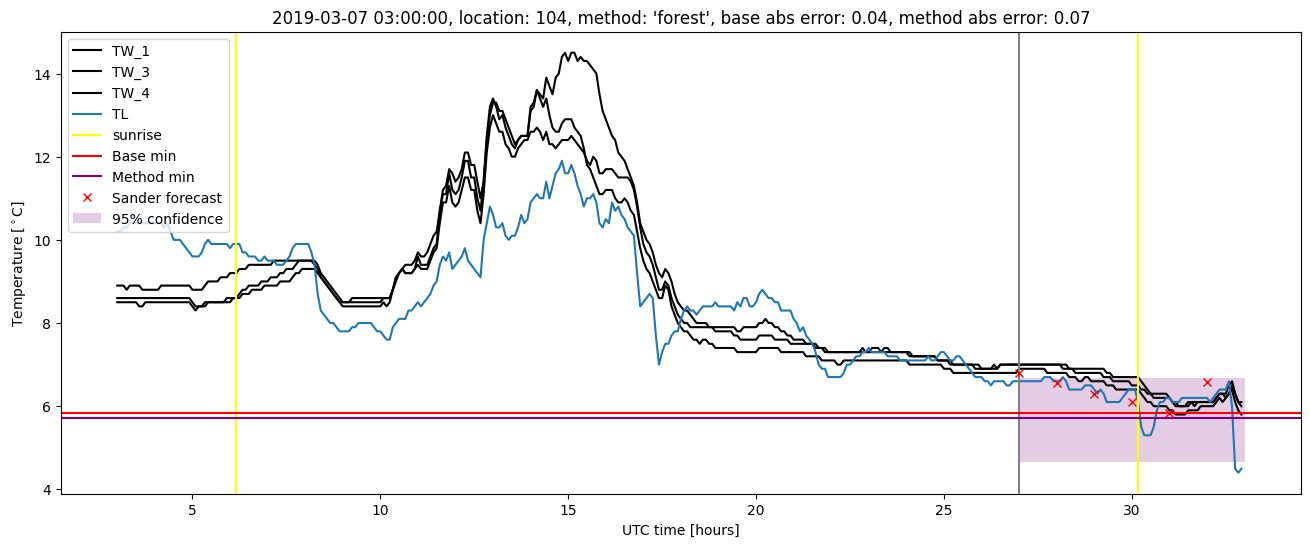
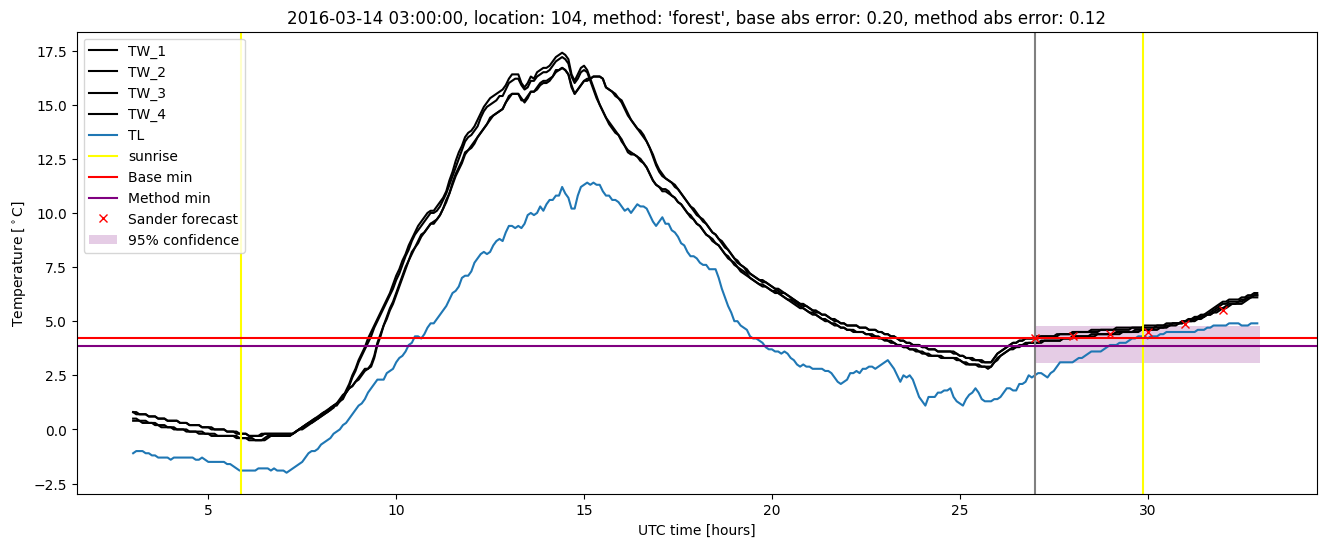
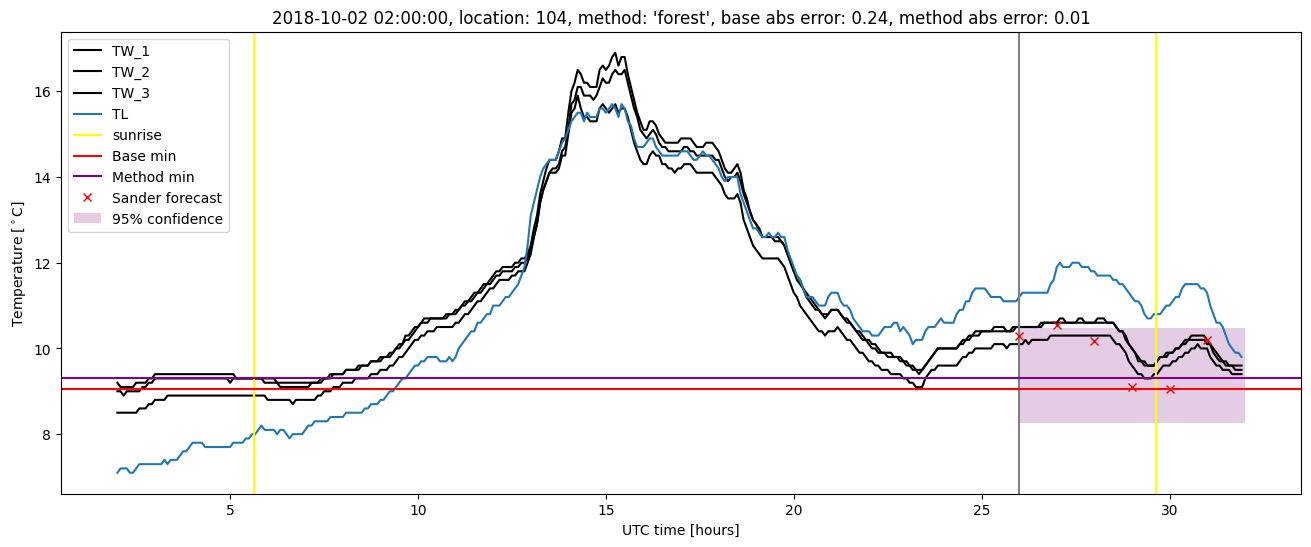
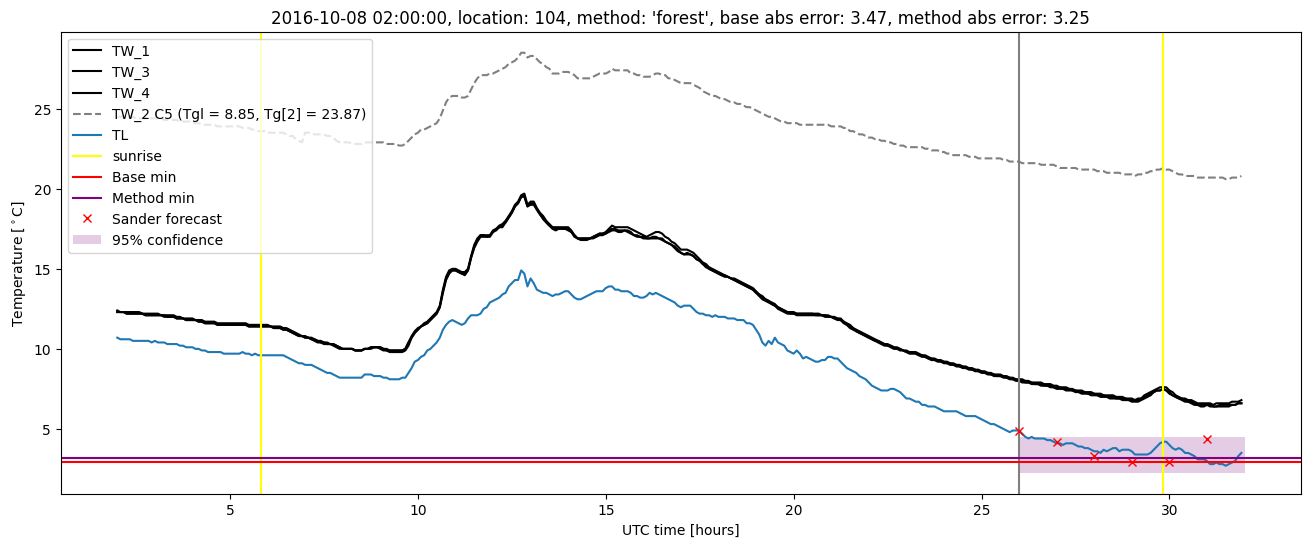
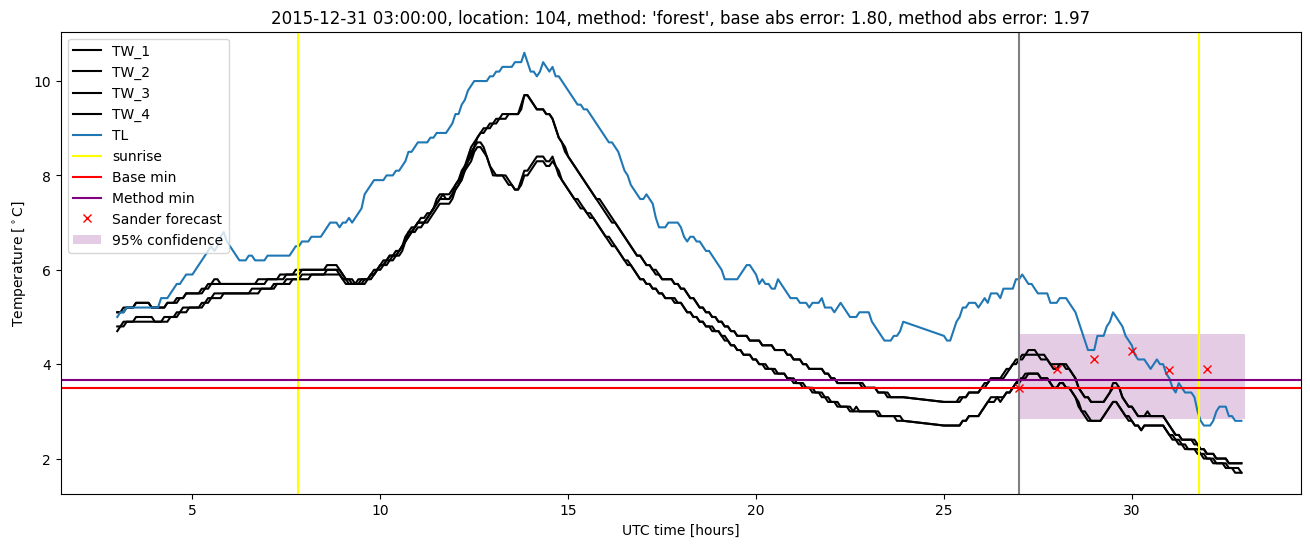
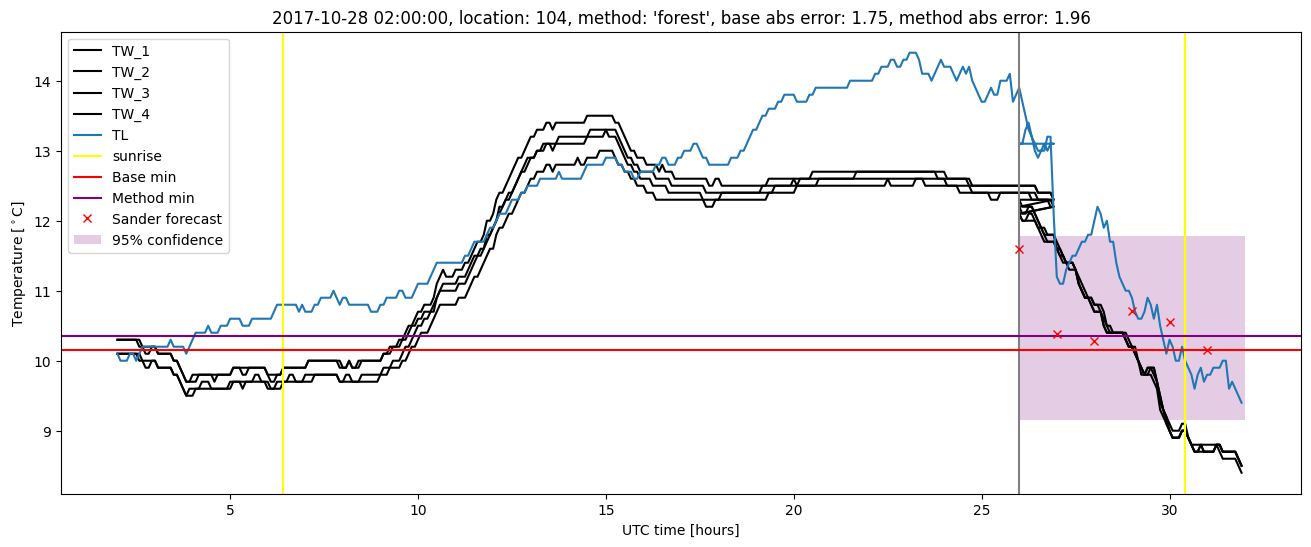
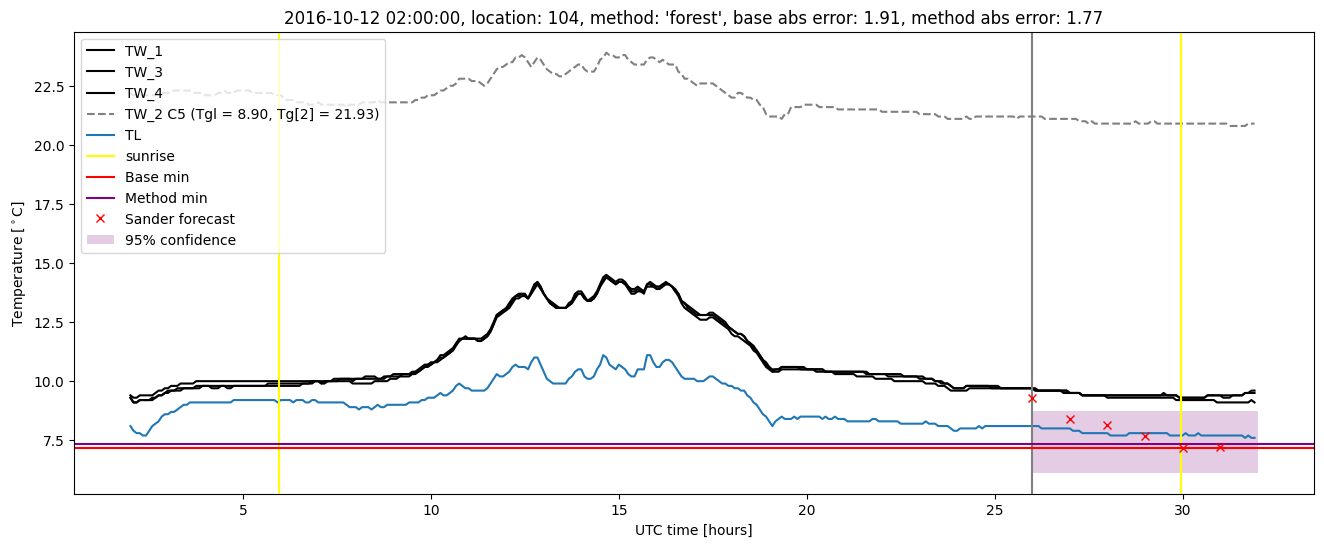
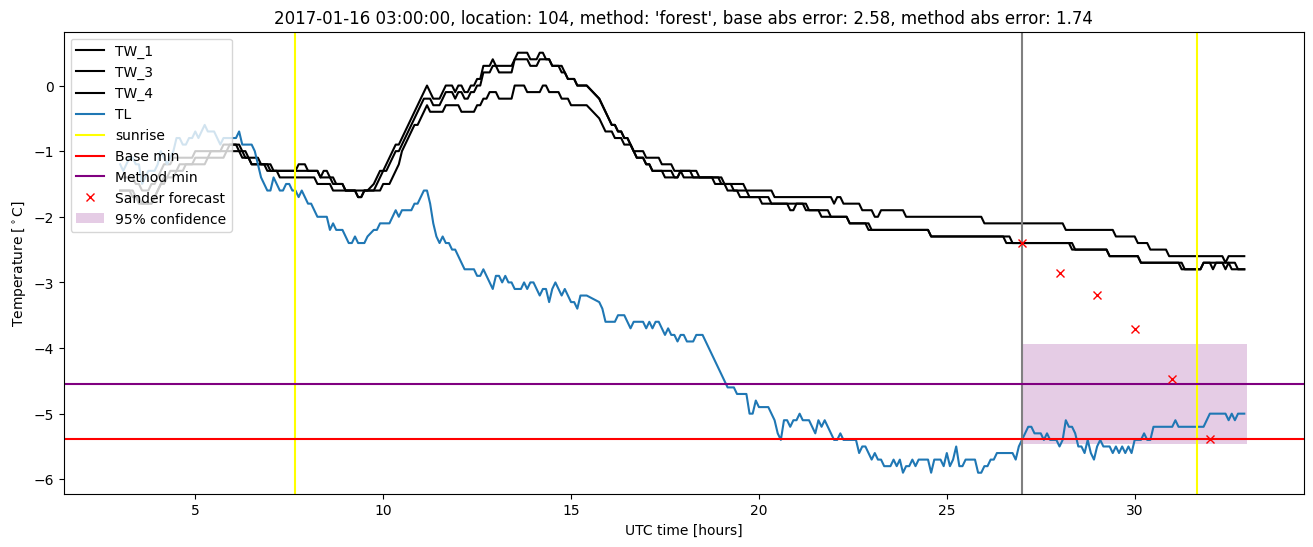
Random forest plots
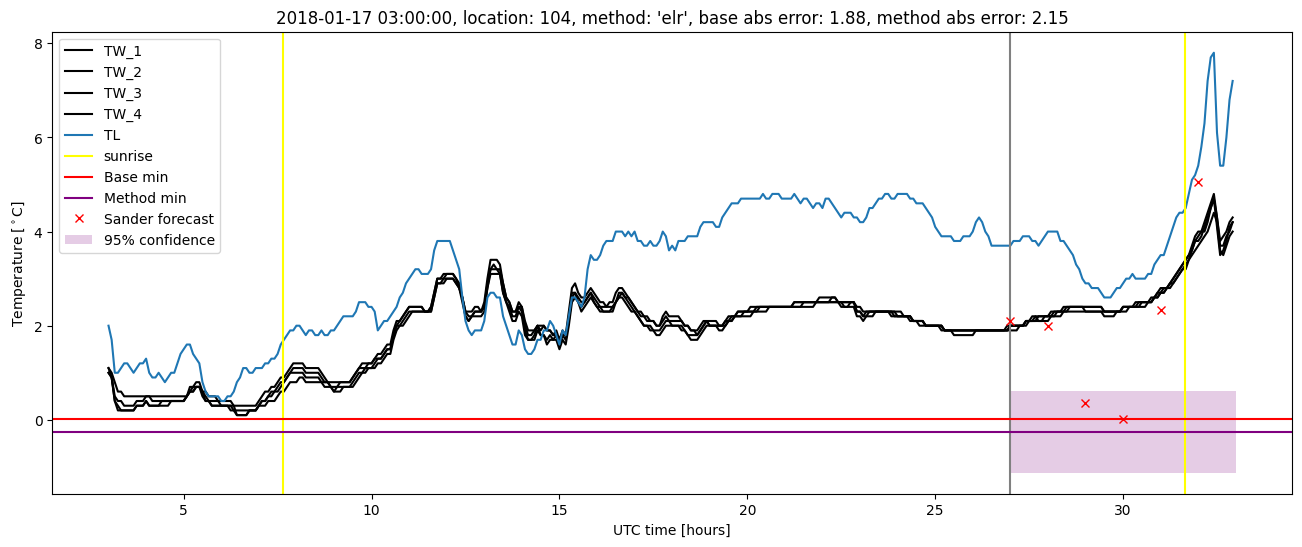
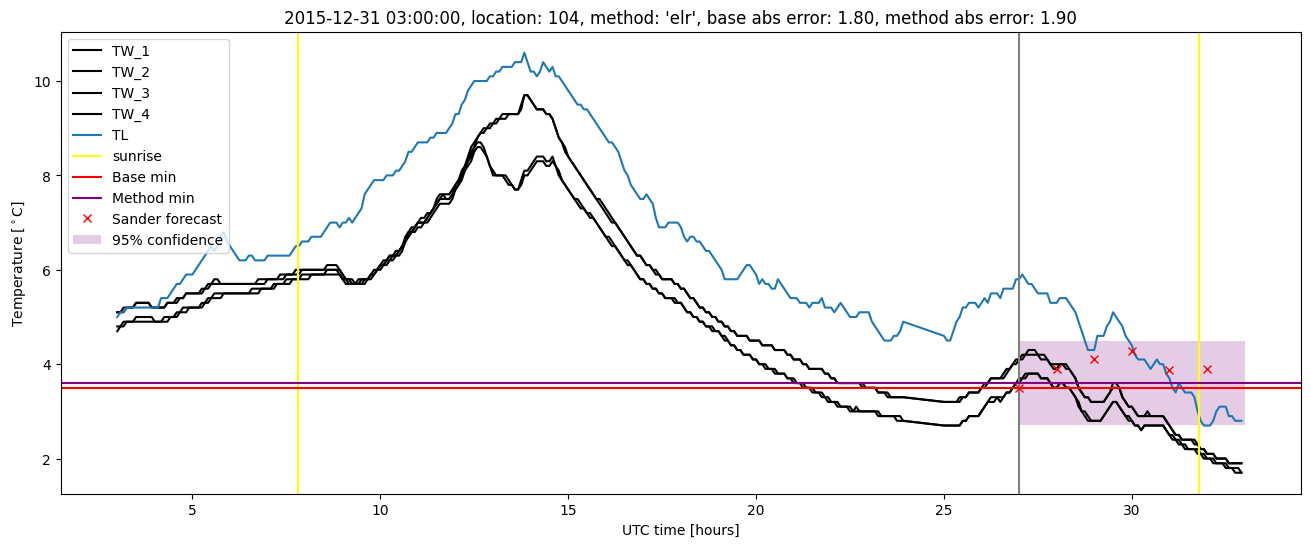
Extended logistic regression results
| names |
period |
power |
significance |
meanSquareError |
absError |
maxError |
CRPS |
IGN |
| baseline |
winter 2016 |
0.988 |
0.065 |
0.322 |
0.424 |
1.800 |
NaN |
NaN |
| elr |
winter 2016 |
0.988 |
0.032 |
0.283 |
0.407 |
1.900 |
0.505 |
3.483 |
| baseline |
winter 2017 |
0.973 |
0.075 |
0.582 |
0.532 |
3.474 |
NaN |
NaN |
| elr |
winter 2017 |
0.964 |
0.075 |
0.424 |
0.467 |
2.539 |
0.513 |
4.639 |
| baseline |
winter 2018 |
0.986 |
0.091 |
0.360 |
0.446 |
2.112 |
NaN |
NaN |
| elr |
winter 2018 |
0.980 |
0.091 |
0.329 |
0.441 |
2.325 |
0.512 |
3.936 |
| baseline |
winter 2019 |
0.993 |
0.000e+00 |
0.316 |
0.394 |
1.804 |
NaN |
NaN |
| elr |
winter 2019 |
0.993 |
0.000e+00 |
0.248 |
0.398 |
1.569 |
0.516 |
3.835 |
| baseline |
all |
0.986 |
0.068 |
0.388 |
0.447 |
3.474 |
NaN |
NaN |
| elr |
all |
0.982 |
0.060 |
0.318 |
0.427 |
2.539 |
0.511 |
3.937 |
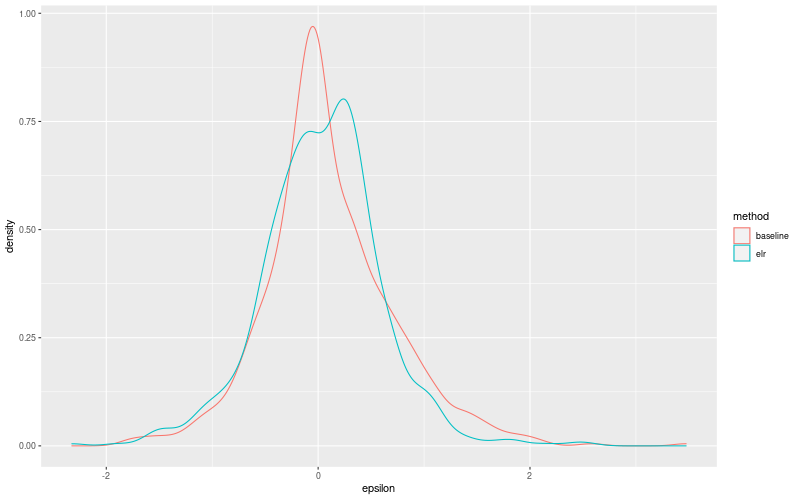
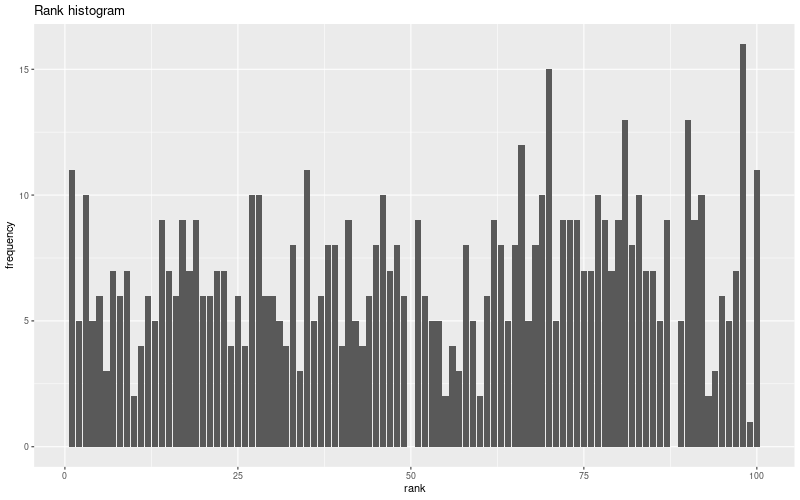
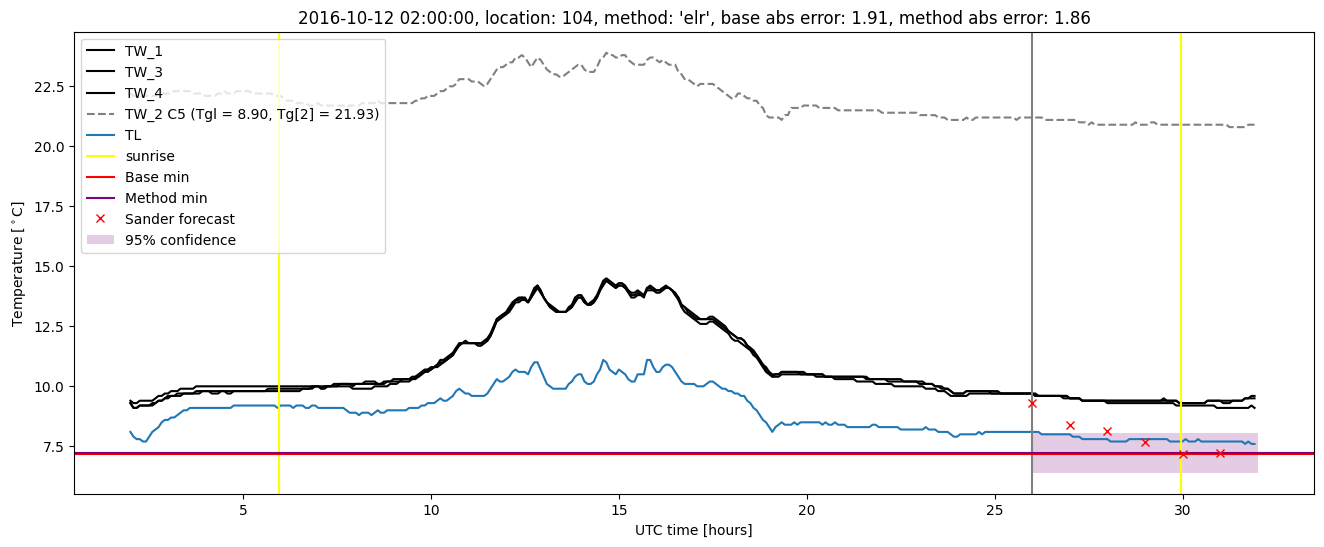
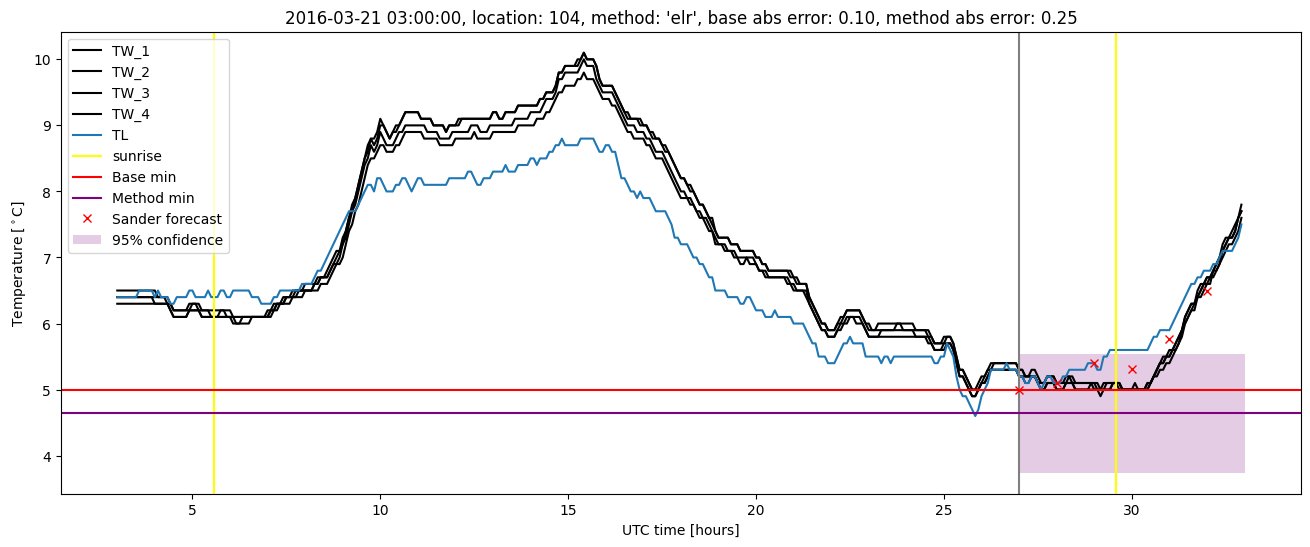
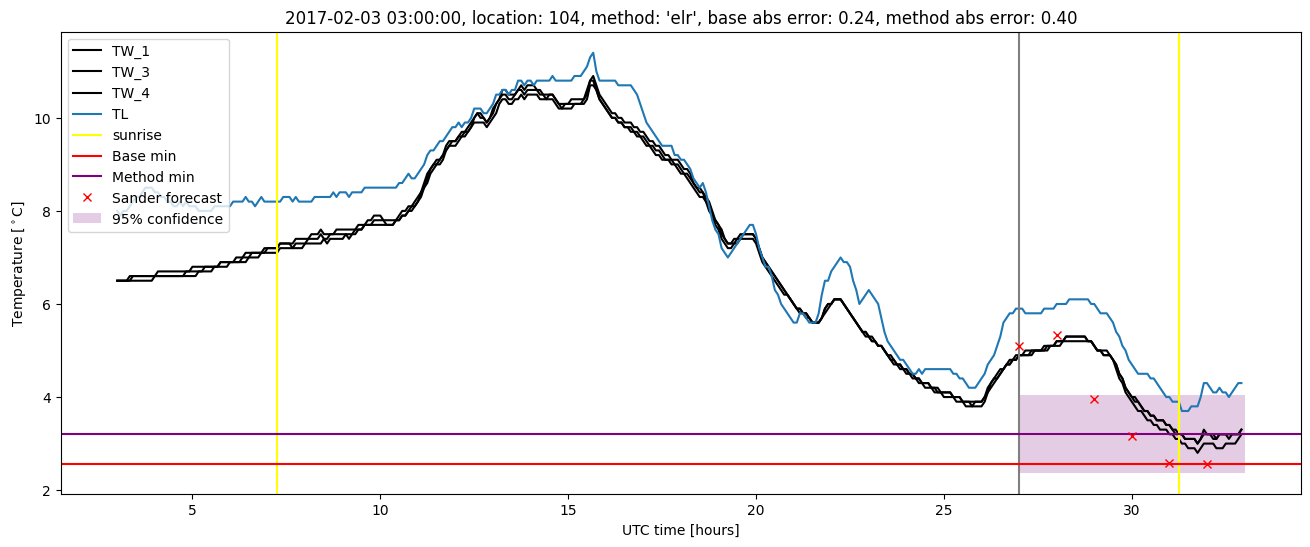
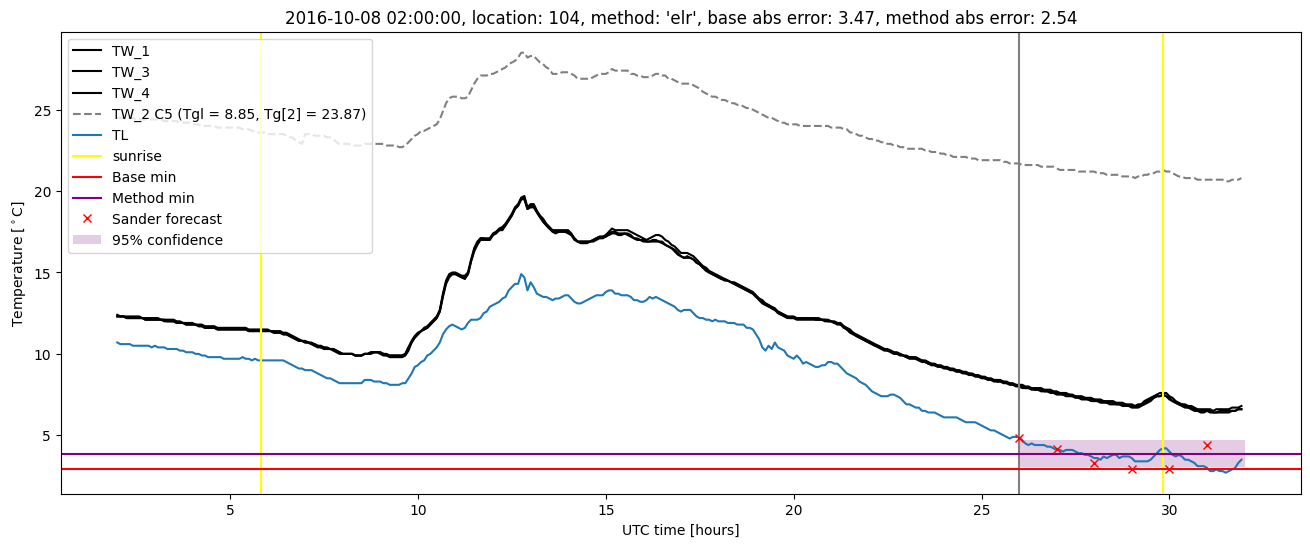
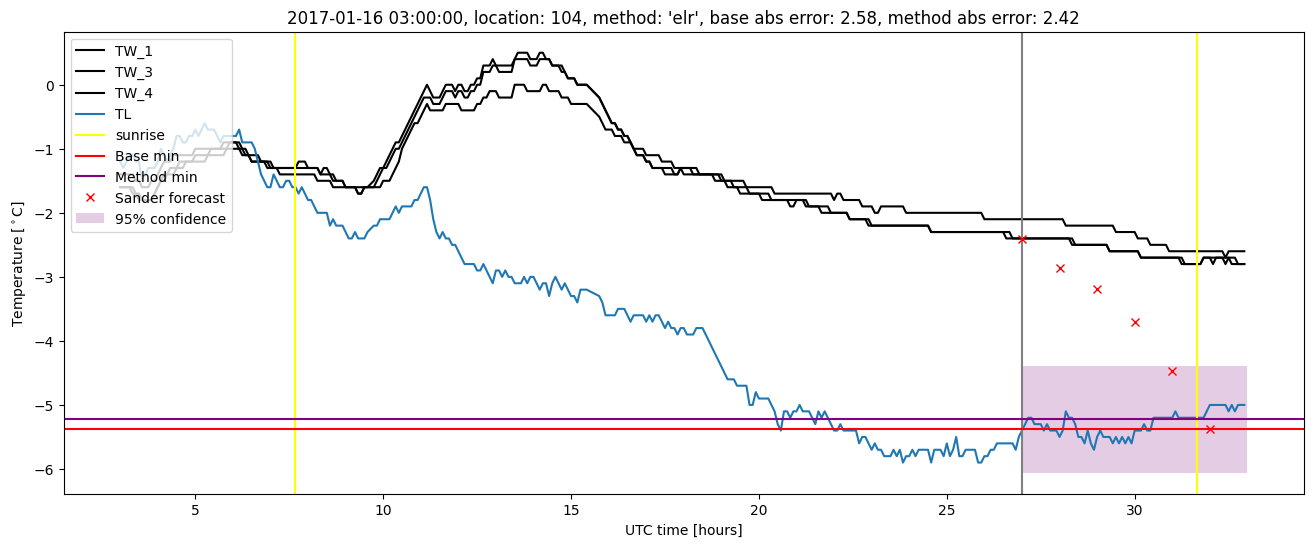
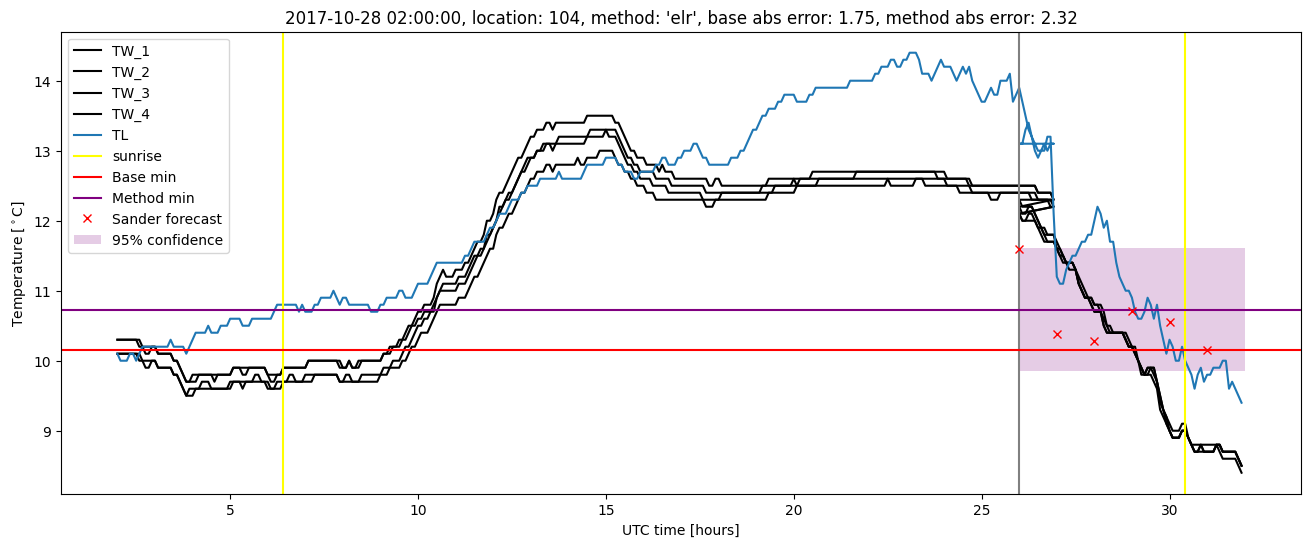
Extended logistic regression plots