GMS location: 103
Random forest results
| names |
period |
power |
significance |
meanSquareError |
absError |
maxError |
CRPS |
IGN |
| baseline |
winter 2016 |
0.988 |
0.111 |
0.427 |
0.476 |
2.399 |
NaN |
NaN |
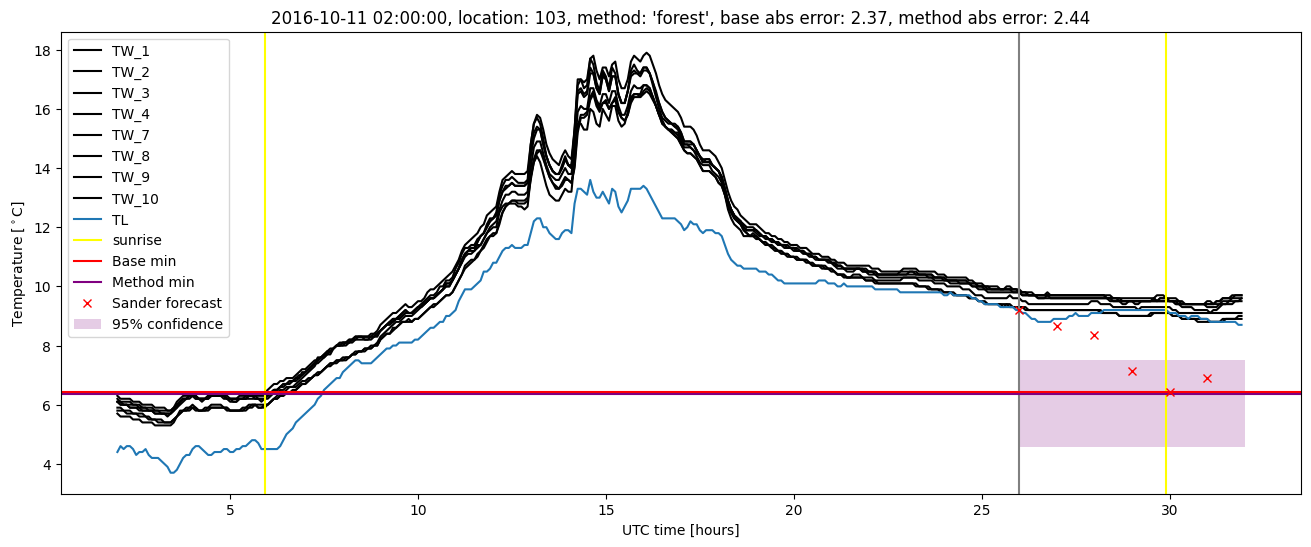
| forest |
winter 2016 |
0.977 |
0.083 |
0.366 |
0.422 |
2.221 |
0.513 |
2.910 |
| baseline |
winter 2017 |
0.991 |
0.048 |
0.518 |
0.506 |
2.371 |
NaN |
NaN |
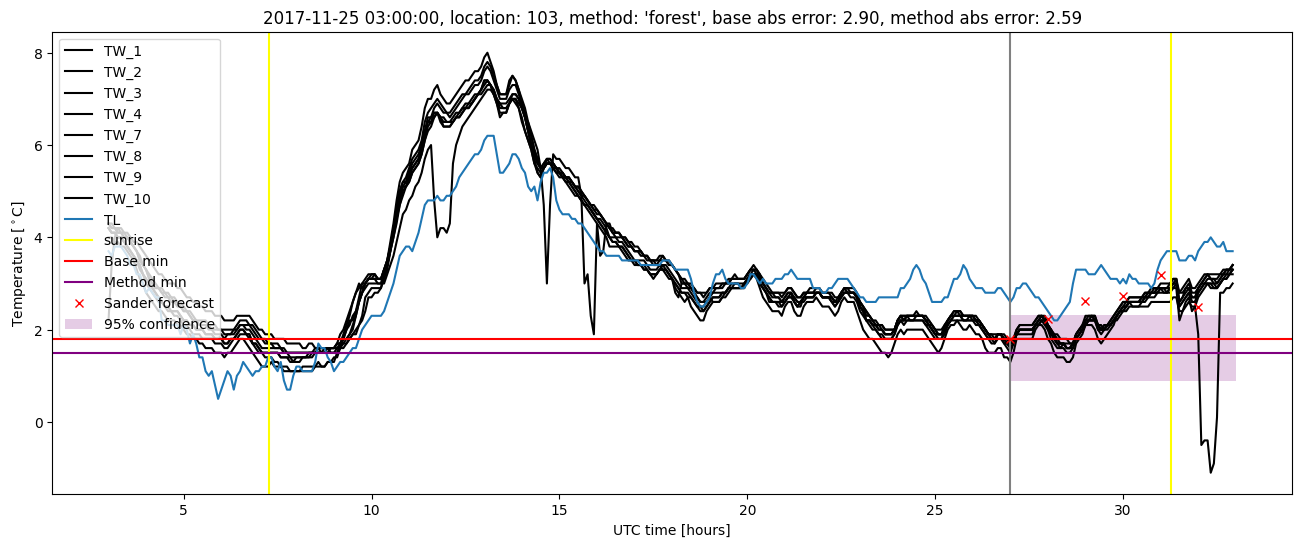
| forest |
winter 2017 |
0.991 |
0.024 |
0.388 |
0.434 |
2.443 |
0.501 |
2.876 |
| baseline |
winter 2018 |
0.984 |
0.161 |
0.458 |
0.478 |
2.899 |
NaN |
NaN |
| forest |
winter 2018 |
0.984 |
0.097 |
0.415 |
0.462 |
2.704 |
0.515 |
3.033 |
| baseline |
winter 2019 |
0.985 |
0.000e+00 |
0.253 |
0.356 |
1.813 |
NaN |
NaN |
| forest |
winter 2019 |
0.985 |
0.000e+00 |
0.192 |
0.332 |
1.282 |
0.500 |
2.422 |
| baseline |
all |
0.987 |
0.092 |
0.416 |
0.457 |
2.899 |
NaN |
NaN |
| forest |
all |
0.983 |
0.058 |
0.344 |
0.414 |
2.704 |
0.508 |
2.822 |
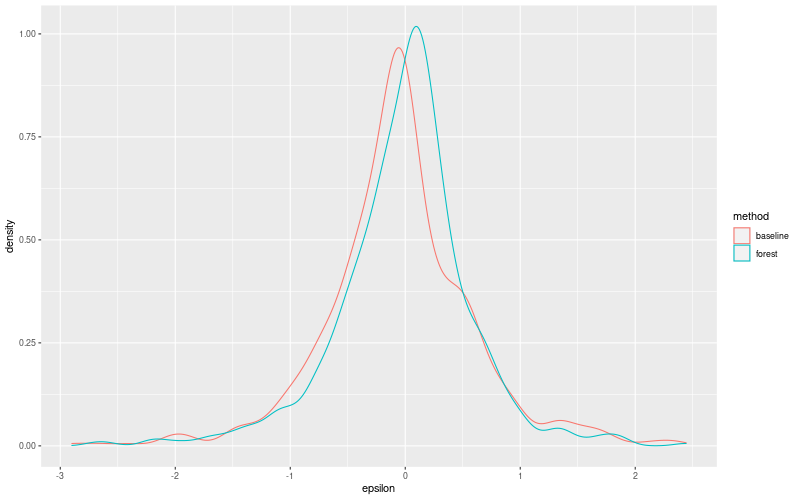
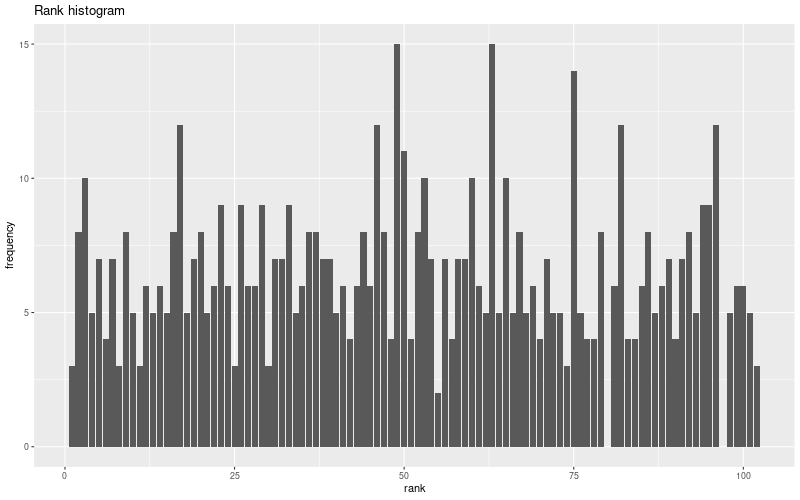
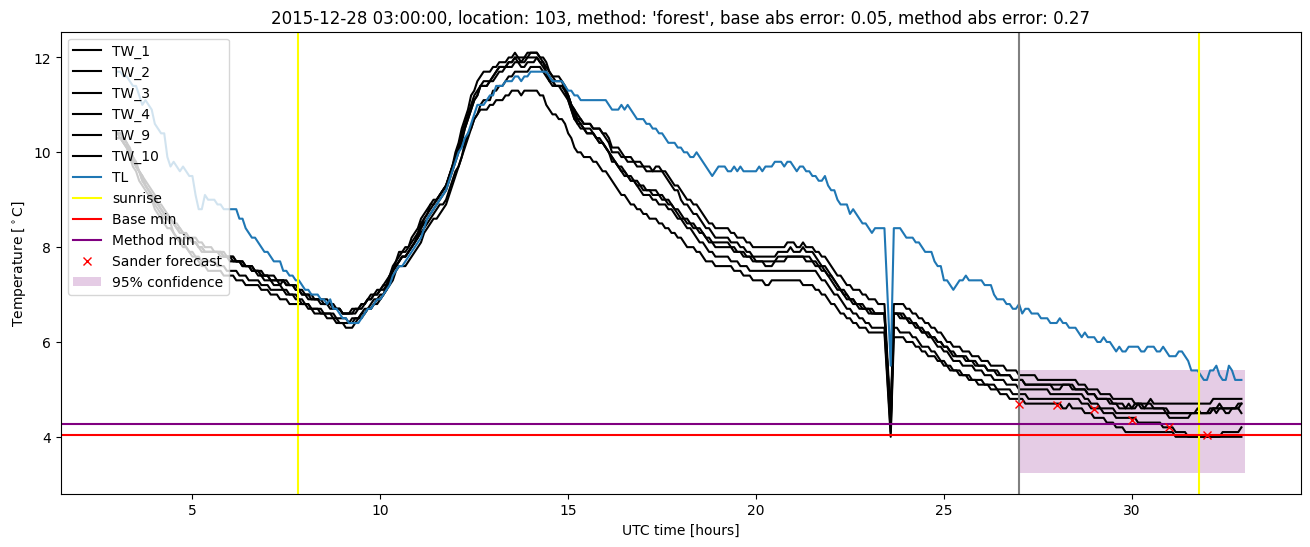
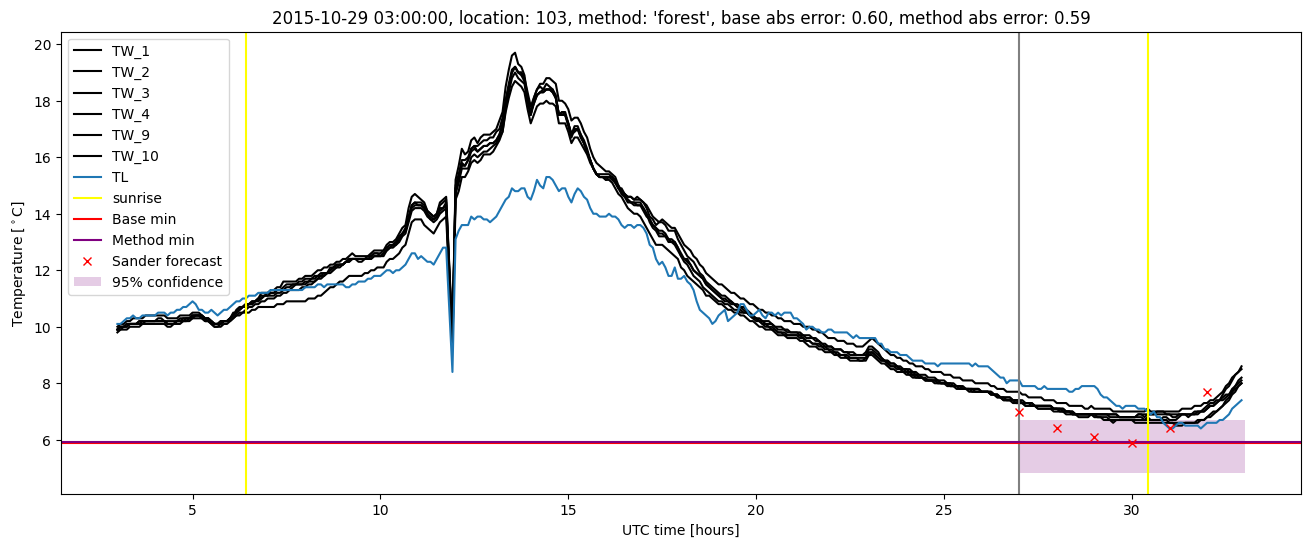
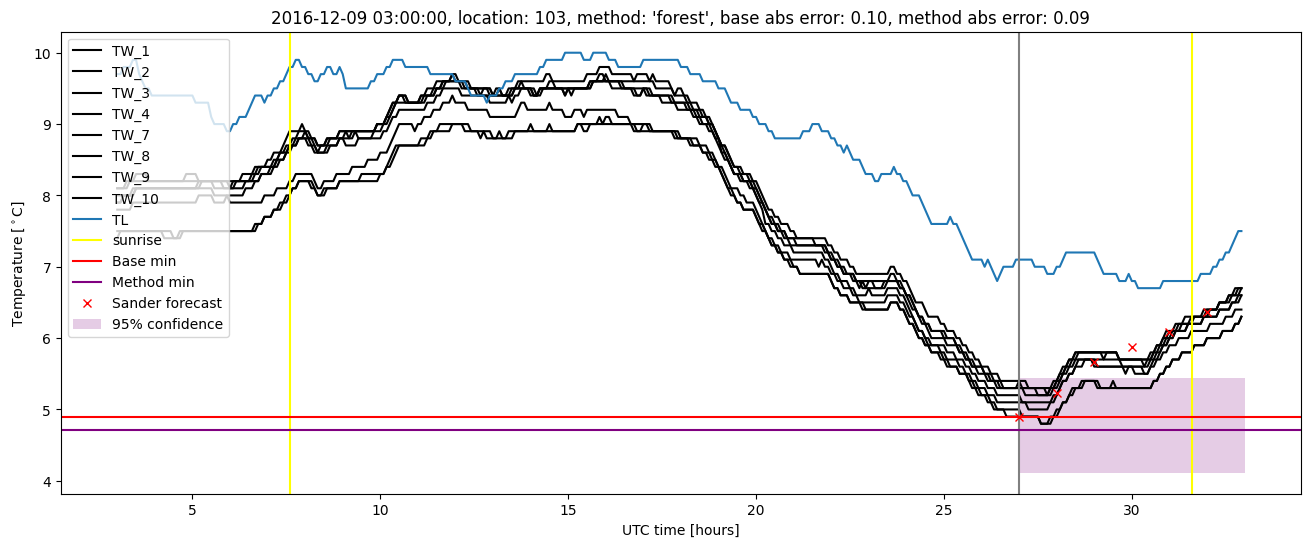
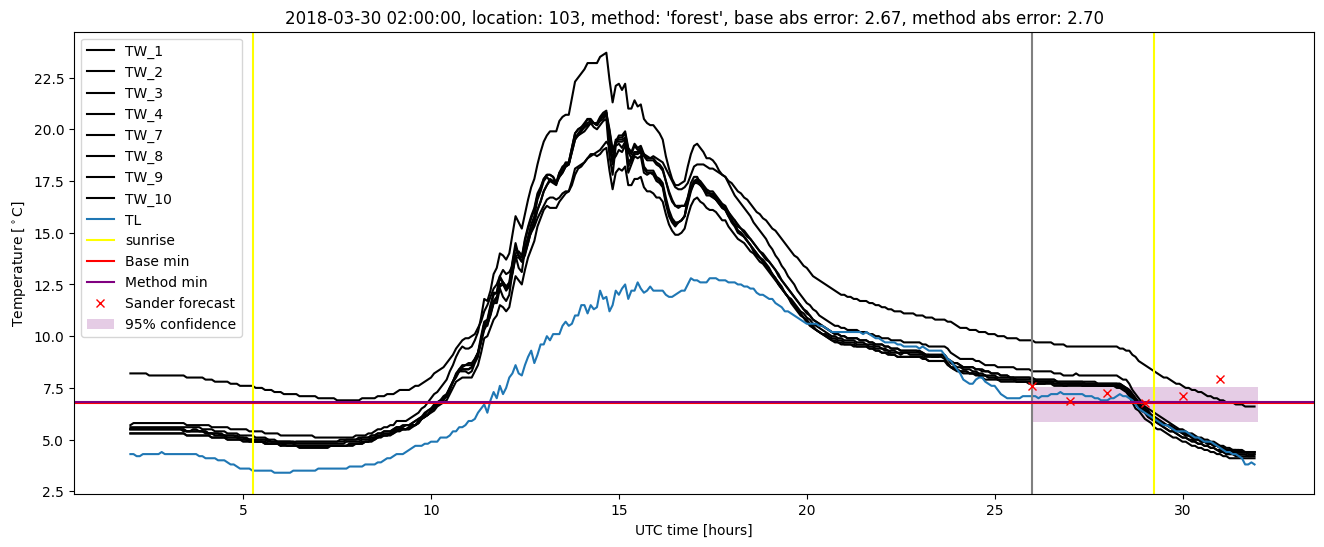
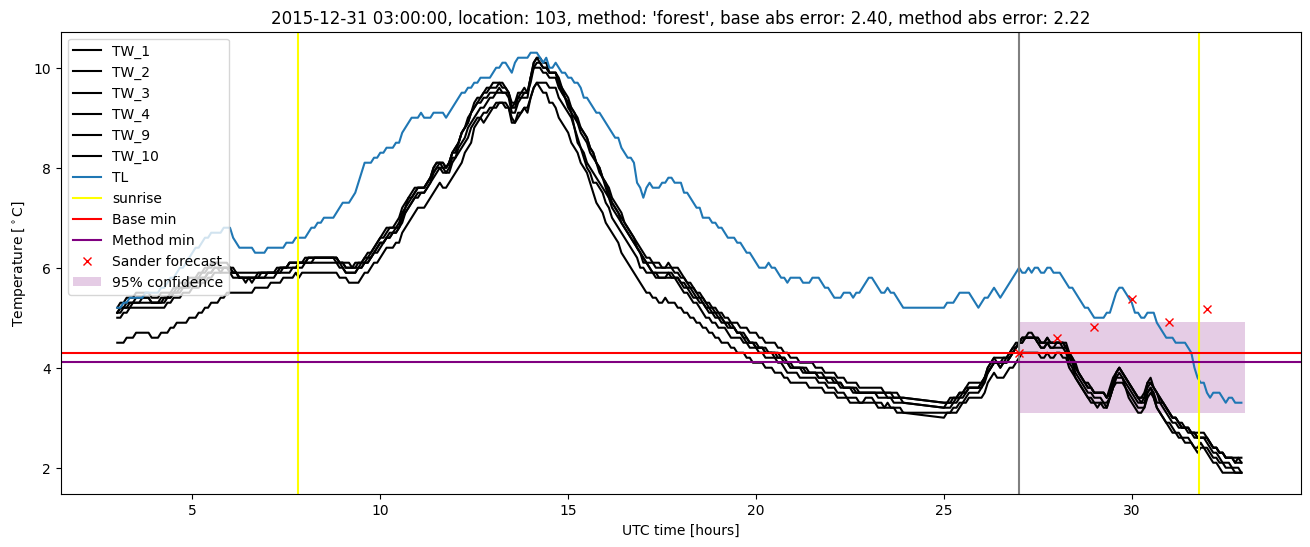
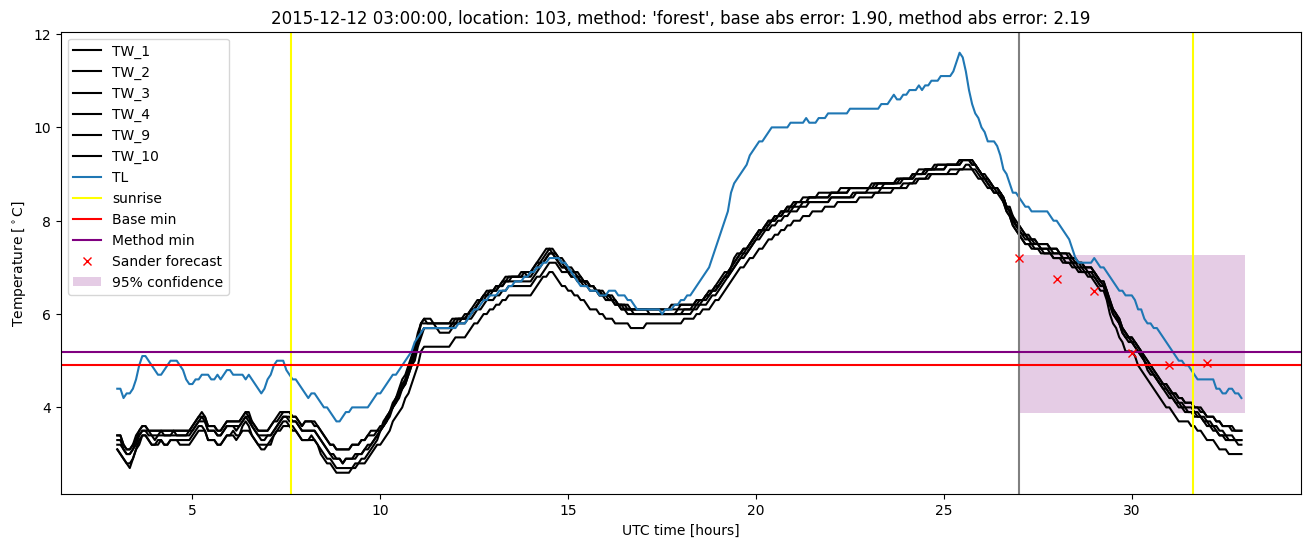
Random forest plots
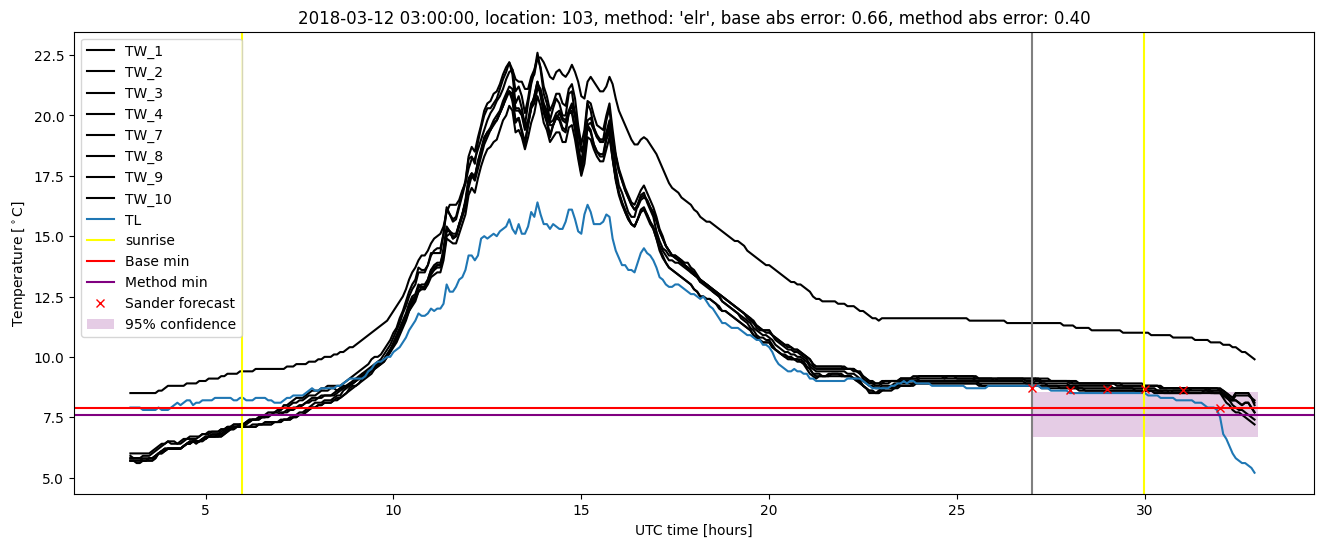
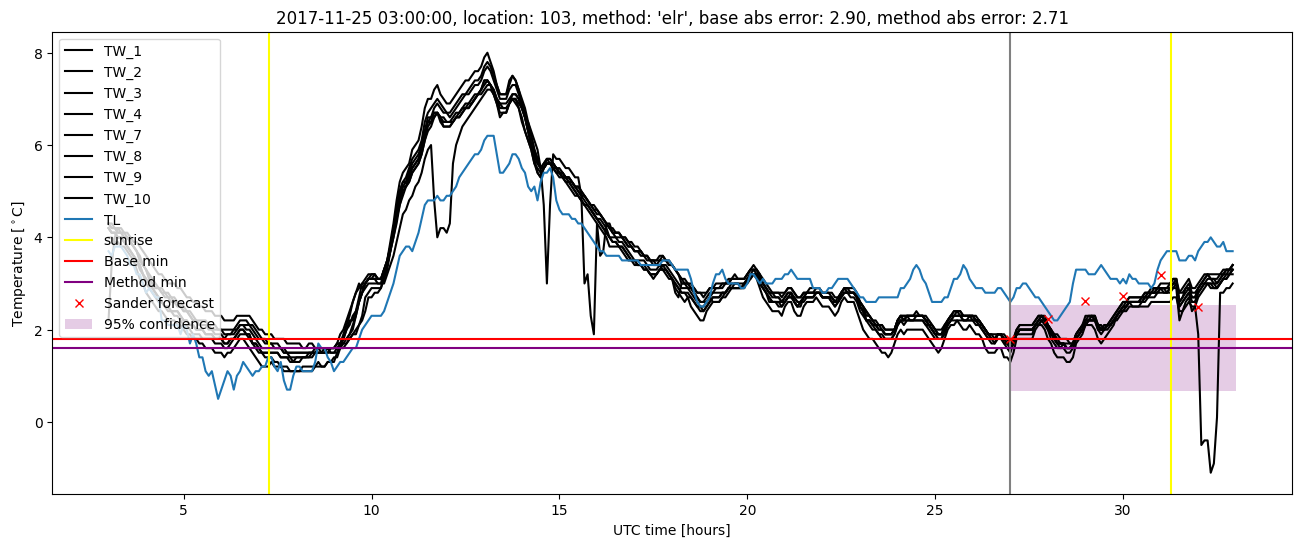
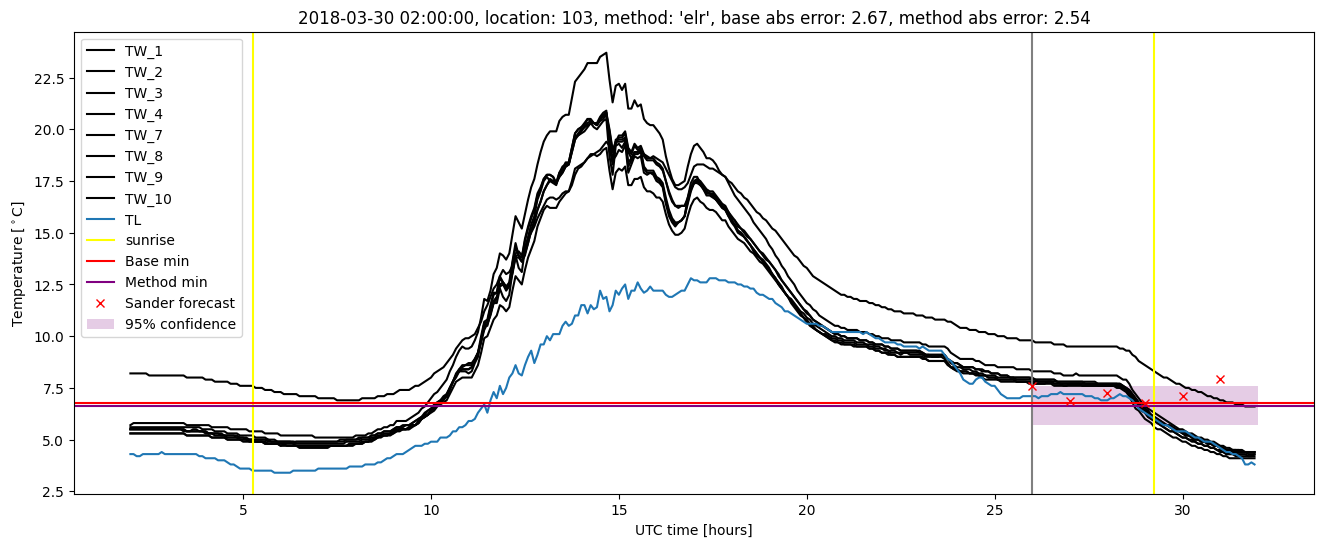
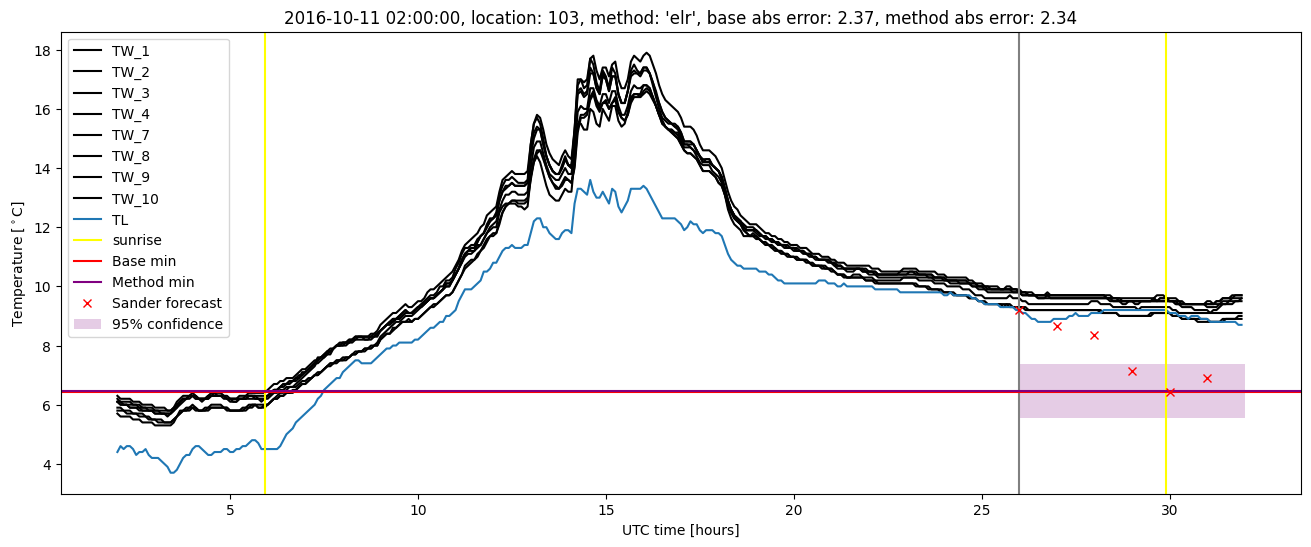
Extended logistic regression results
| names |
period |
power |
significance |
meanSquareError |
absError |
maxError |
CRPS |
IGN |
| baseline |
winter 2016 |
0.988 |
0.111 |
0.427 |
0.476 |
2.399 |
NaN |
NaN |
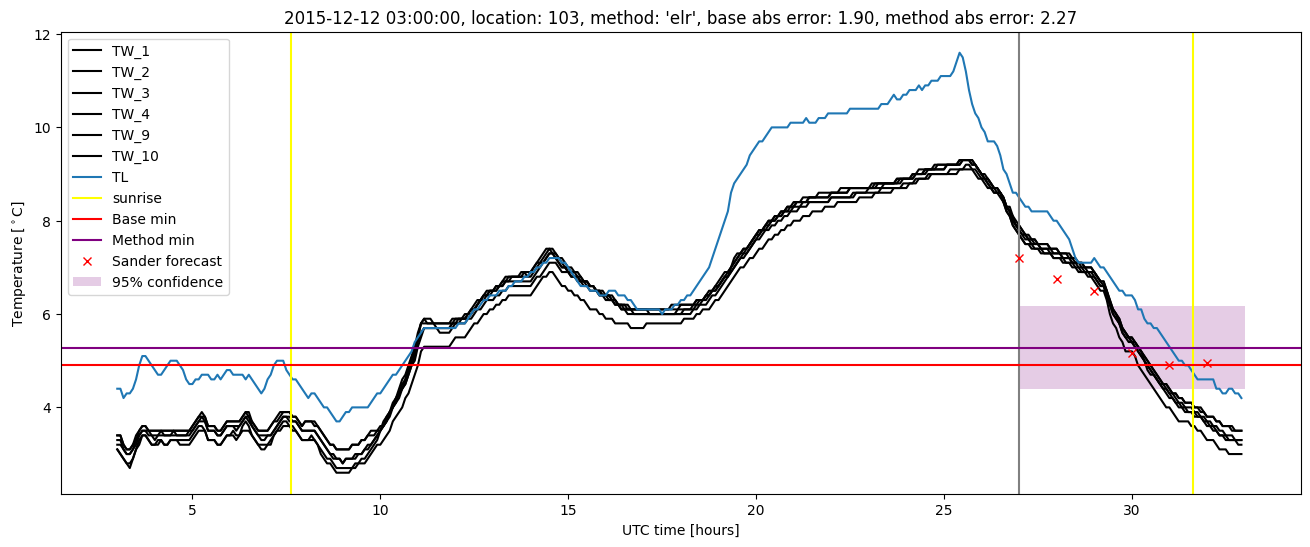
| elr |
winter 2016 |
0.982 |
0.083 |
0.406 |
0.478 |
2.274 |
0.606 |
4.951 |
| baseline |
winter 2017 |
0.991 |
0.048 |
0.518 |
0.506 |
2.371 |
NaN |
NaN |
| elr |
winter 2017 |
0.982 |
0.024 |
0.443 |
0.482 |
2.337 |
0.545 |
3.717 |
| baseline |
winter 2018 |
0.984 |
0.161 |
0.458 |
0.478 |
2.899 |
NaN |
NaN |
| elr |
winter 2018 |
1.000 |
0.065 |
0.412 |
0.468 |
2.706 |
0.580 |
3.891 |
| baseline |
winter 2019 |
0.985 |
0.000e+00 |
0.253 |
0.356 |
1.813 |
NaN |
NaN |
| elr |
winter 2019 |
0.993 |
0.000e+00 |
0.232 |
0.384 |
1.287 |
0.550 |
3.206 |
| baseline |
all |
0.987 |
0.092 |
0.416 |
0.457 |
2.899 |
NaN |
NaN |
| elr |
all |
0.989 |
0.050 |
0.377 |
0.456 |
2.706 |
0.573 |
4.027 |
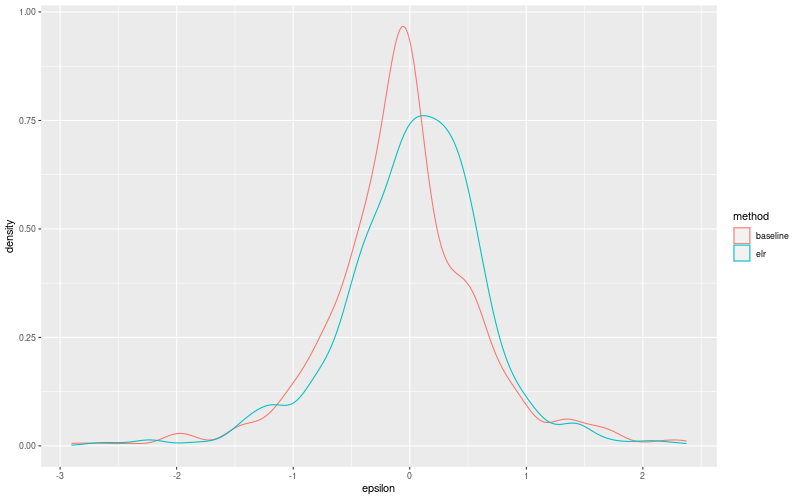
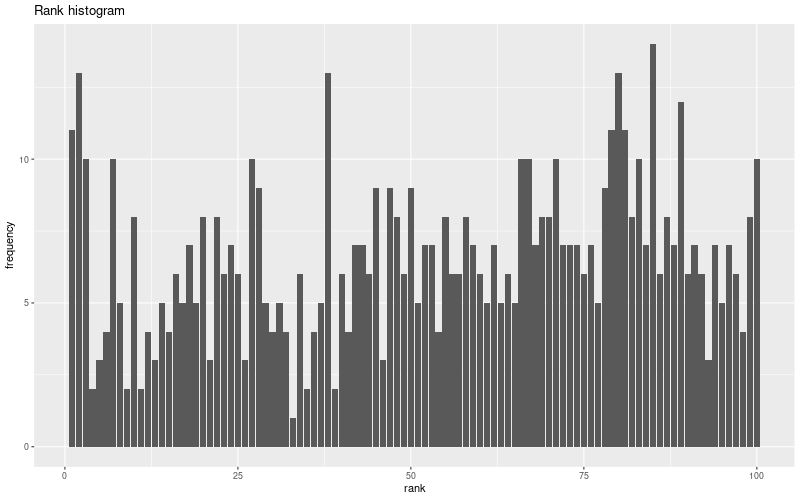
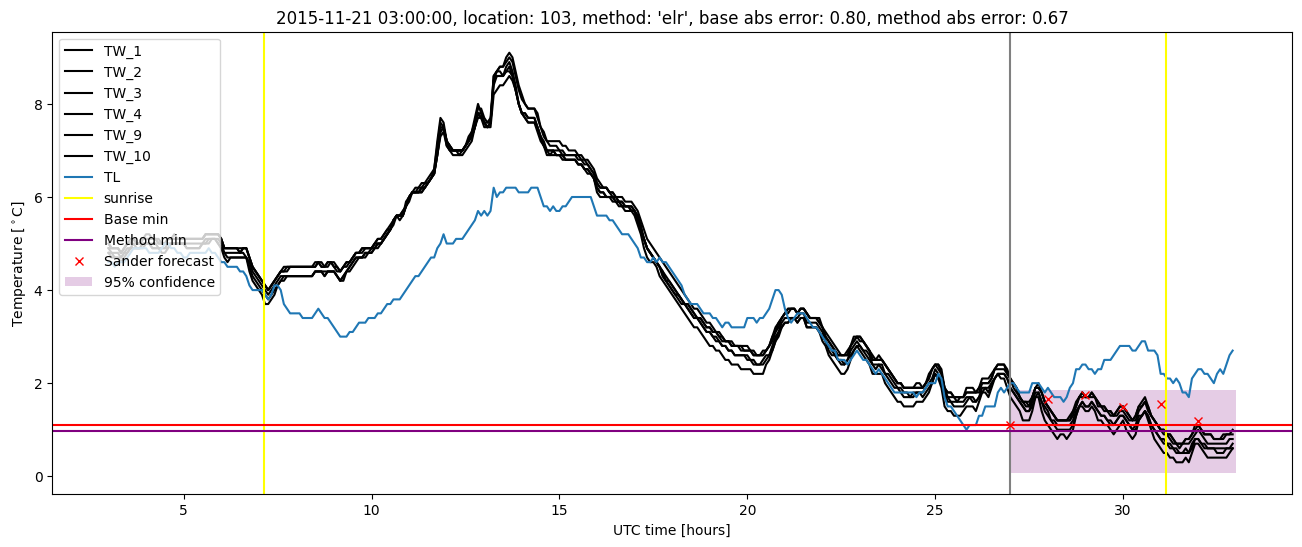
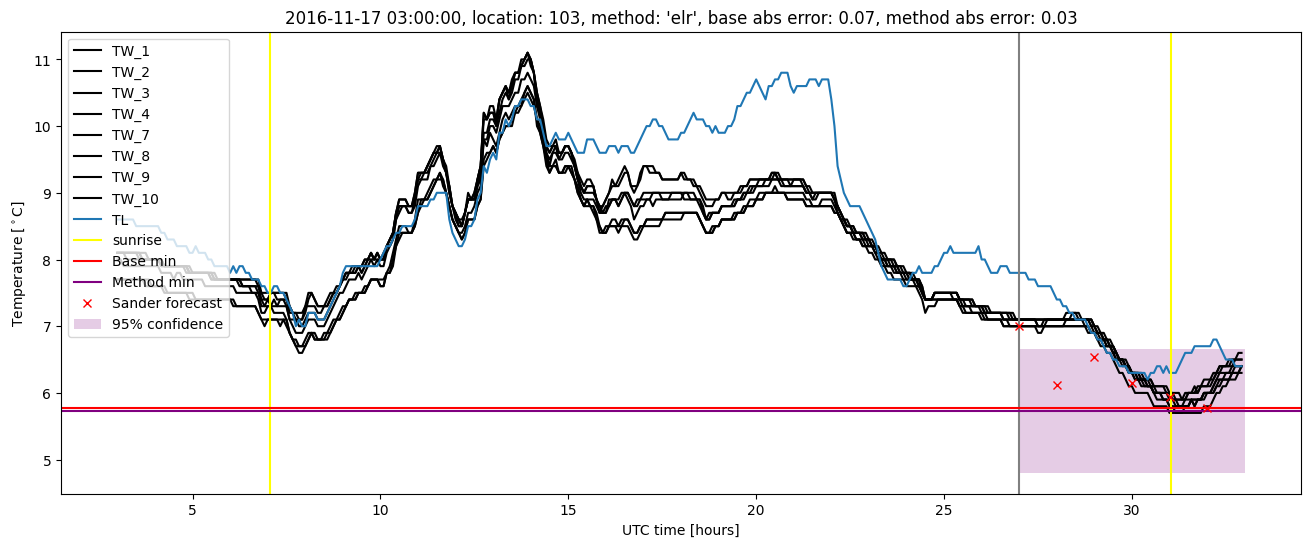
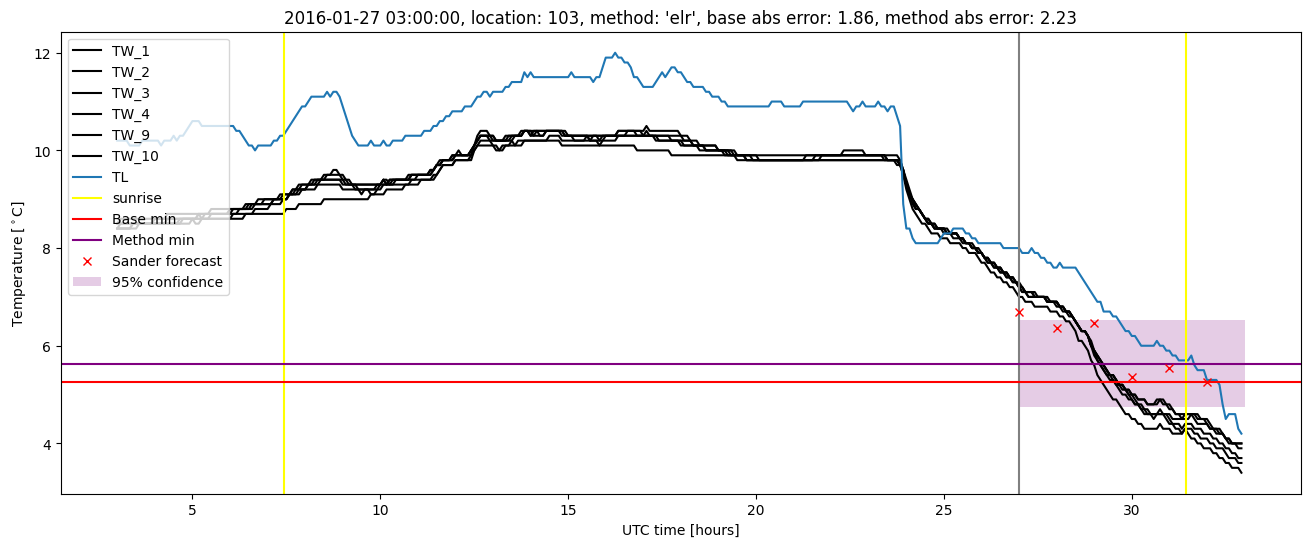
Extended logistic regression plots