GMS location: 102
Random forest results
| names |
period |
power |
significance |
meanSquareError |
absError |
maxError |
CRPS |
IGN |
| baseline |
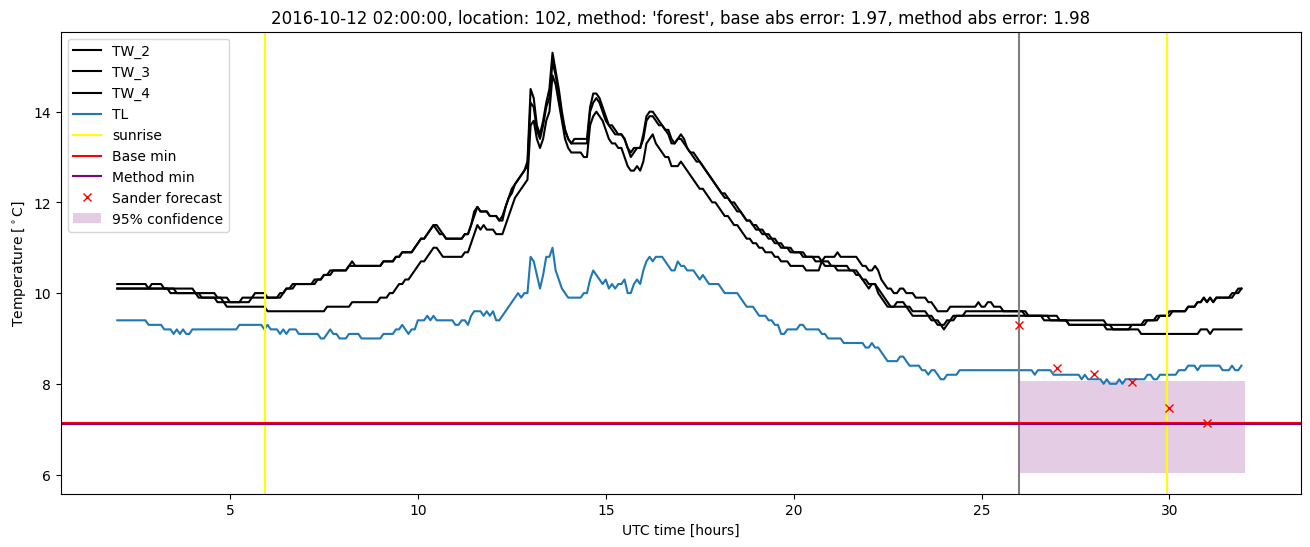
winter 2016 |
0.994 |
0.069 |
0.395 |
0.461 |
2.353 |
NaN |
NaN |
| forest |
winter 2016 |
0.983 |
0.035 |
0.295 |
0.394 |
2.144 |
0.458 |
3.561 |
| baseline |
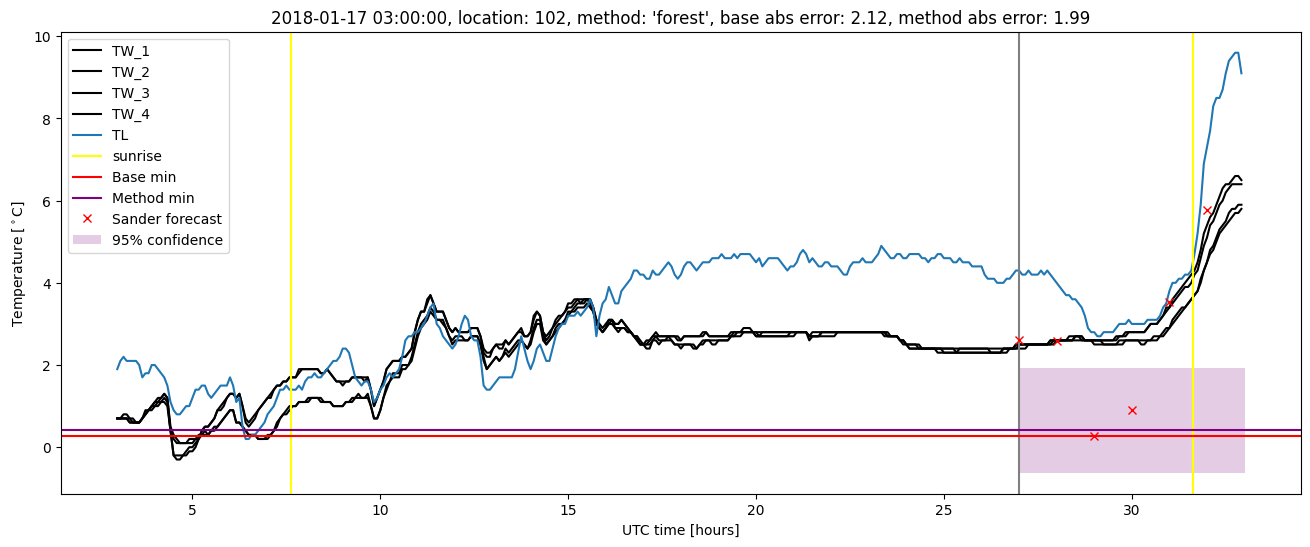
winter 2017 |
0.974 |
0.081 |
0.560 |
0.527 |
2.991 |
NaN |
NaN |
| forest |
winter 2017 |
0.974 |
0.027 |
0.397 |
0.451 |
2.138 |
0.462 |
3.294 |
| baseline |
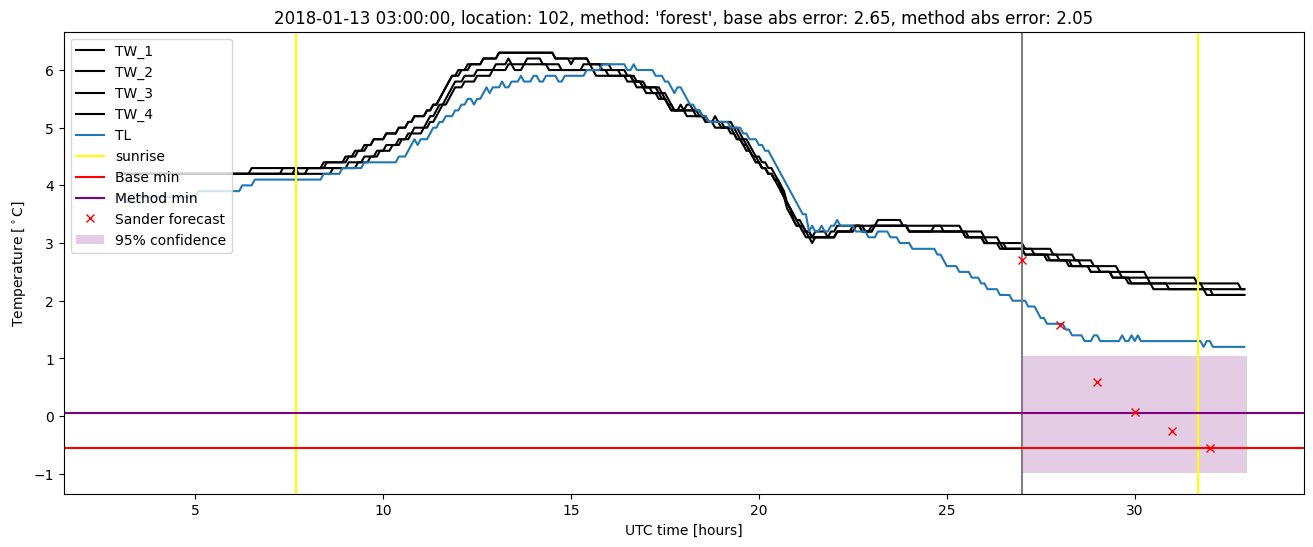
winter 2018 |
0.986 |
0.111 |
0.373 |
0.458 |
2.652 |
NaN |
NaN |
| forest |
winter 2018 |
0.993 |
0.083 |
0.303 |
0.418 |
2.053 |
0.469 |
2.919 |
| baseline |
winter 2019 |
1.000 |
0.000e+00 |
0.258 |
0.357 |
1.823 |
NaN |
NaN |
| forest |
winter 2019 |
1.000 |
0.000e+00 |
0.180 |
0.323 |
1.334 |
0.434 |
2.498 |
| baseline |
all |
0.988 |
0.085 |
0.411 |
0.463 |
2.991 |
NaN |
NaN |
| forest |
all |
0.986 |
0.047 |
0.308 |
0.406 |
2.144 |
0.459 |
3.172 |
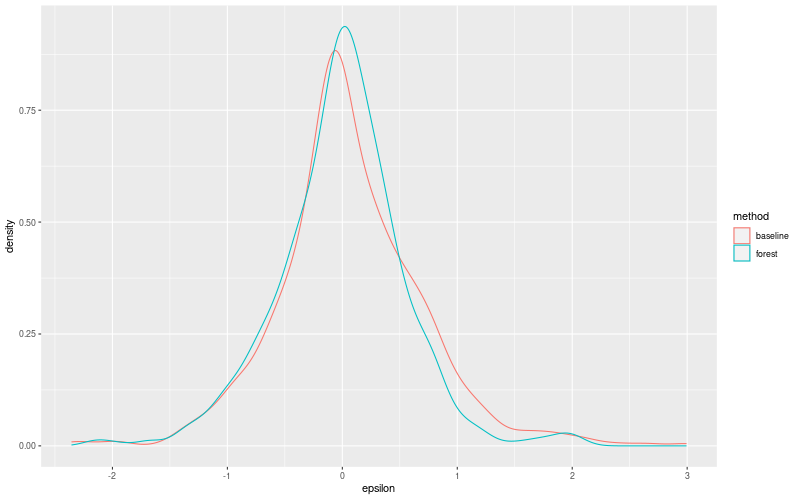
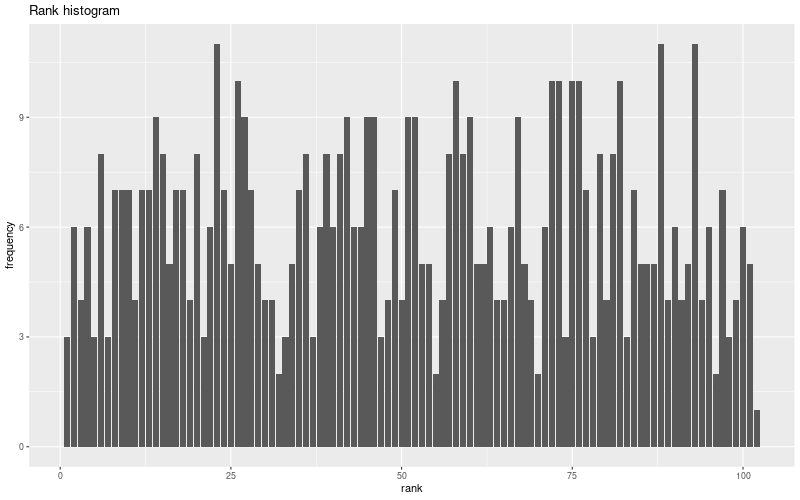
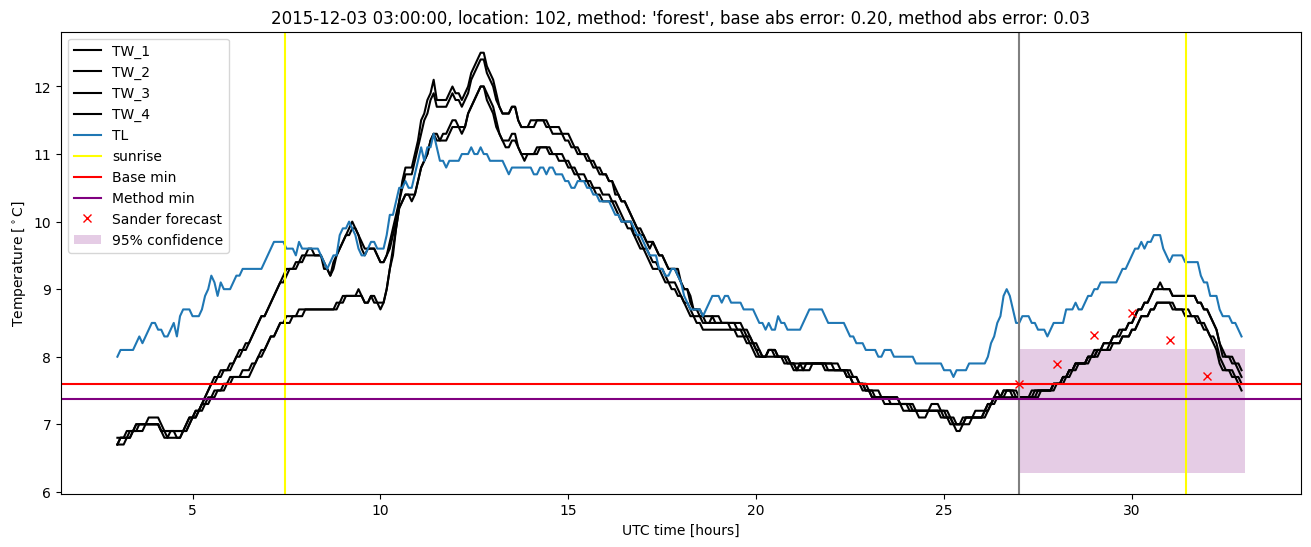
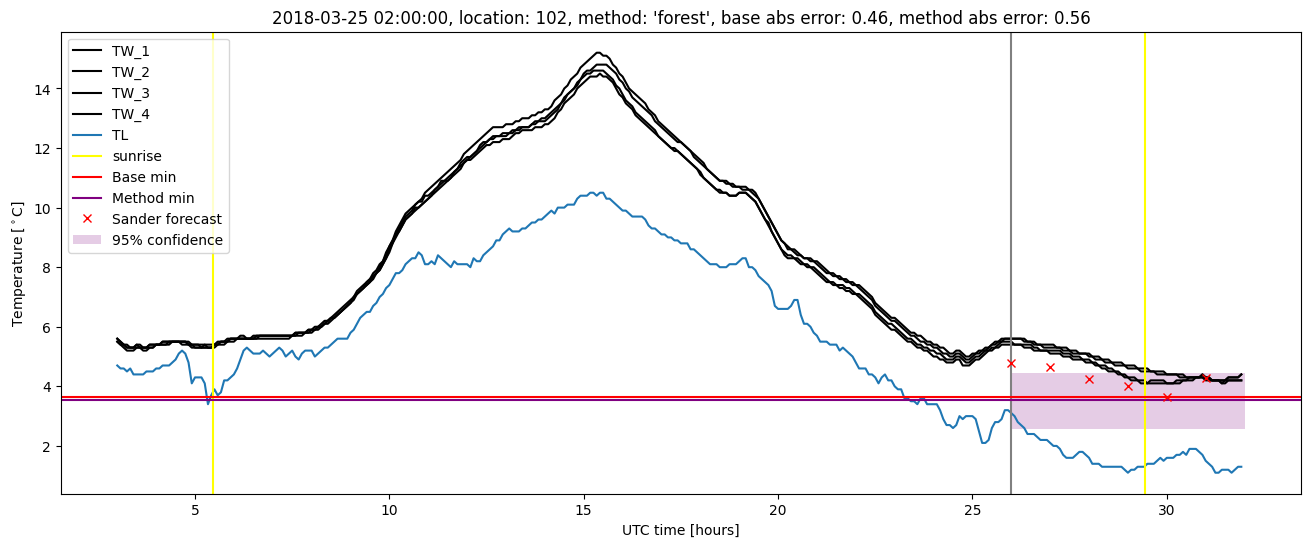
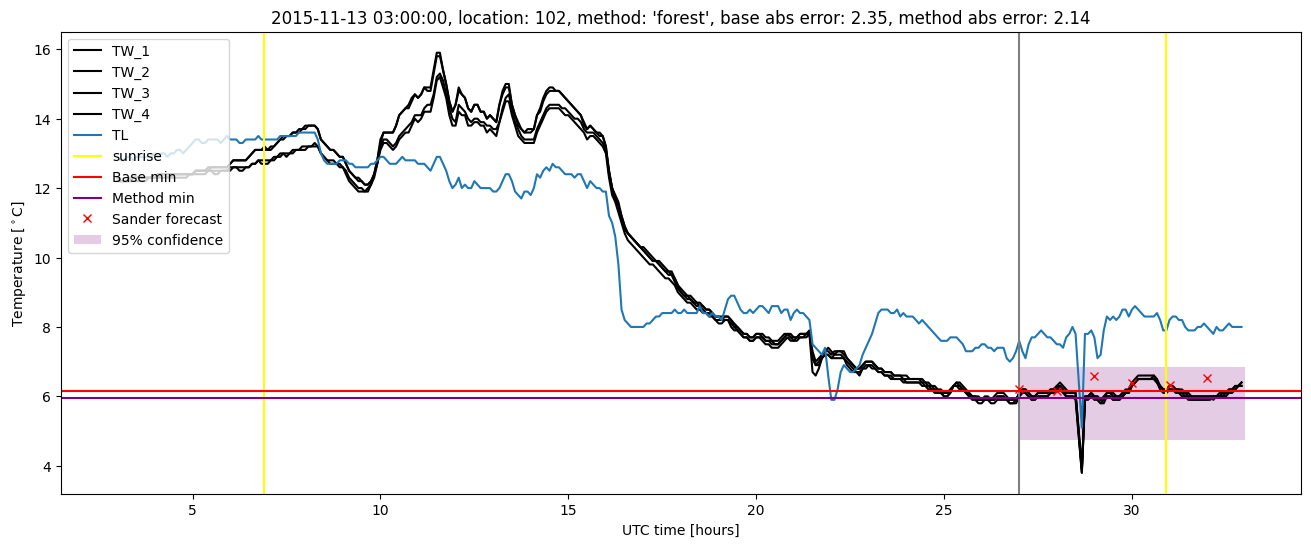
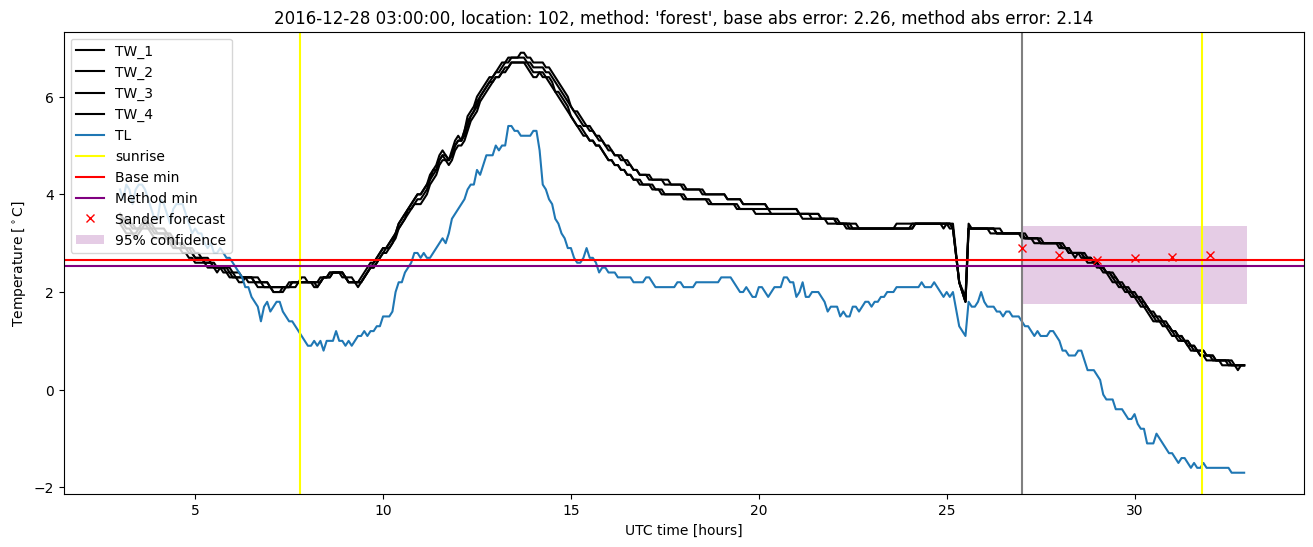
Random forest plots

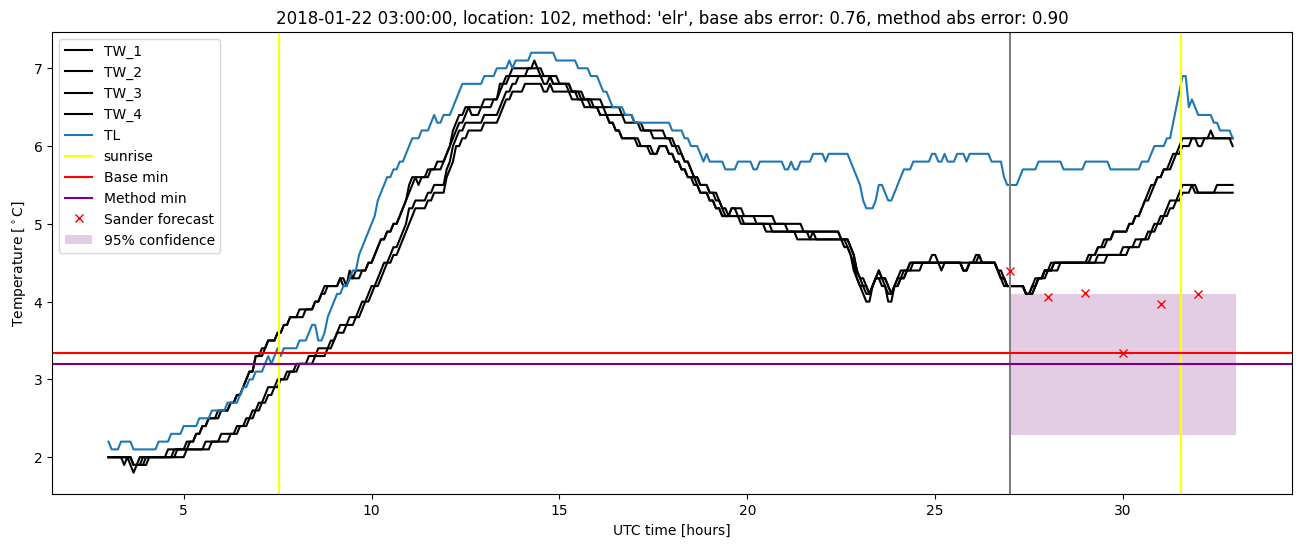
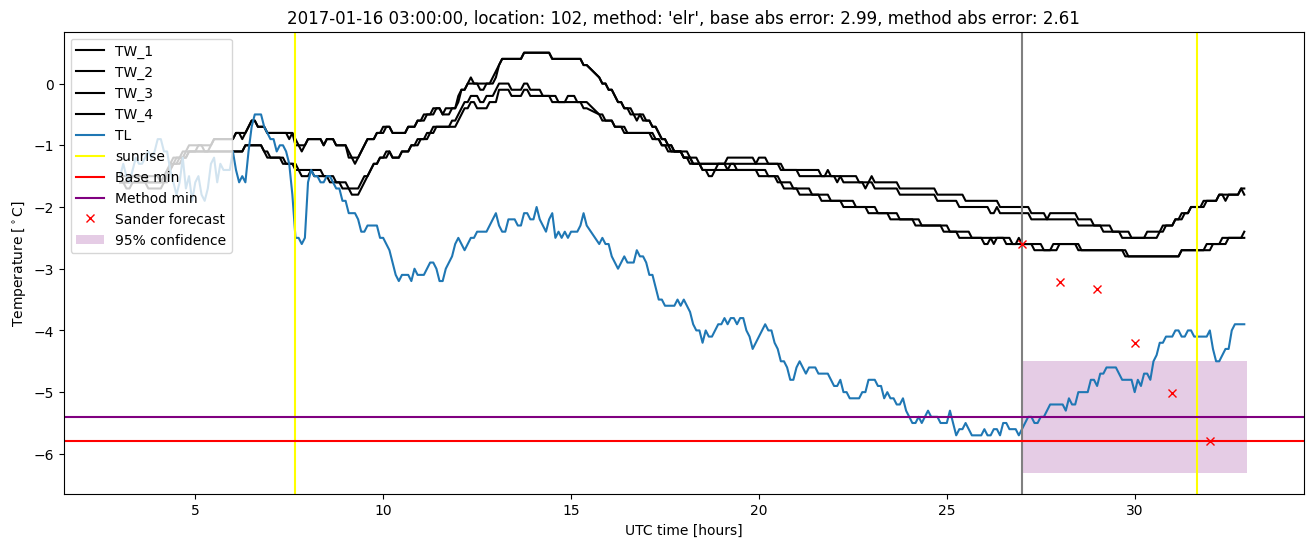
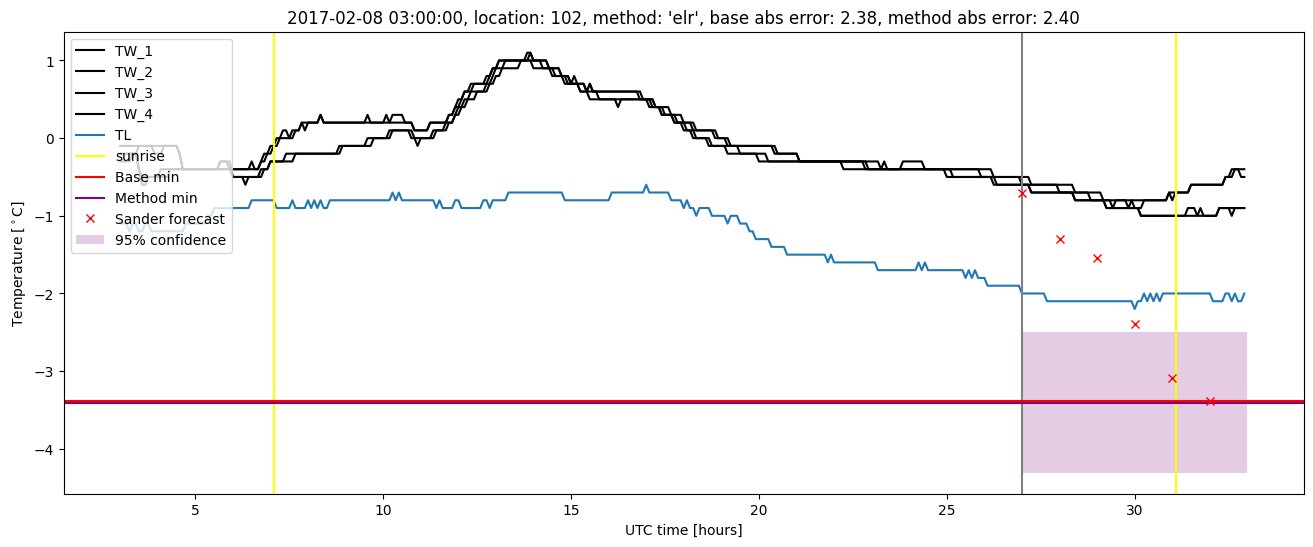
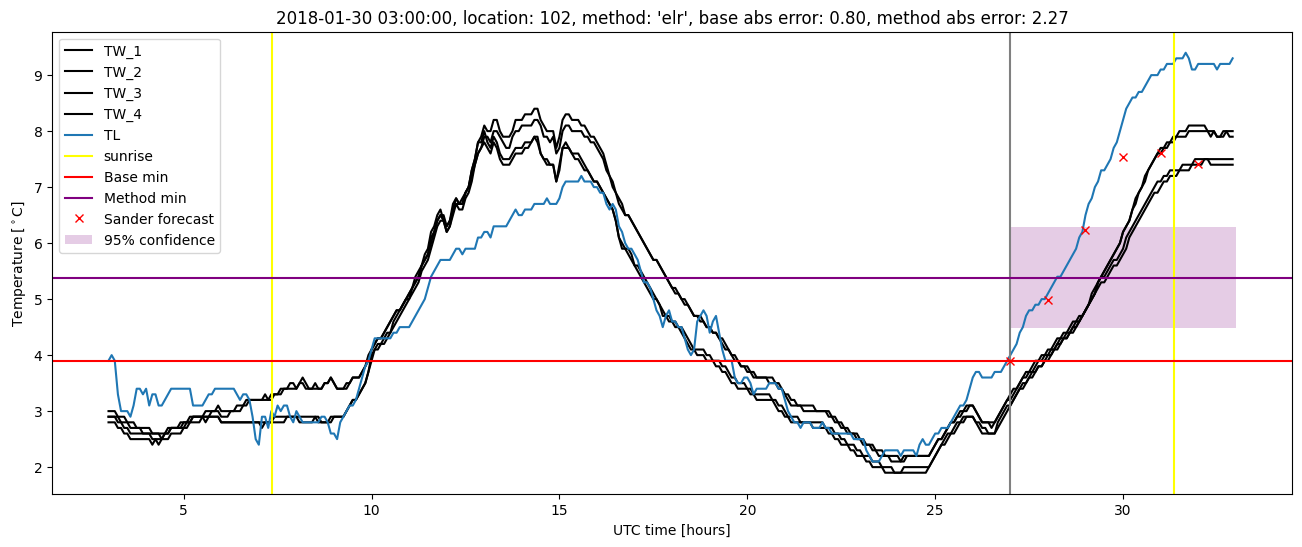
Extended logistic regression results
| names |
period |
power |
significance |
meanSquareError |
absError |
maxError |
CRPS |
IGN |
| baseline |
winter 2016 |
0.994 |
0.069 |
0.395 |
0.461 |
2.353 |
NaN |
NaN |
| elr |
winter 2016 |
0.989 |
0.035 |
0.339 |
0.442 |
1.959 |
0.539 |
4.180 |
| baseline |
winter 2017 |
0.974 |
0.081 |
0.560 |
0.527 |
2.991 |
NaN |
NaN |
| elr |
winter 2017 |
0.974 |
0.027 |
0.458 |
0.490 |
2.607 |
0.484 |
3.198 |
| baseline |
winter 2018 |
0.986 |
0.111 |
0.373 |
0.458 |
2.652 |
NaN |
NaN |
| elr |
winter 2018 |
0.993 |
0.111 |
0.346 |
0.449 |
2.273 |
0.526 |
3.640 |
| baseline |
winter 2019 |
1.000 |
0.000e+00 |
0.258 |
0.357 |
1.823 |
NaN |
NaN |
| elr |
winter 2019 |
1.000 |
0.000e+00 |
0.260 |
0.404 |
1.620 |
0.494 |
2.989 |
| baseline |
all |
0.988 |
0.085 |
0.411 |
0.463 |
2.991 |
NaN |
NaN |
| elr |
all |
0.988 |
0.057 |
0.360 |
0.451 |
2.607 |
0.516 |
3.629 |
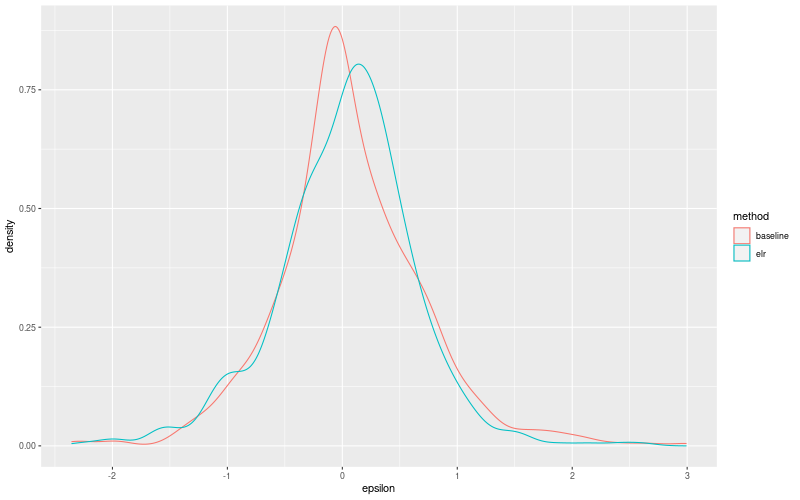
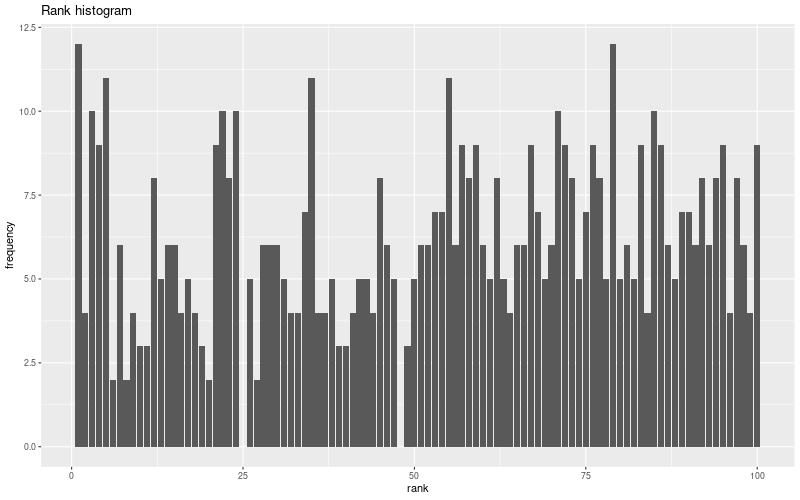
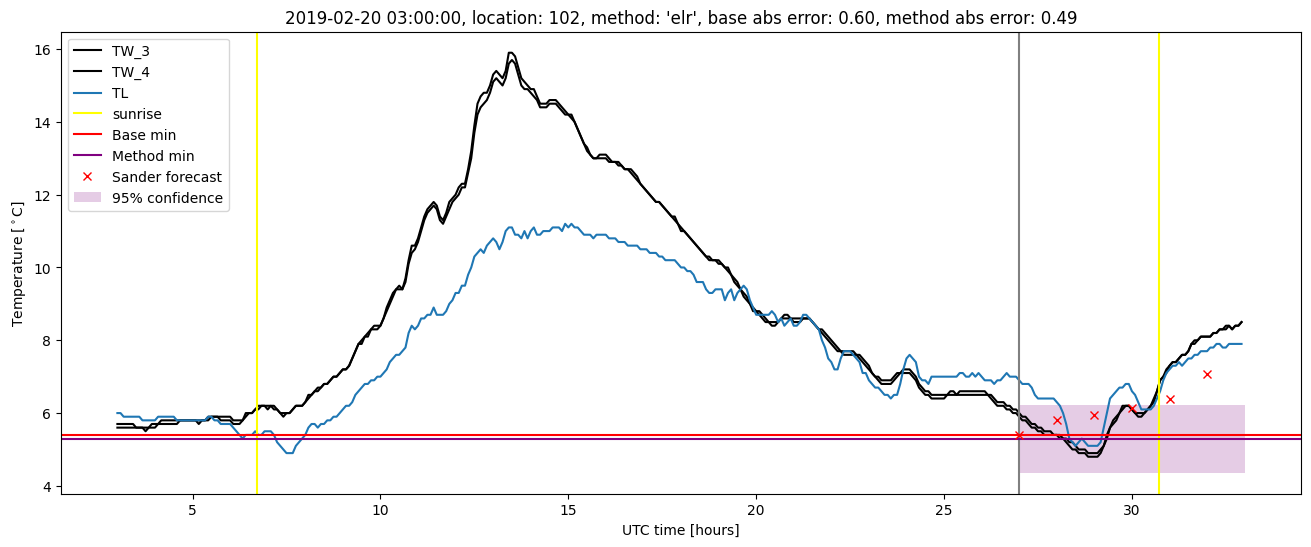
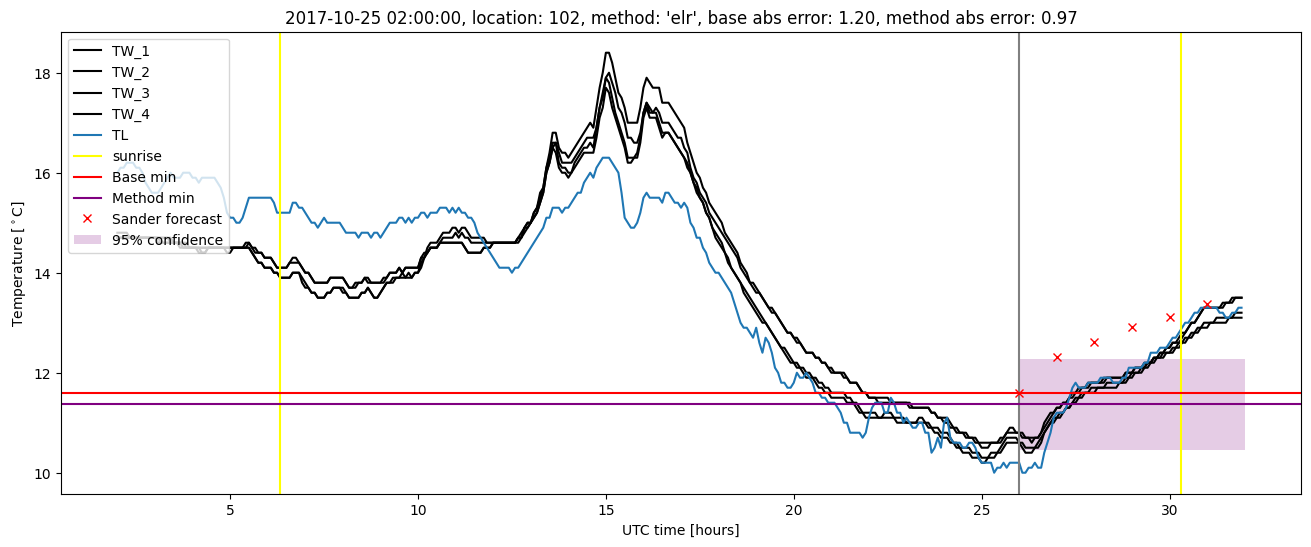
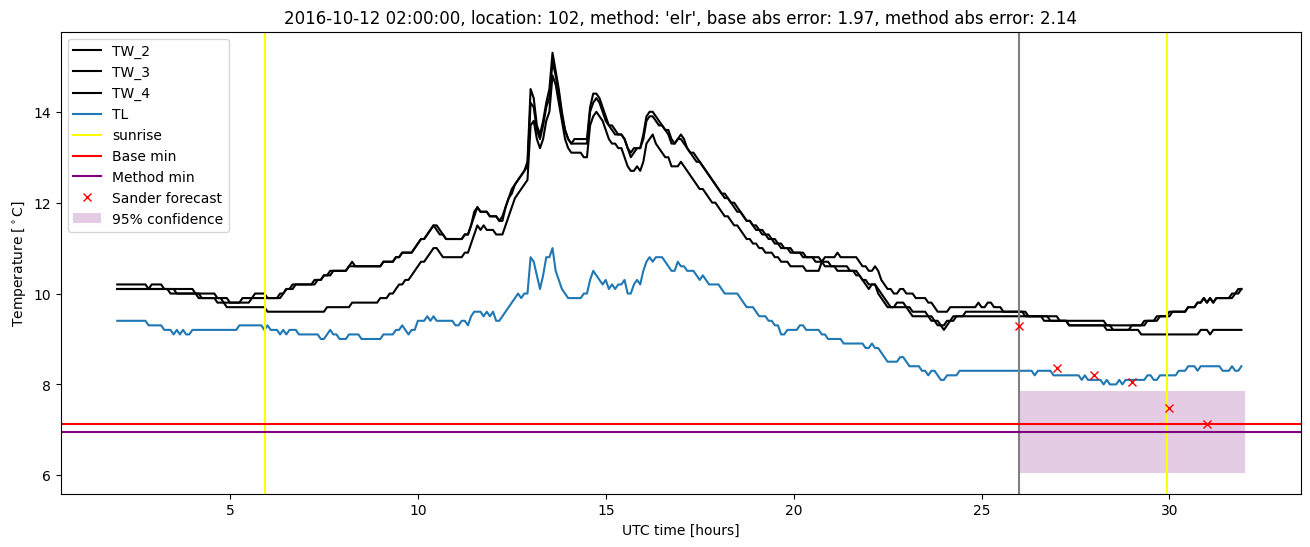
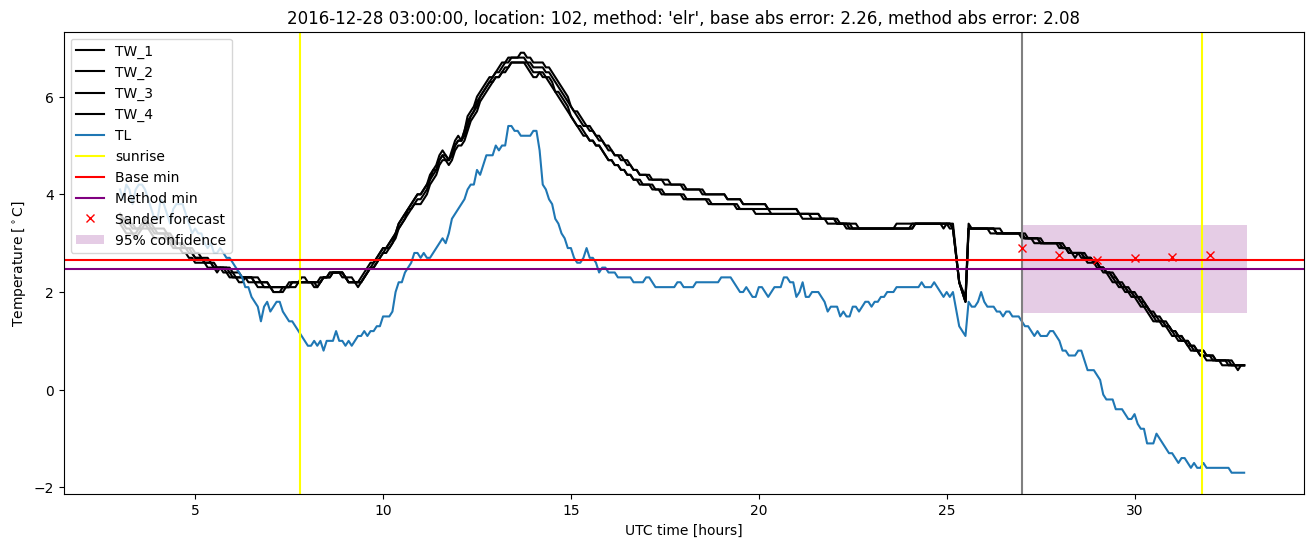
Extended logistic regression plots