GMS location: 1013
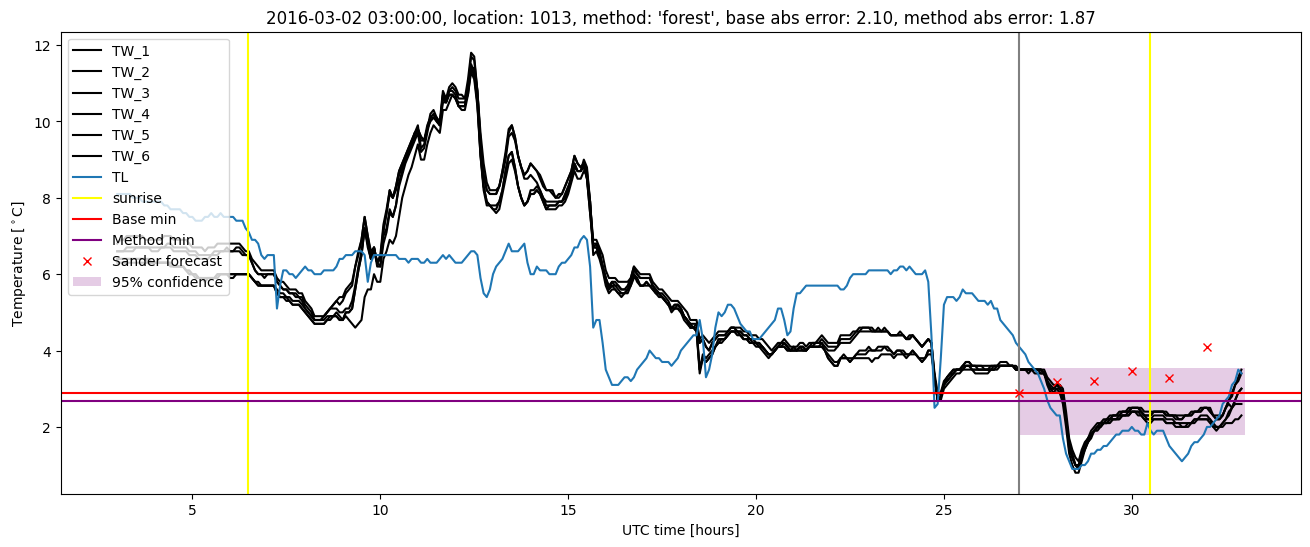
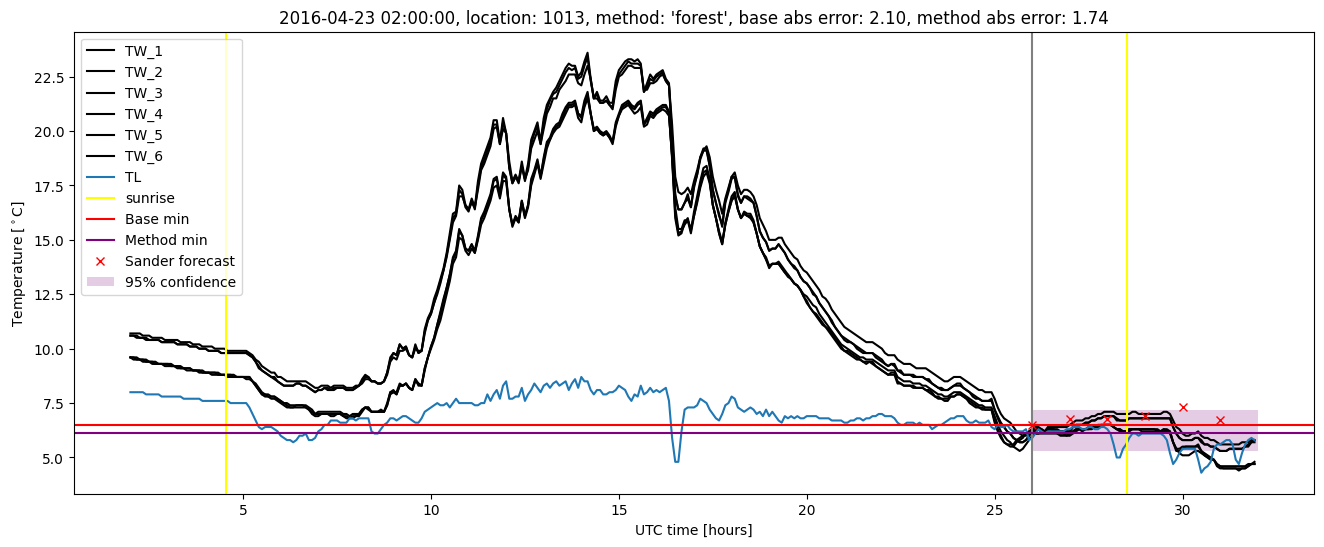
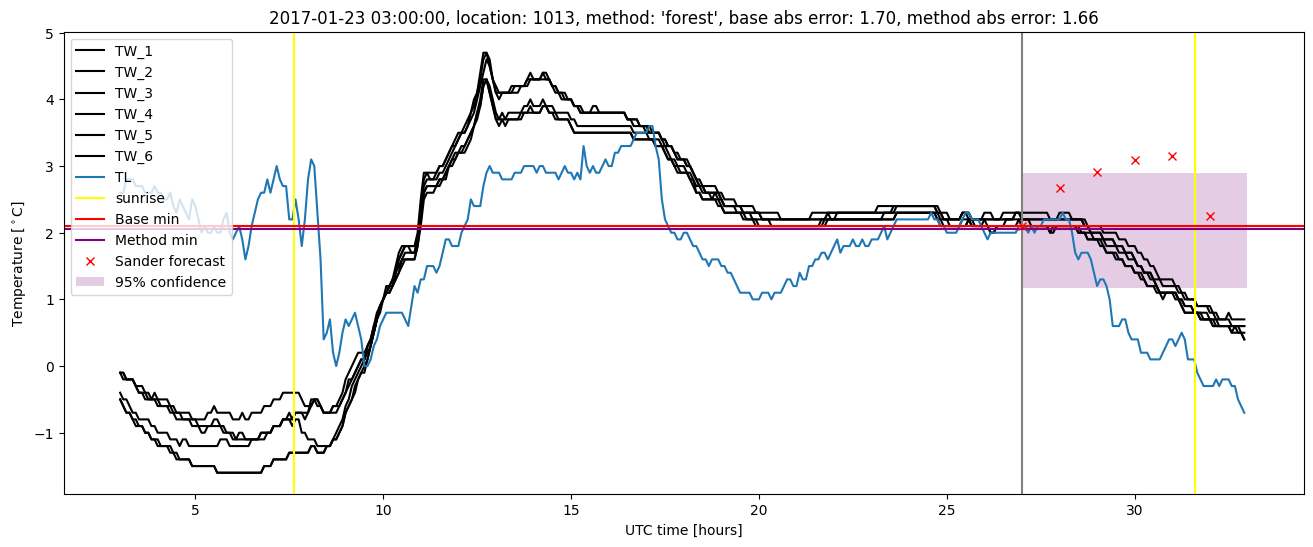
Random forest results
| names |
period |
power |
significance |
meanSquareError |
absError |
maxError |
CRPS |
IGN |
| baseline |
winter 2016 |
0.995 |
0.167 |
0.320 |
0.411 |
2.101 |
NaN |
NaN |
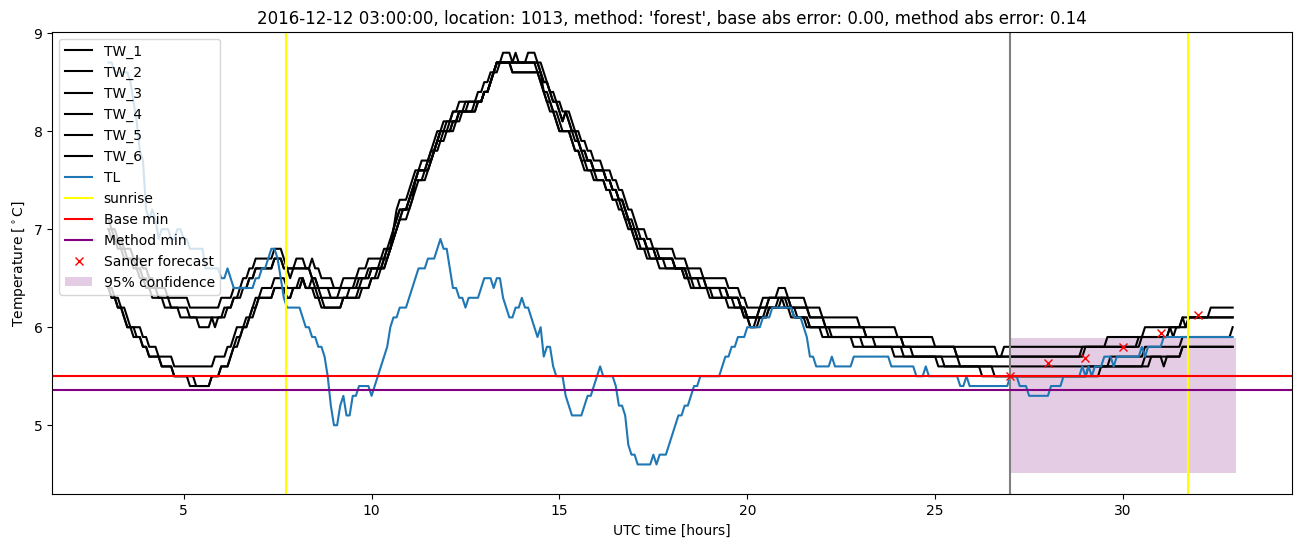
| forest |
winter 2016 |
0.995 |
0.167 |
0.276 |
0.376 |
1.874 |
0.605 |
6.698 |
| baseline |
winter 2017 |
0.985 |
0.000e+00 |
0.343 |
0.402 |
2.101 |
NaN |
NaN |
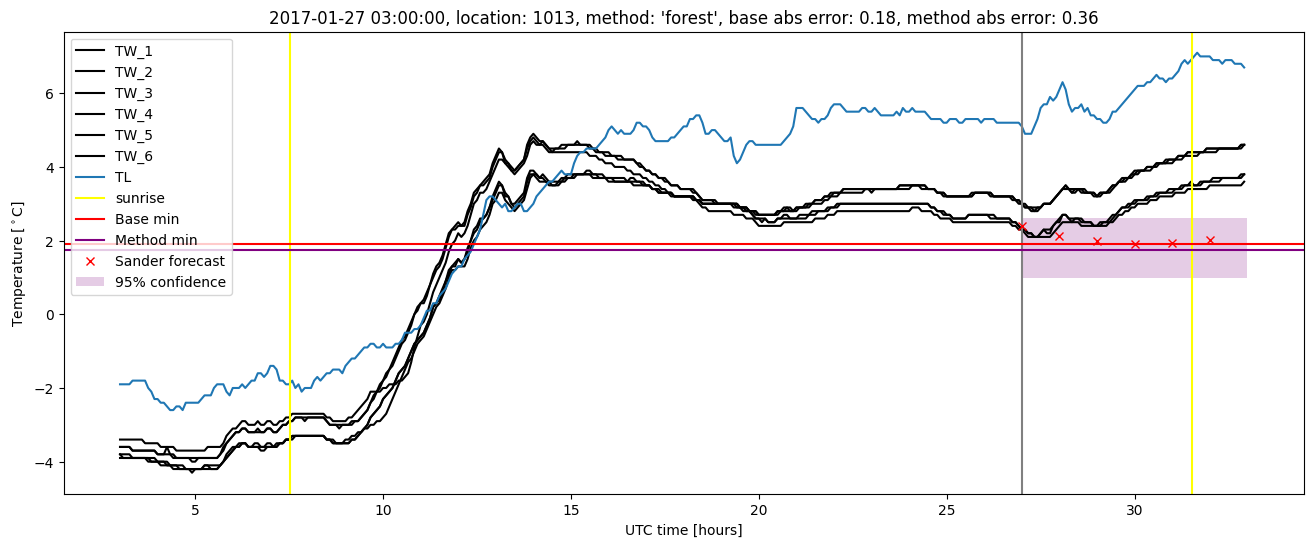
| forest |
winter 2017 |
0.978 |
0.000e+00 |
0.309 |
0.381 |
2.169 |
0.576 |
5.836 |
| baseline |
winter 2018 |
0.994 |
0.111 |
0.226 |
0.358 |
1.781 |
NaN |
NaN |
| forest |
winter 2018 |
1.000 |
0.111 |
0.174 |
0.318 |
1.444 |
0.586 |
5.136 |
| baseline |
winter 2019 |
0.993 |
0.222 |
0.249 |
0.375 |
1.832 |
NaN |
NaN |
| forest |
winter 2019 |
1.000 |
0.222 |
0.222 |
0.338 |
1.625 |
0.607 |
5.418 |
| baseline |
all |
0.992 |
0.100 |
0.285 |
0.388 |
2.101 |
NaN |
NaN |
| forest |
all |
0.994 |
0.100 |
0.245 |
0.354 |
2.169 |
0.594 |
5.823 |
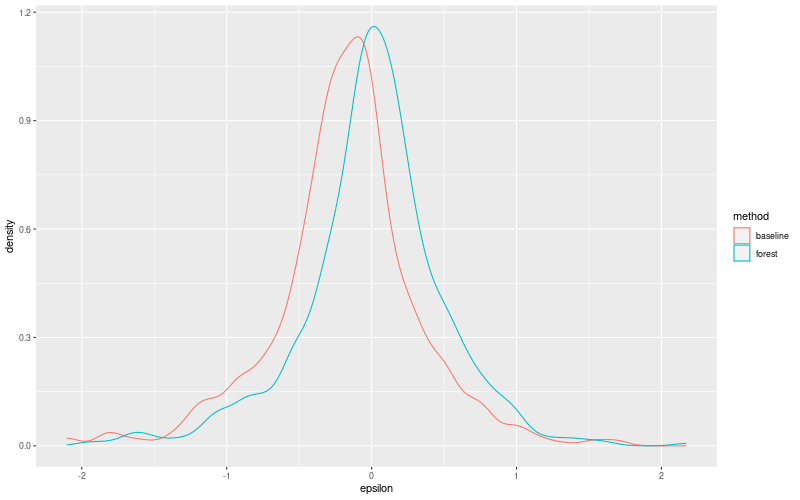
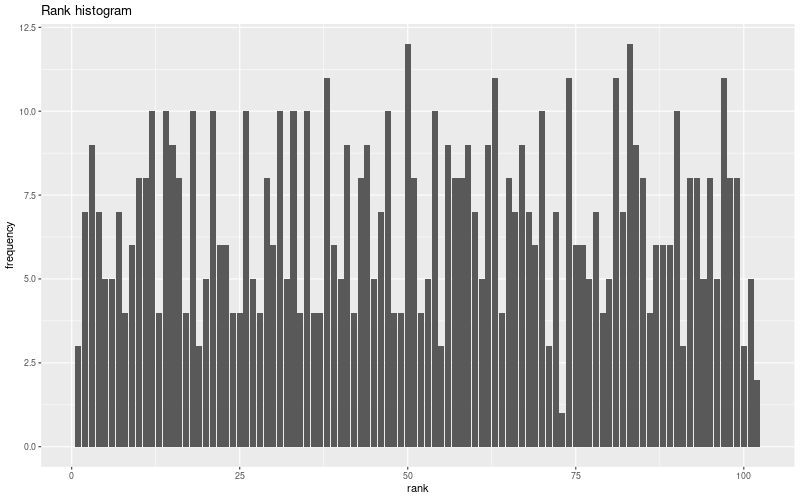
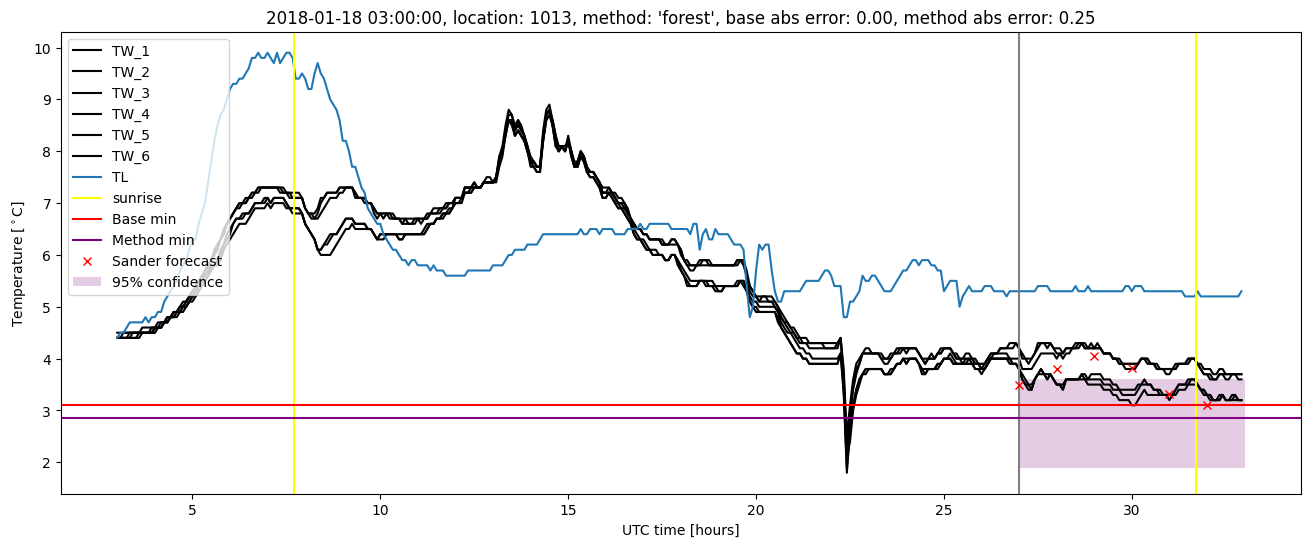
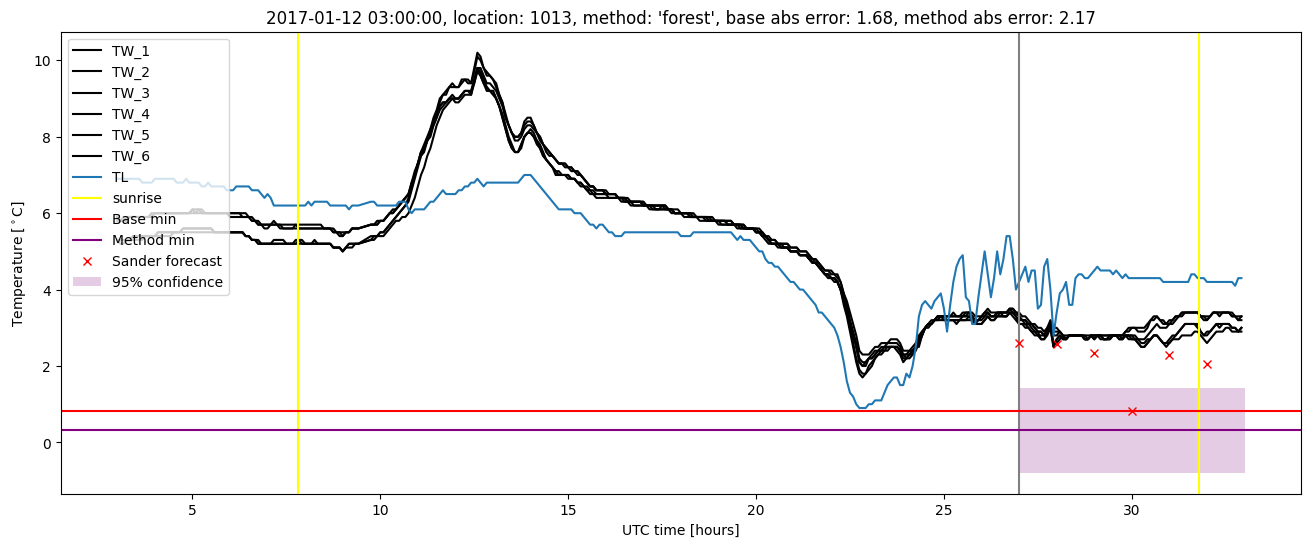
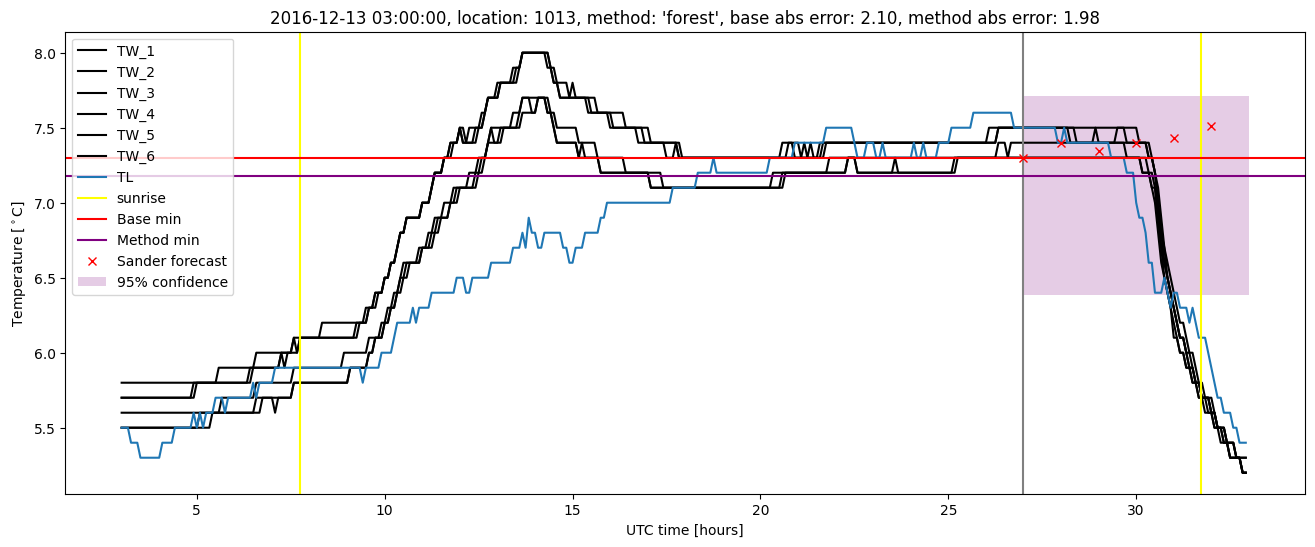
Random forest plots
Extended logistic regression results
| names |
period |
power |
significance |
meanSquareError |
absError |
maxError |
CRPS |
IGN |
| baseline |
winter 2016 |
0.995 |
0.167 |
0.320 |
0.411 |
2.101 |
NaN |
NaN |
| elr |
winter 2016 |
0.995 |
0.000e+00 |
0.283 |
0.384 |
1.891 |
0.658 |
9.111 |
| baseline |
winter 2017 |
0.985 |
0.000e+00 |
0.343 |
0.402 |
2.101 |
NaN |
NaN |
| elr |
winter 2017 |
0.956 |
0.000e+00 |
0.291 |
0.388 |
1.796 |
0.628 |
8.491 |
| baseline |
winter 2018 |
0.994 |
0.111 |
0.226 |
0.358 |
1.781 |
NaN |
NaN |
| elr |
winter 2018 |
0.968 |
0.056 |
0.198 |
0.340 |
1.467 |
0.662 |
6.758 |
| baseline |
winter 2019 |
0.993 |
0.222 |
0.249 |
0.375 |
1.832 |
NaN |
NaN |
| elr |
winter 2019 |
0.987 |
0.222 |
0.245 |
0.371 |
1.683 |
0.696 |
7.884 |
| baseline |
all |
0.992 |
0.100 |
0.285 |
0.388 |
2.101 |
NaN |
NaN |
| elr |
all |
0.978 |
0.060 |
0.255 |
0.371 |
1.891 |
0.661 |
8.102 |
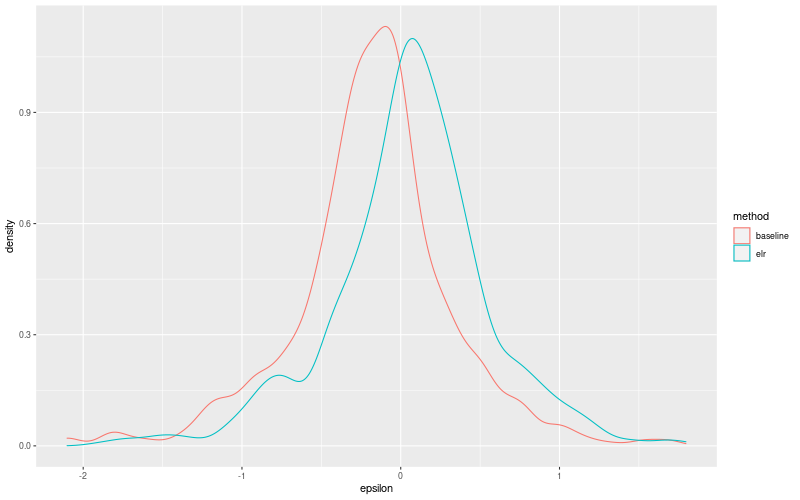
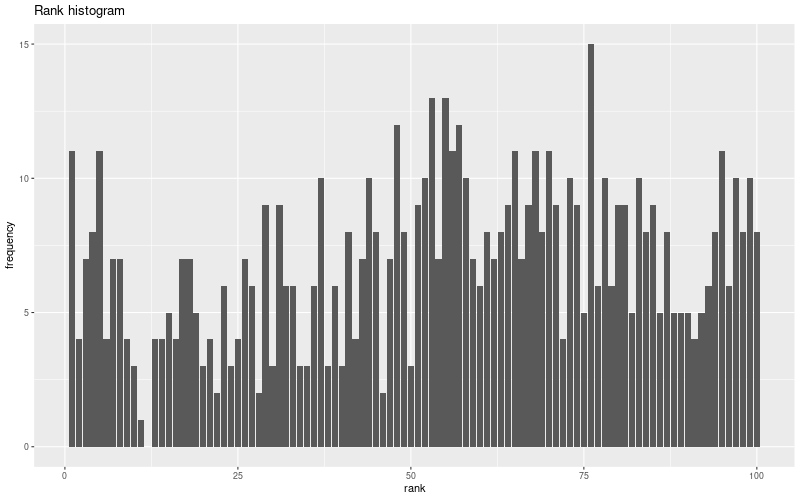
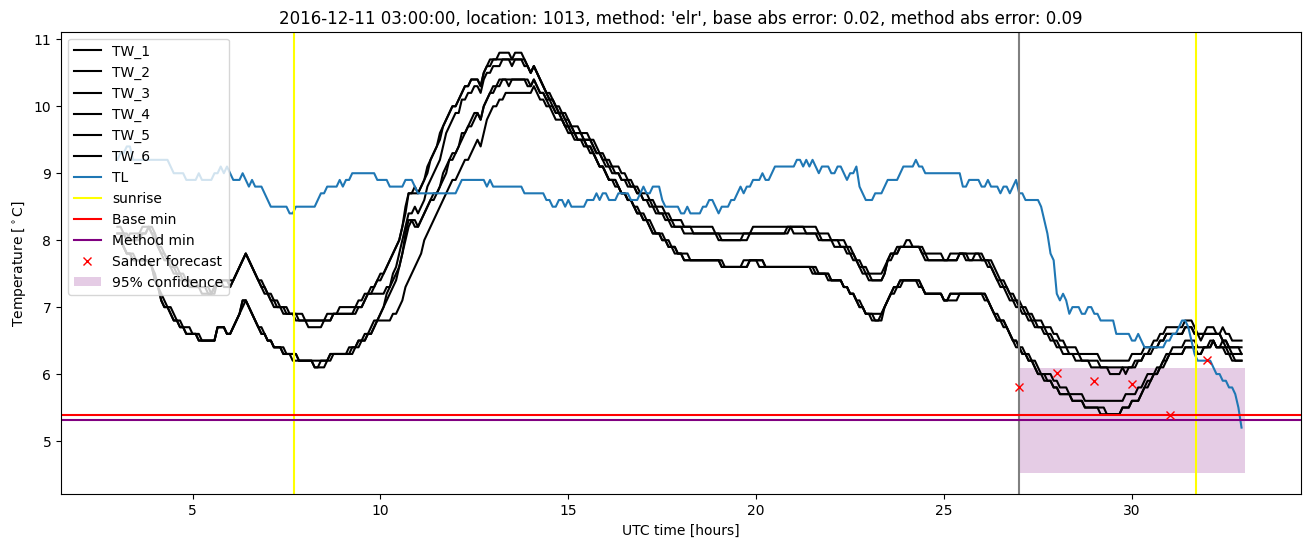
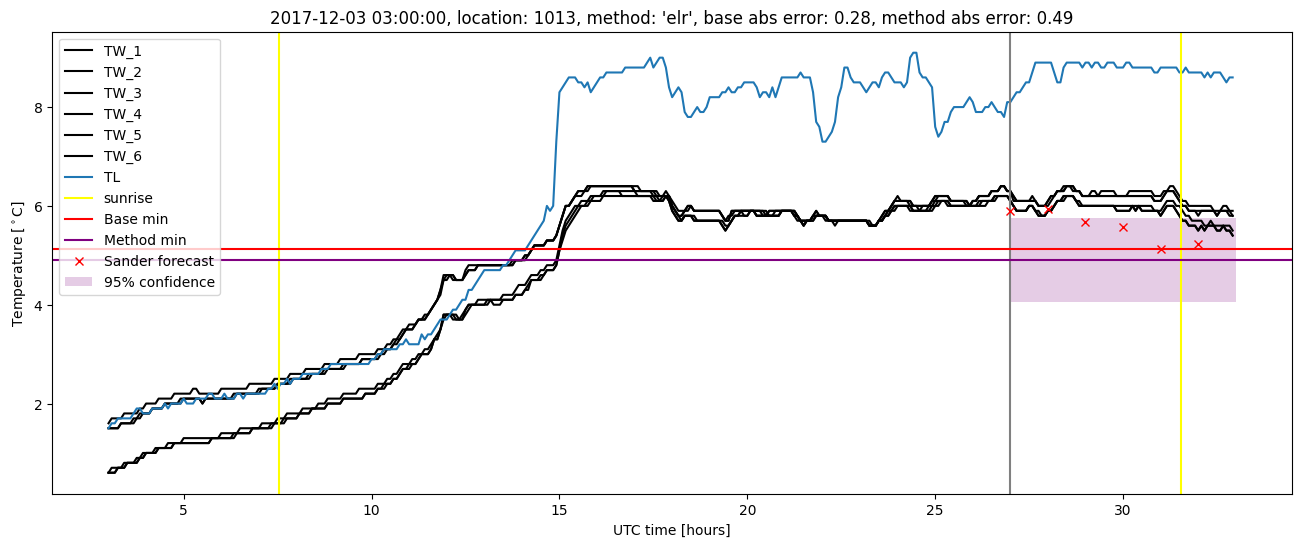
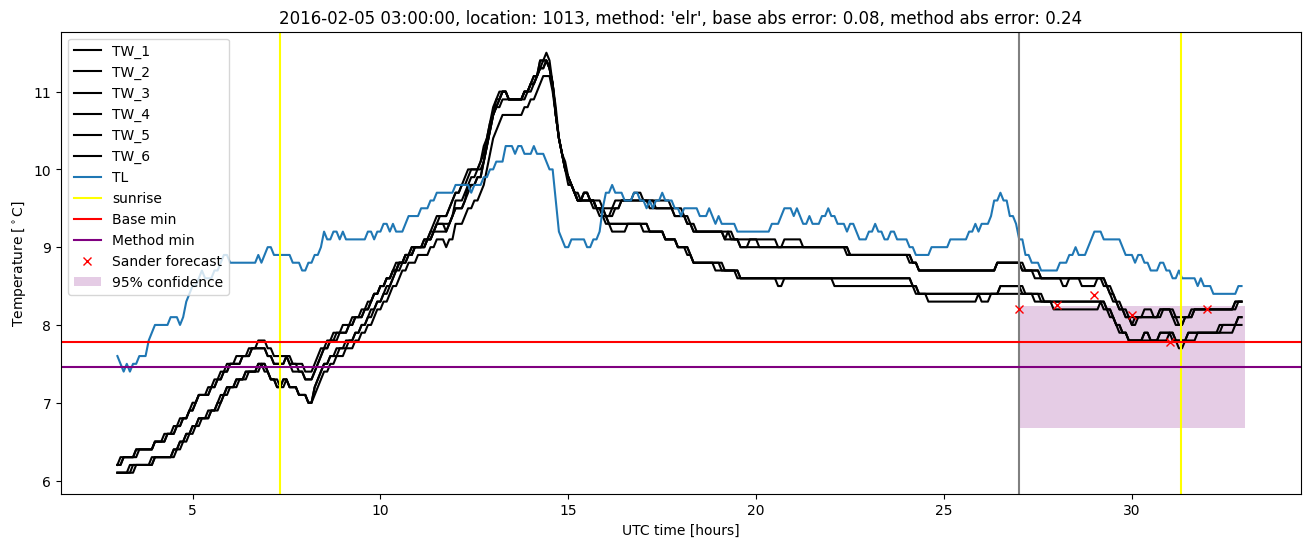
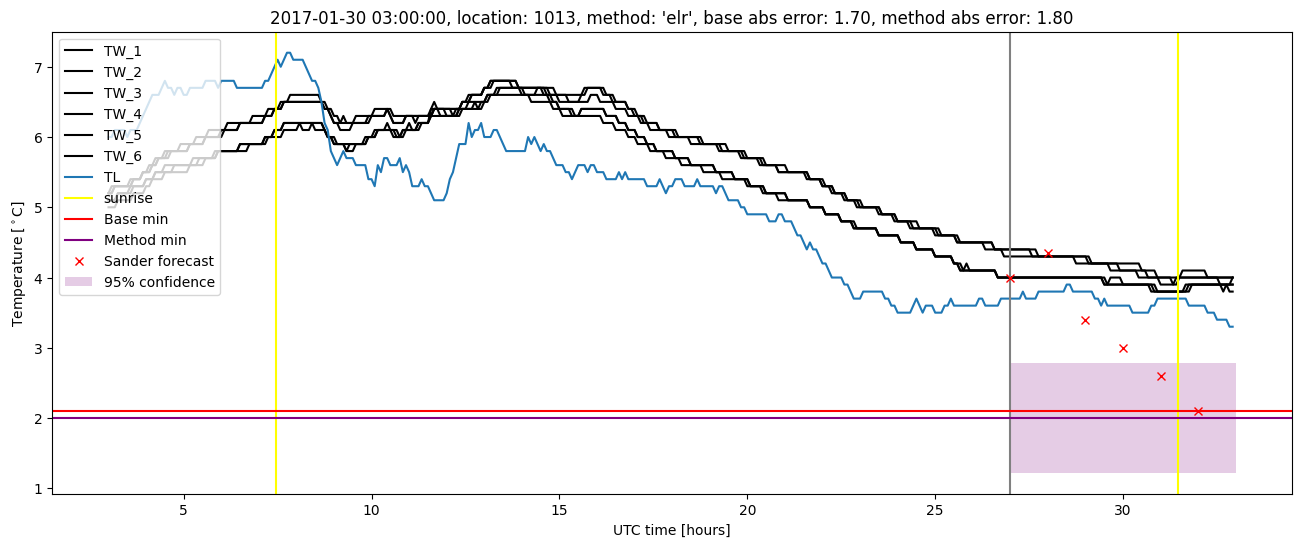
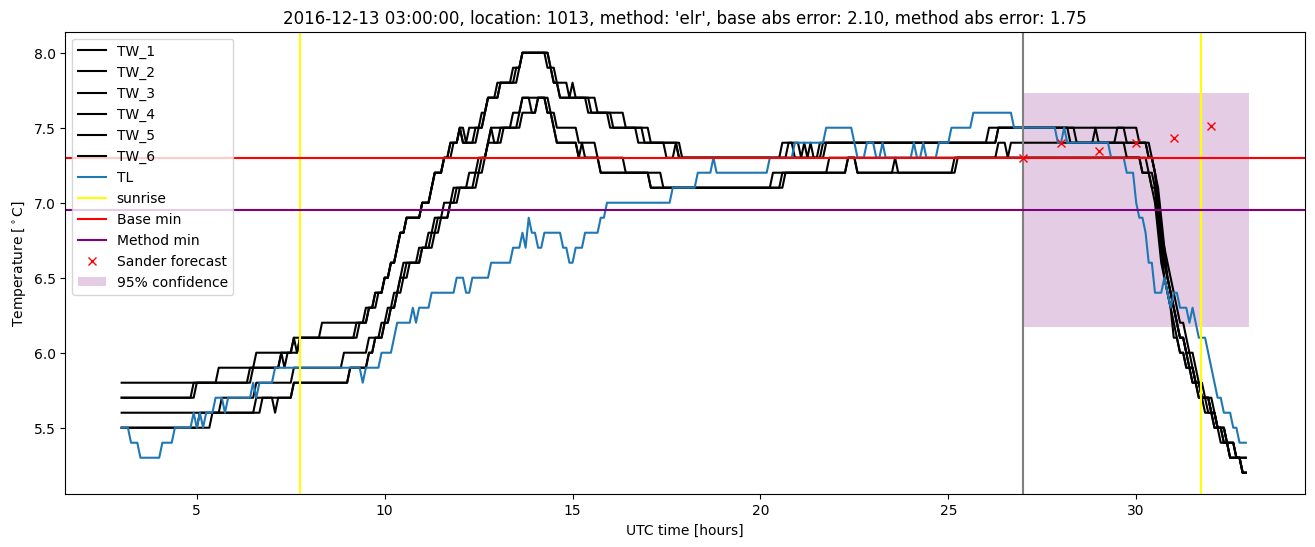
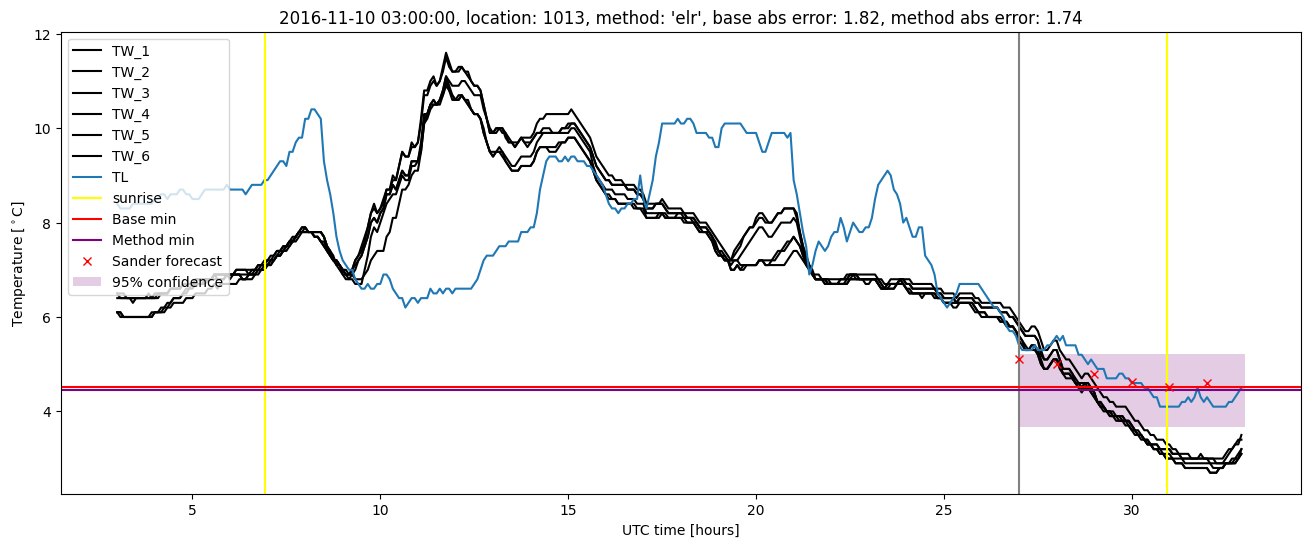
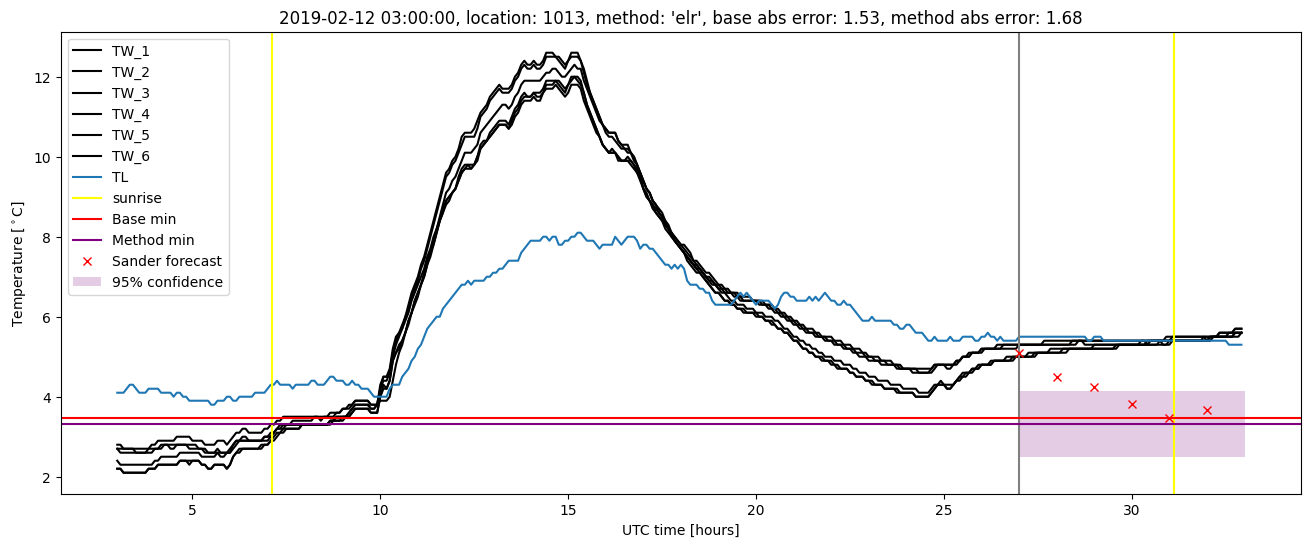
Extended logistic regression plots