GMS location: 1012
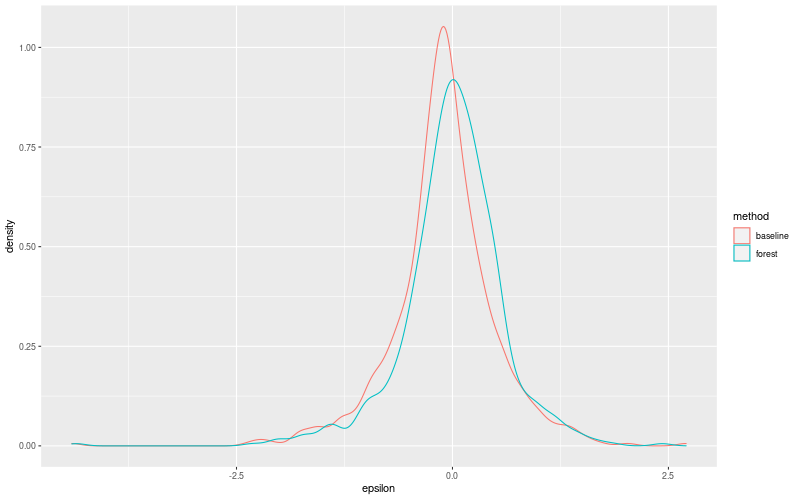
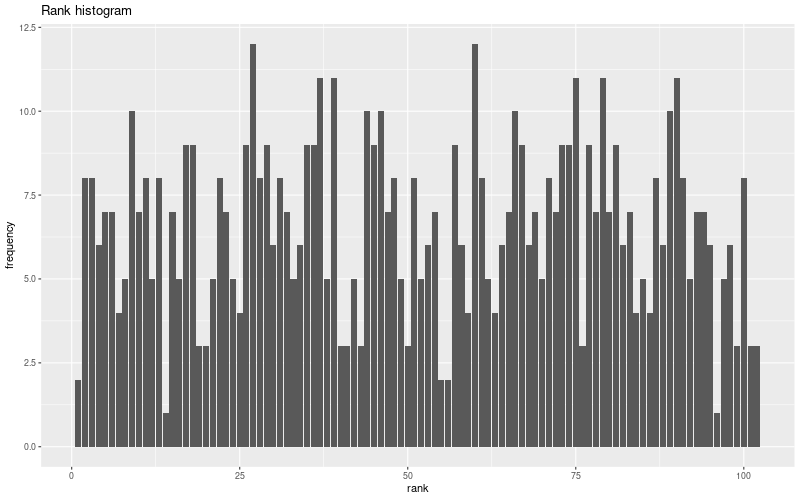
Random forest results
| names |
period |
power |
significance |
meanSquareError |
absError |
maxError |
CRPS |
IGN |
| baseline |
winter 2016 |
0.990 |
0.143 |
0.410 |
0.457 |
2.351 |
NaN |
NaN |
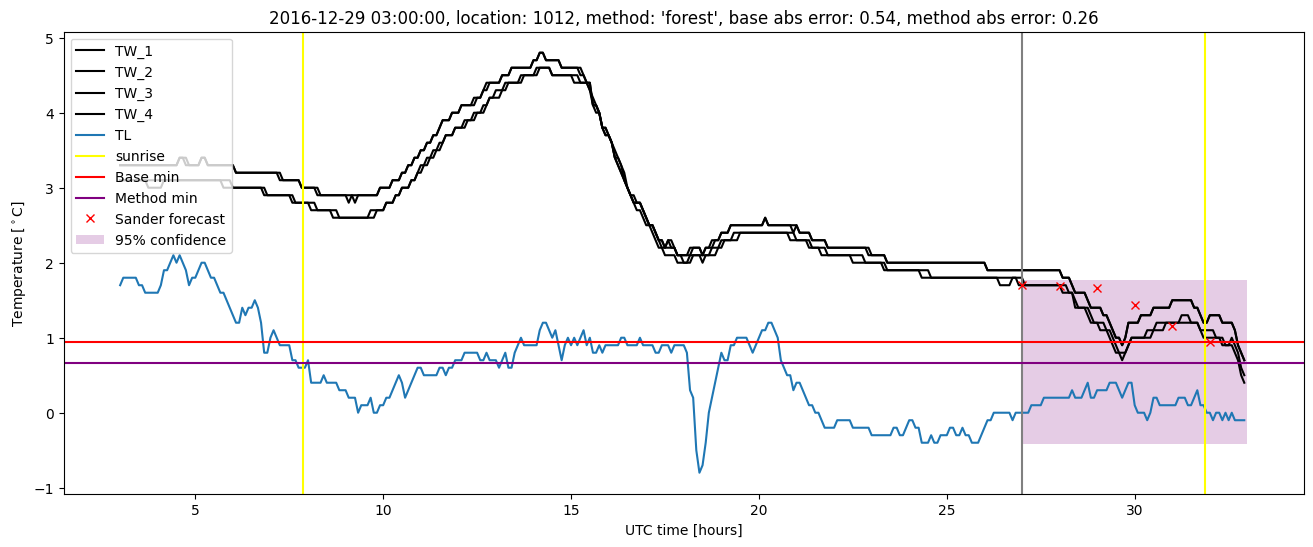
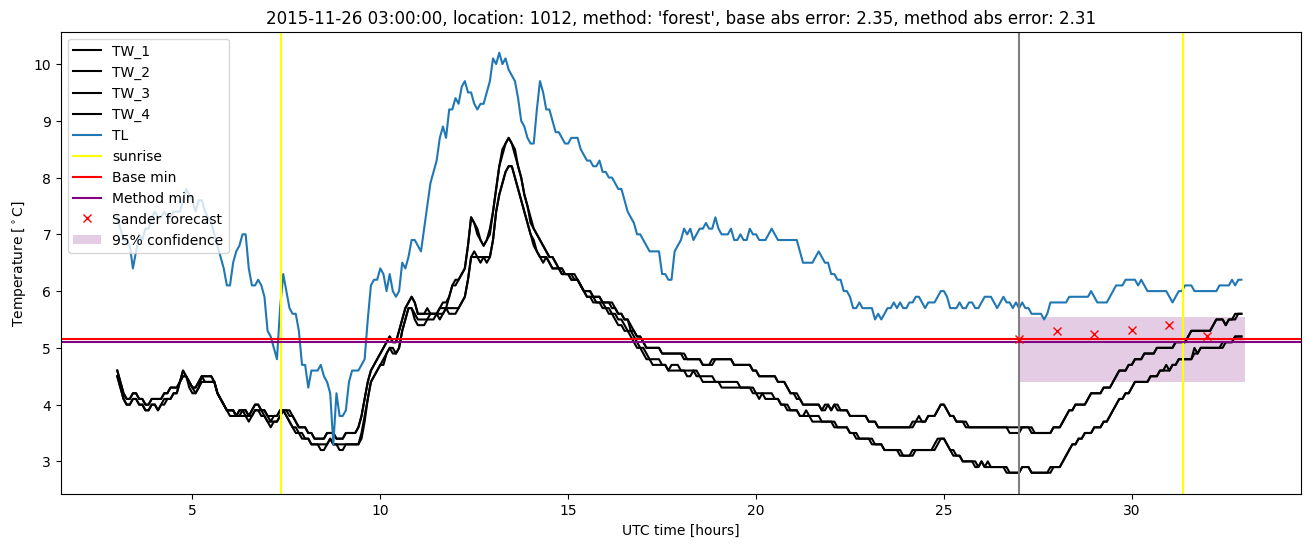
| forest |
winter 2016 |
0.984 |
0.143 |
0.387 |
0.446 |
2.310 |
0.505 |
2.519 |
| baseline |
winter 2017 |
0.968 |
0.042 |
0.458 |
0.476 |
2.705 |
NaN |
NaN |
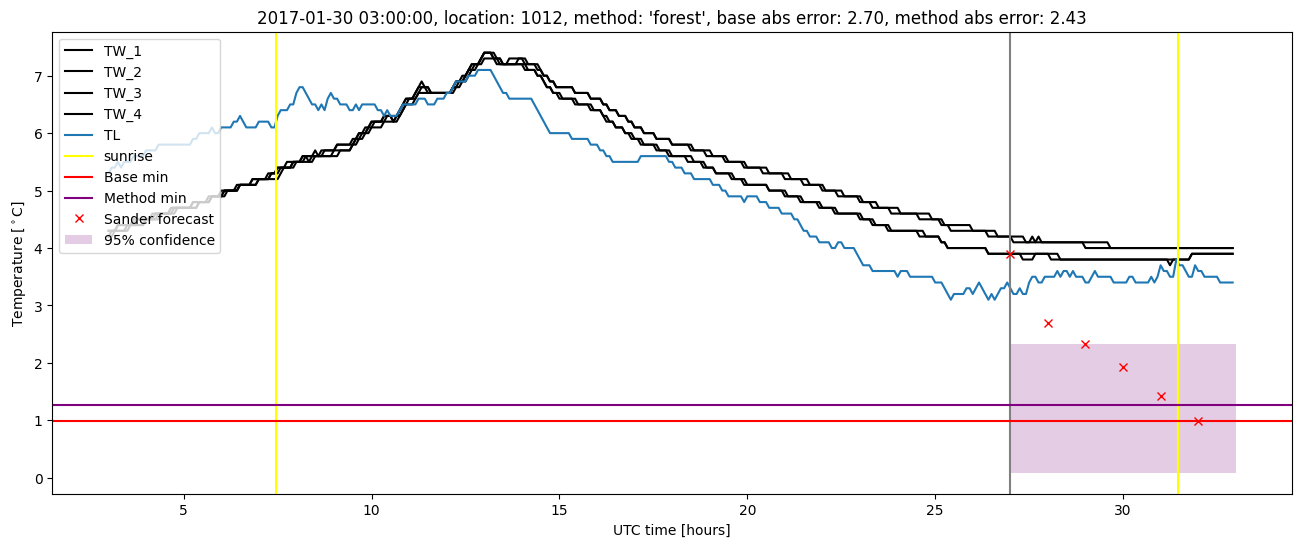
| forest |
winter 2017 |
0.976 |
0.042 |
0.386 |
0.438 |
2.428 |
0.509 |
2.478 |
| baseline |
winter 2018 |
0.974 |
0.067 |
0.281 |
0.403 |
1.706 |
NaN |
NaN |
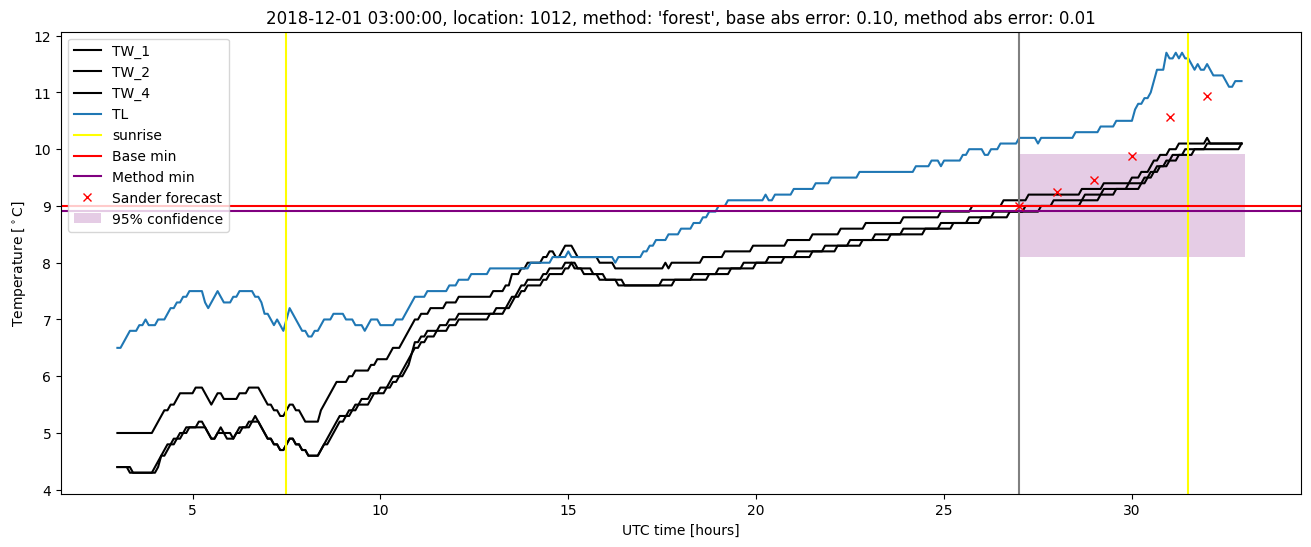
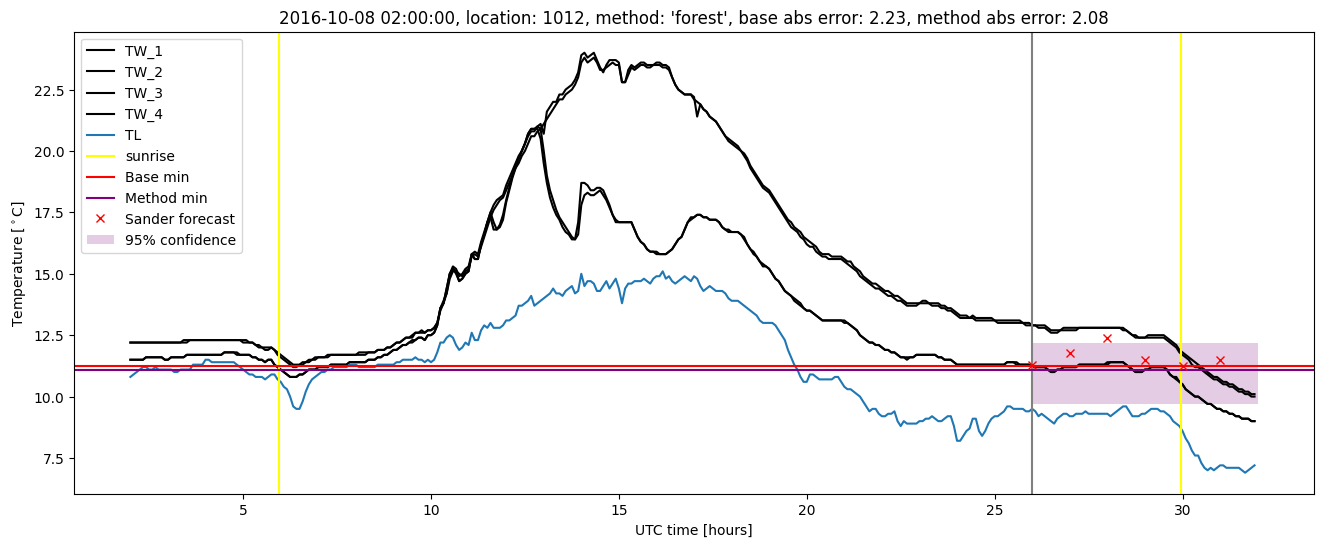
| forest |
winter 2018 |
0.968 |
0.067 |
0.251 |
0.386 |
1.502 |
0.514 |
1.947 |
| baseline |
winter 2019 |
1.000 |
0.182 |
0.369 |
0.373 |
4.406 |
NaN |
NaN |
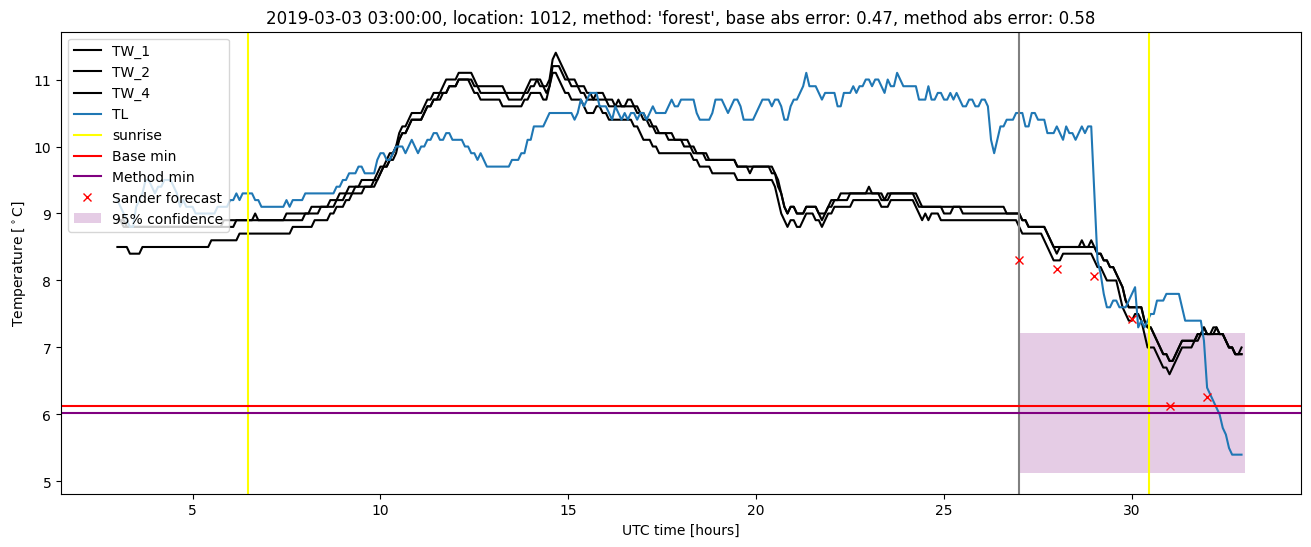
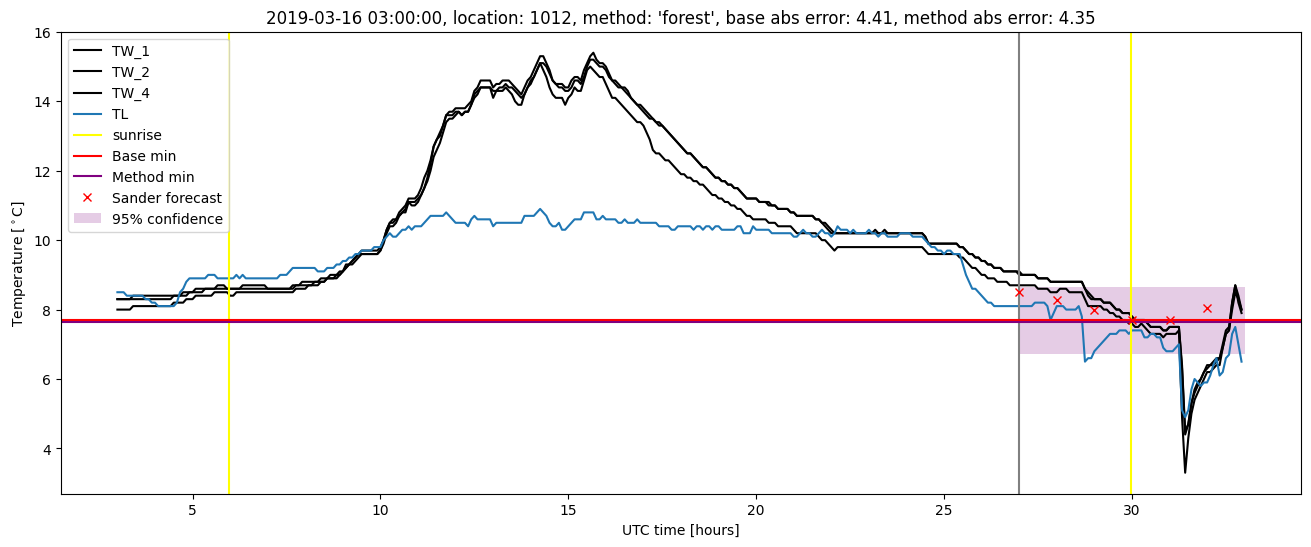
| forest |
winter 2019 |
1.000 |
0.091 |
0.357 |
0.372 |
4.355 |
0.524 |
2.601 |
| baseline |
all |
0.984 |
0.094 |
0.379 |
0.429 |
4.406 |
NaN |
NaN |
| forest |
all |
0.982 |
0.078 |
0.345 |
0.413 |
4.355 |
0.512 |
2.383 |
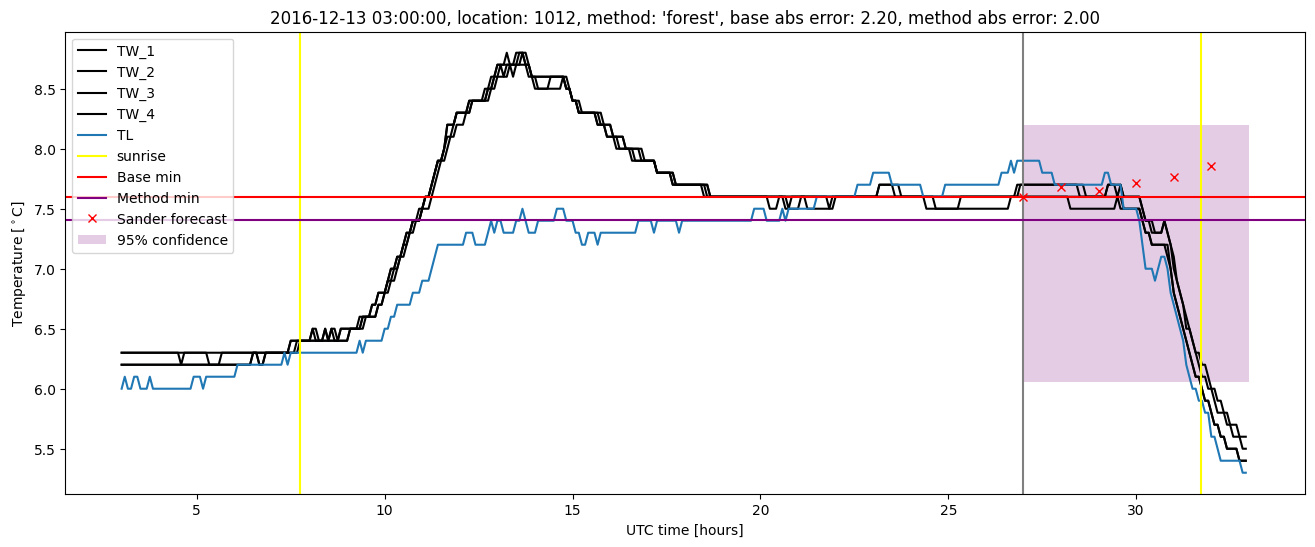
Random forest plots
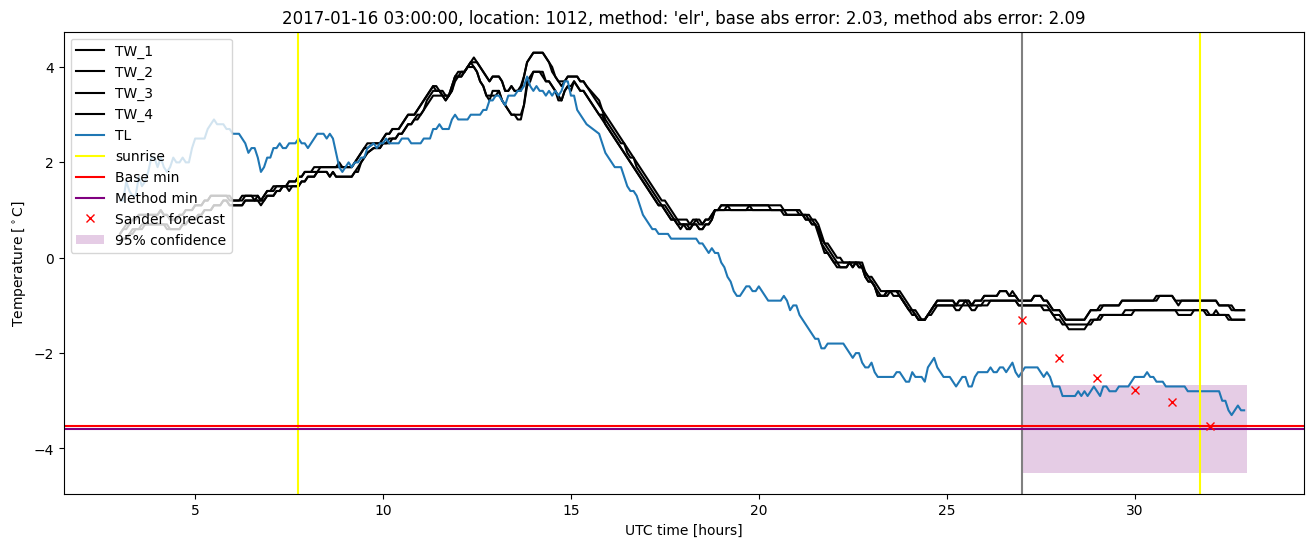
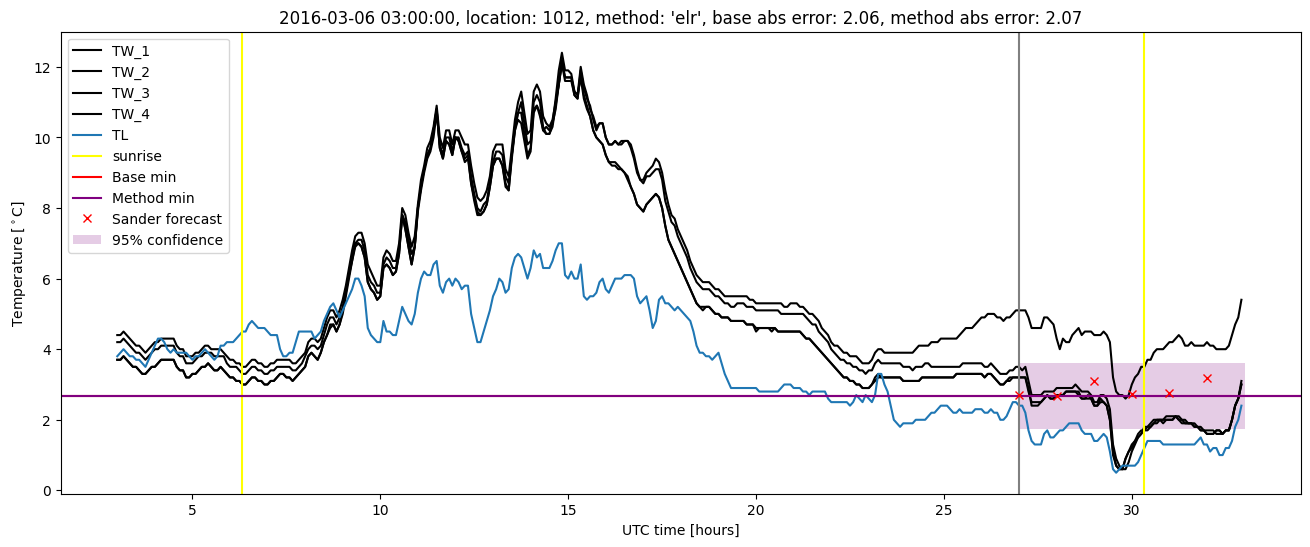
Extended logistic regression results
| names |
period |
power |
significance |
meanSquareError |
absError |
maxError |
CRPS |
IGN |
| baseline |
winter 2016 |
0.990 |
0.143 |
0.410 |
0.457 |
2.351 |
NaN |
NaN |
| elr |
winter 2016 |
0.990 |
0.143 |
0.408 |
0.470 |
2.070 |
0.555 |
3.536 |
| baseline |
winter 2017 |
0.968 |
0.042 |
0.458 |
0.476 |
2.705 |
NaN |
NaN |
| elr |
winter 2017 |
0.952 |
0.000e+00 |
0.445 |
0.467 |
2.713 |
0.583 |
4.559 |
| baseline |
winter 2018 |
0.974 |
0.067 |
0.281 |
0.403 |
1.706 |
NaN |
NaN |
| elr |
winter 2018 |
0.974 |
0.067 |
0.275 |
0.403 |
1.579 |
0.565 |
2.924 |
| baseline |
winter 2019 |
1.000 |
0.182 |
0.369 |
0.373 |
4.406 |
NaN |
NaN |
| elr |
winter 2019 |
1.000 |
0.182 |
0.354 |
0.388 |
4.341 |
0.535 |
3.193 |
| baseline |
all |
0.984 |
0.094 |
0.379 |
0.429 |
4.406 |
NaN |
NaN |
| elr |
all |
0.980 |
0.078 |
0.370 |
0.434 |
4.341 |
0.559 |
3.530 |
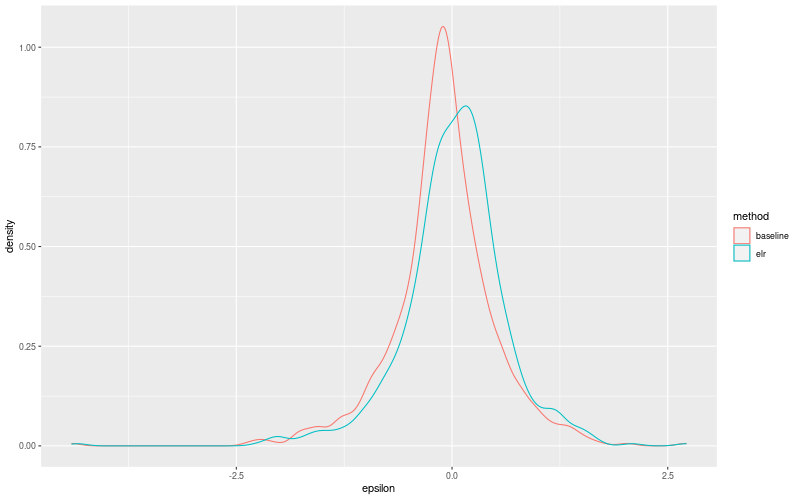
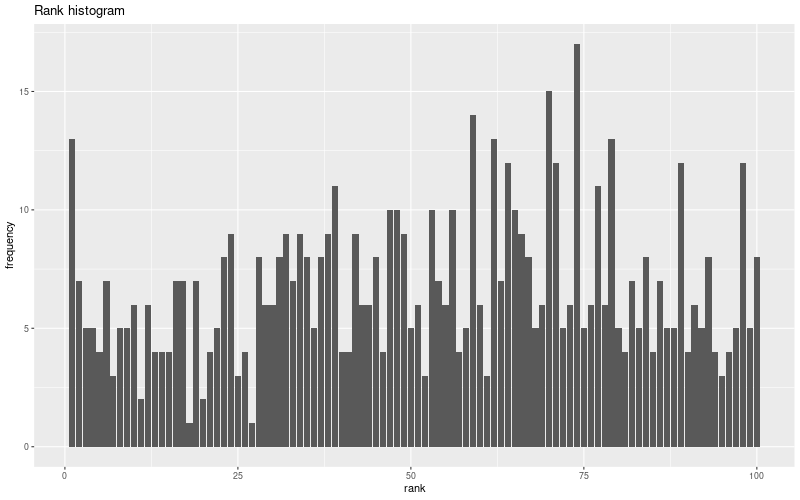
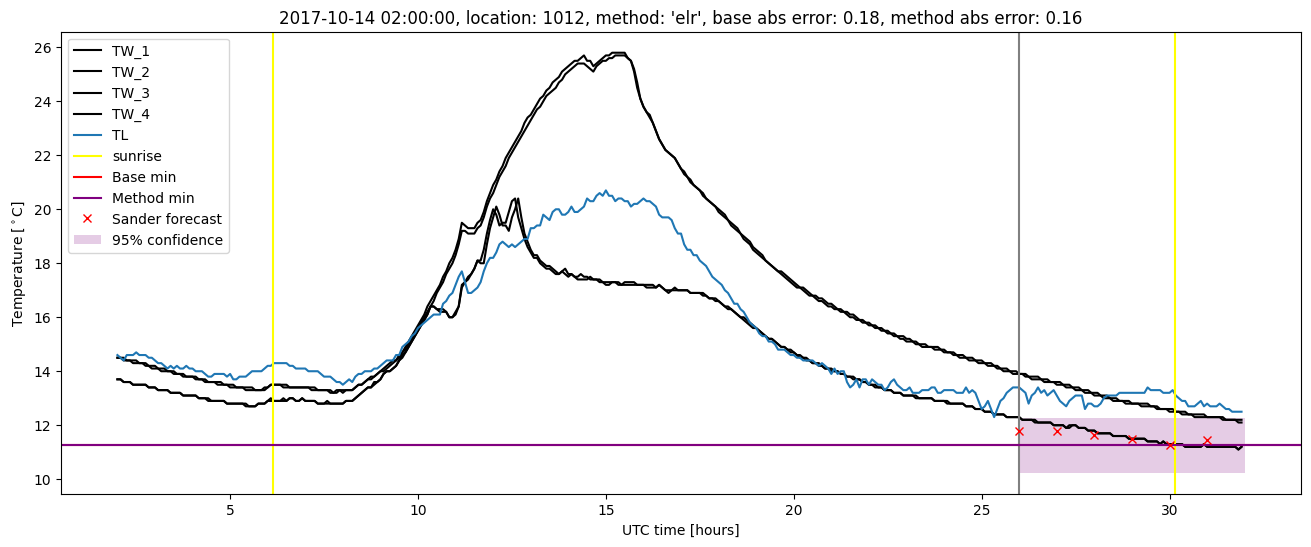
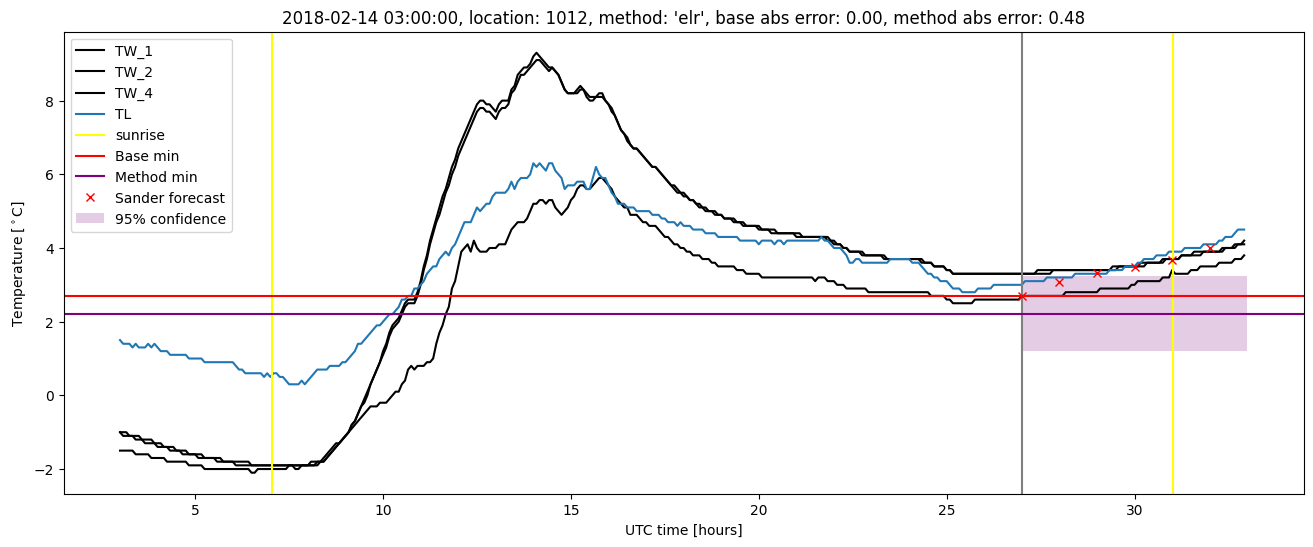
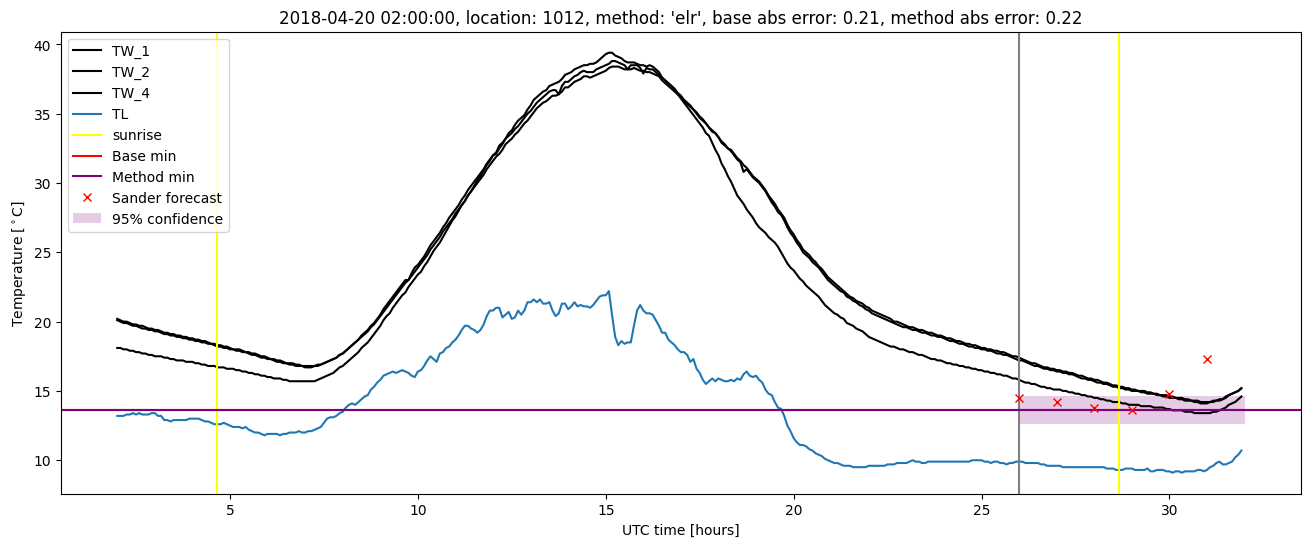
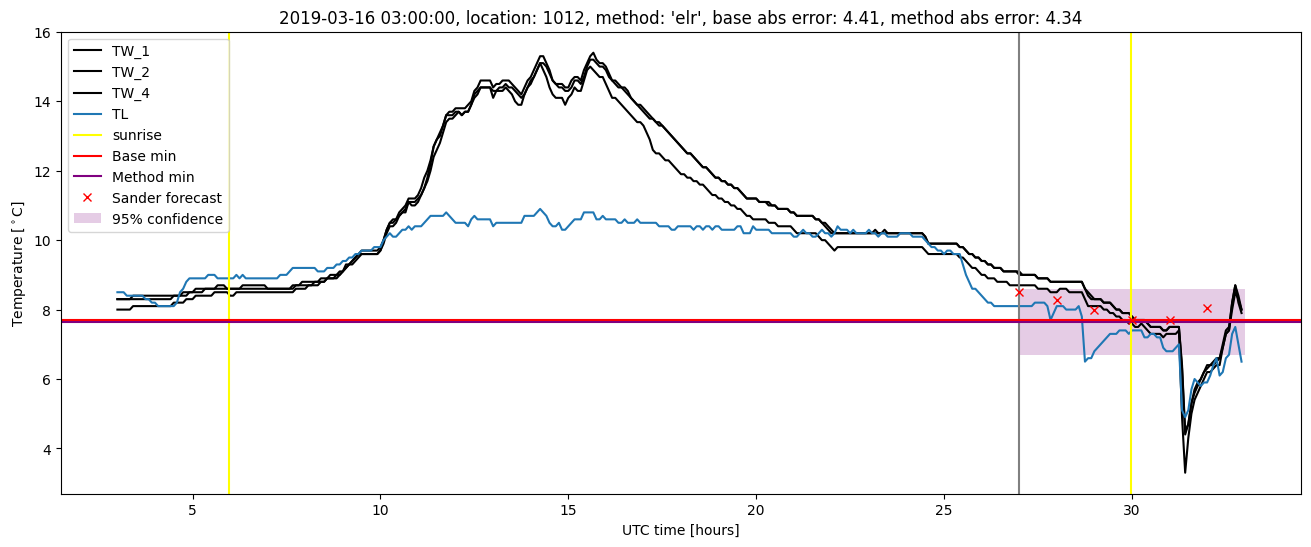
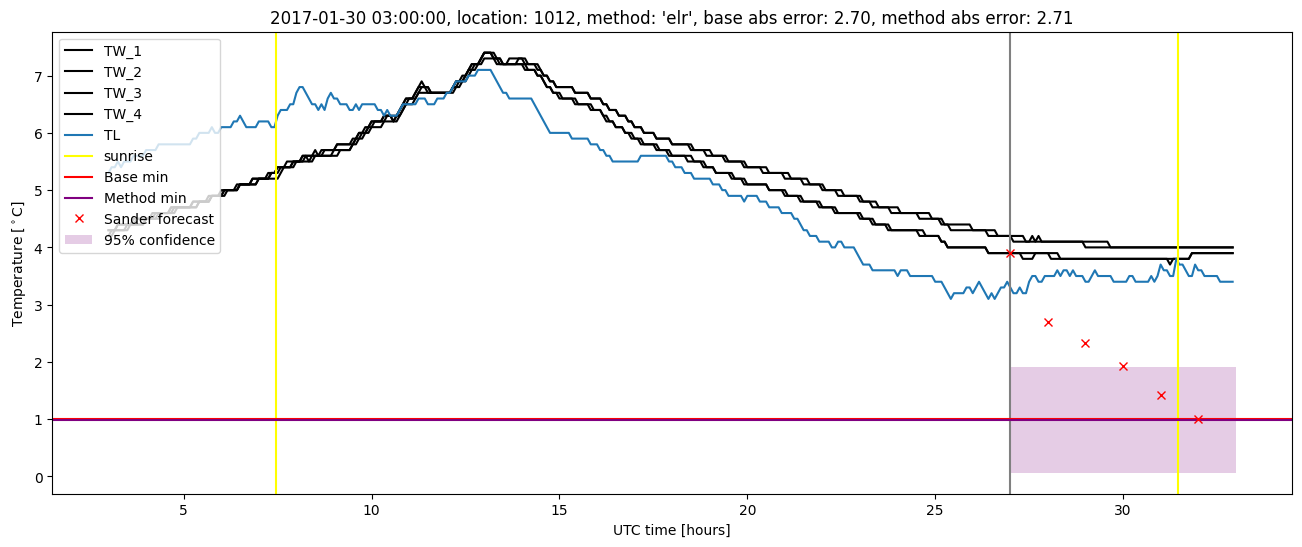
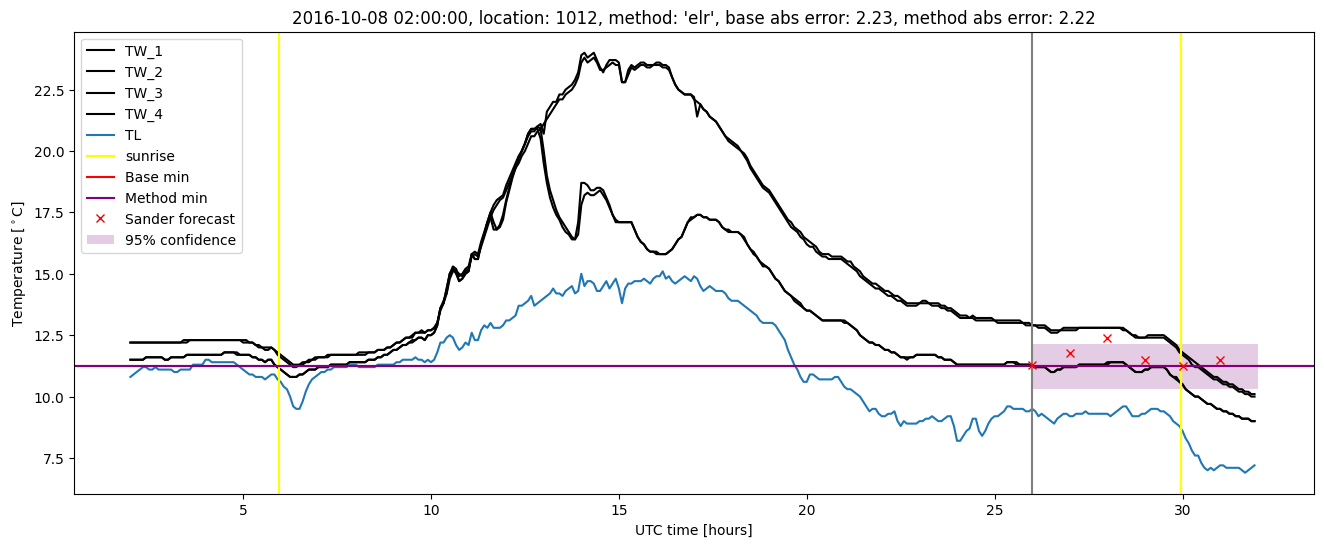
Extended logistic regression plots