GMS location: 1011
Random forest results
| names |
period |
power |
significance |
meanSquareError |
absError |
maxError |
CRPS |
IGN |
| baseline |
winter 2016 |
1.000 |
0.067 |
0.309 |
0.393 |
2.701 |
NaN |
NaN |
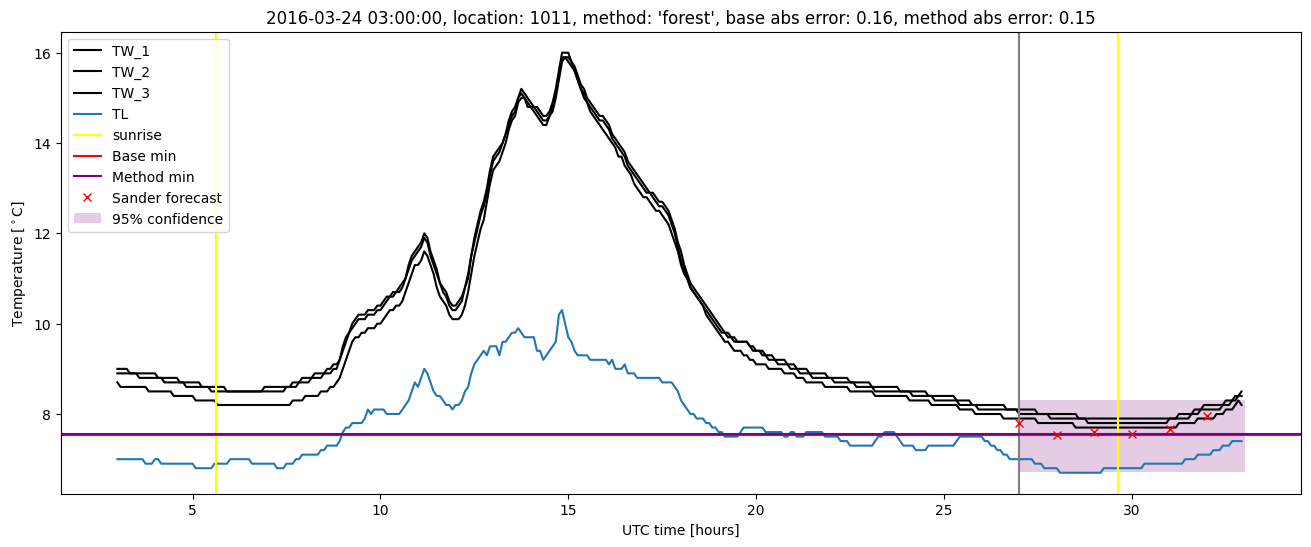
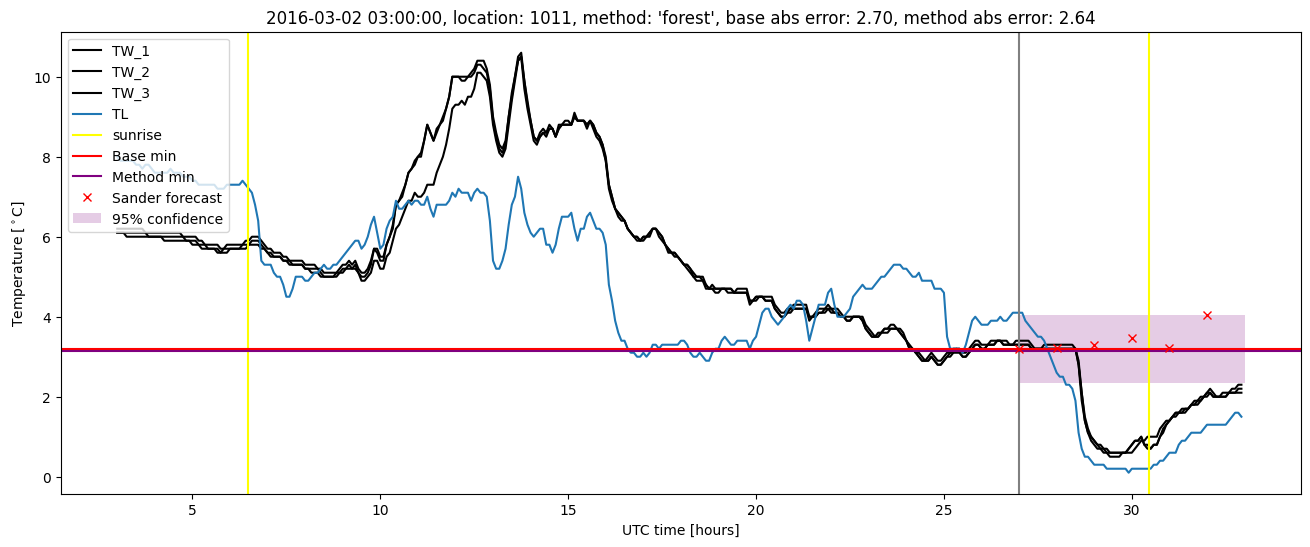
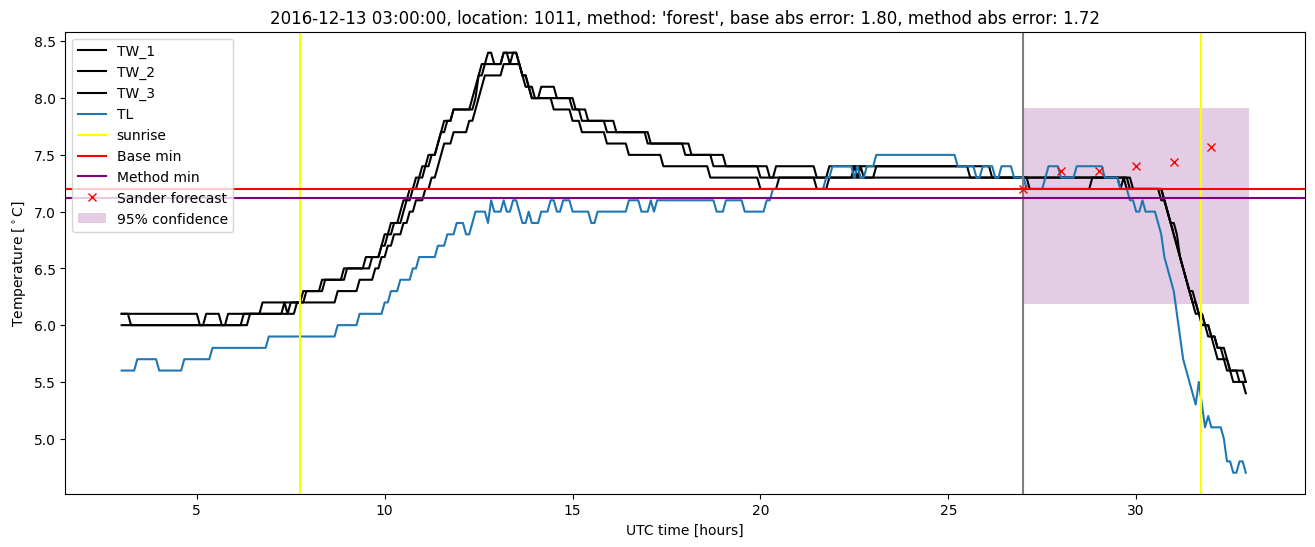
| forest |
winter 2016 |
1.000 |
0.267 |
0.301 |
0.409 |
2.640 |
0.430 |
2.670 |
| baseline |
winter 2017 |
0.961 |
0.000e+00 |
0.439 |
0.466 |
2.881 |
NaN |
NaN |
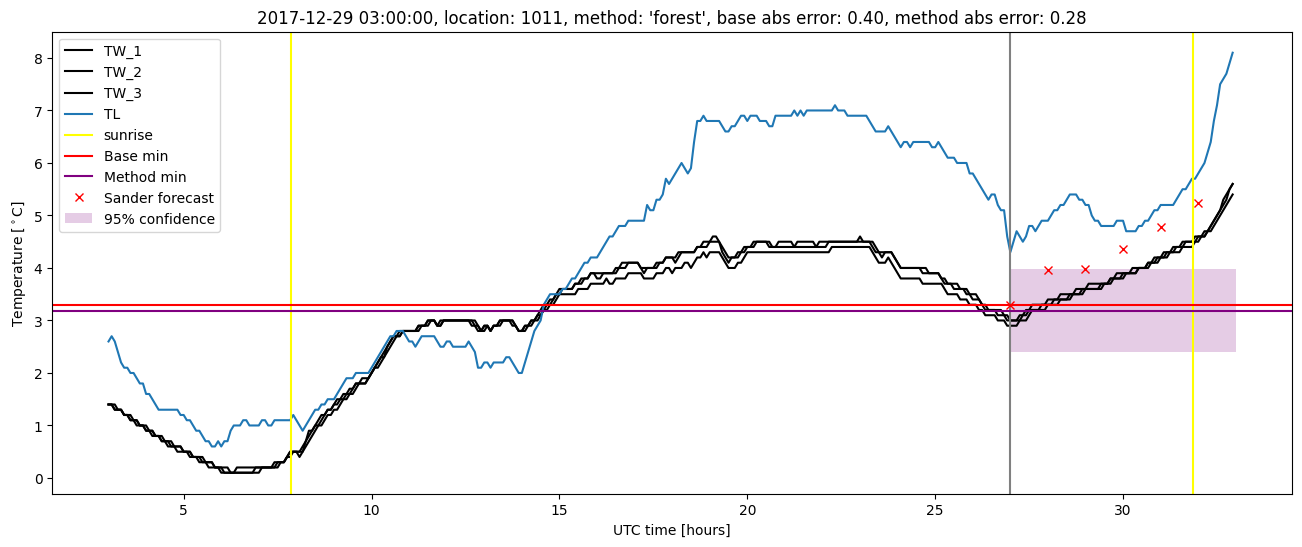
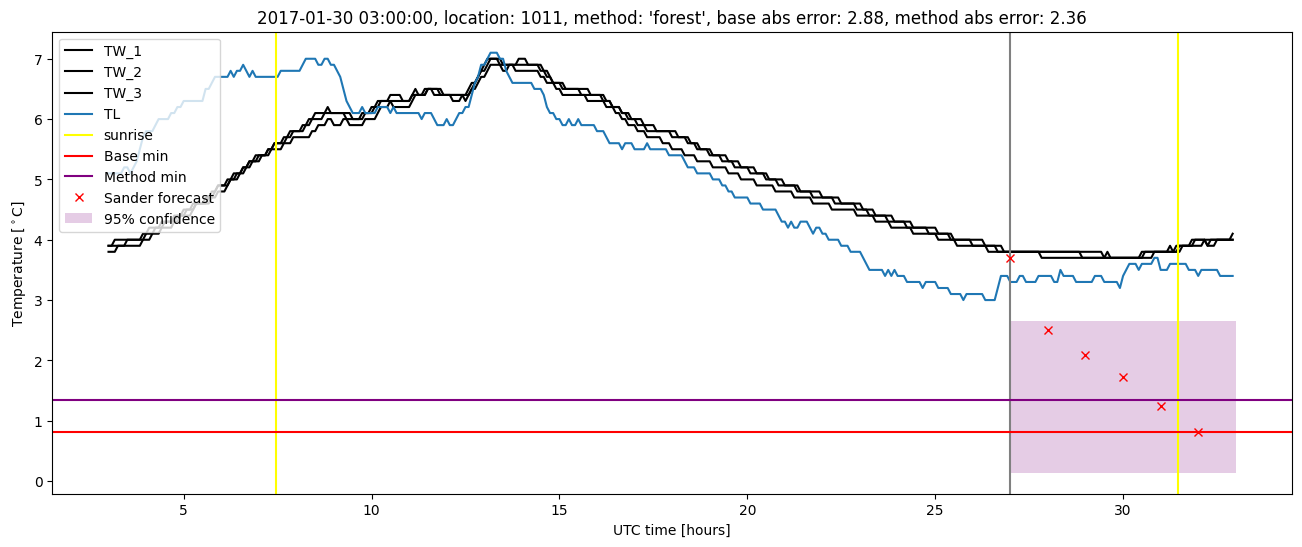
| forest |
winter 2017 |
0.985 |
0.000e+00 |
0.328 |
0.409 |
2.359 |
0.437 |
2.458 |
| baseline |
winter 2018 |
0.975 |
0.167 |
0.340 |
0.434 |
2.271 |
NaN |
NaN |
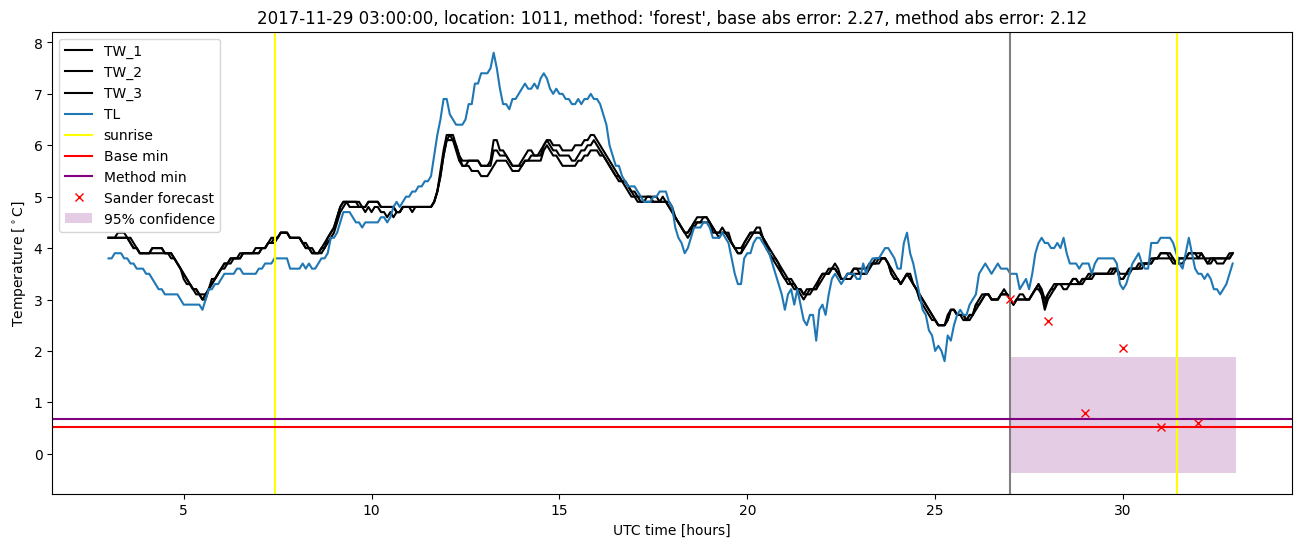
| forest |
winter 2018 |
0.987 |
0.167 |
0.292 |
0.399 |
2.121 |
0.441 |
2.366 |
| baseline |
winter 2019 |
0.987 |
0.000e+00 |
0.247 |
0.363 |
1.572 |
NaN |
NaN |
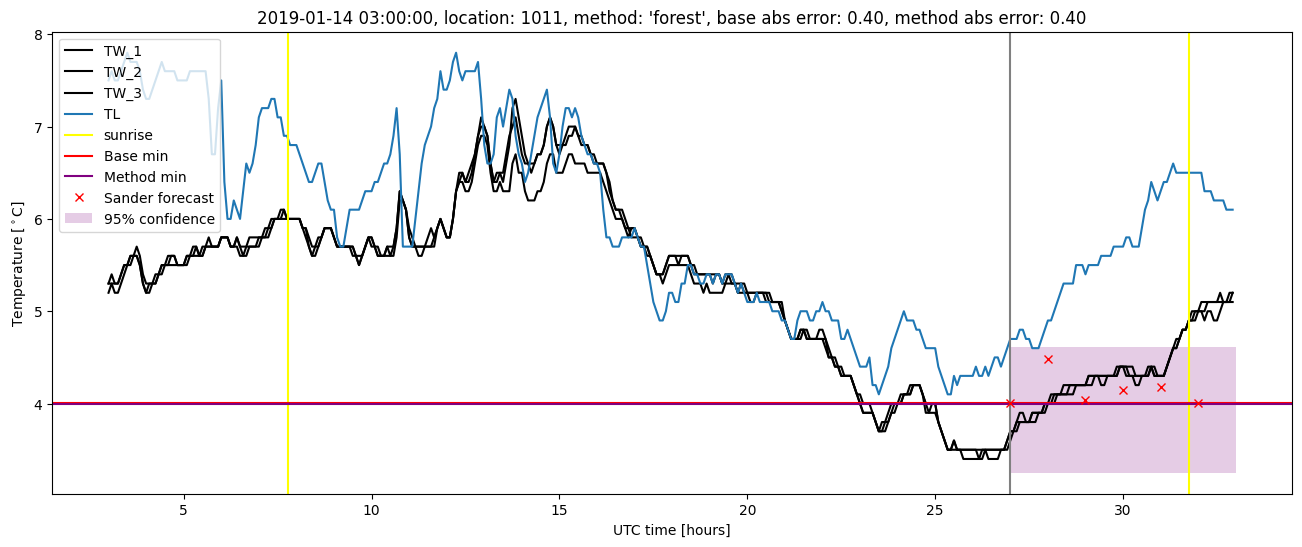
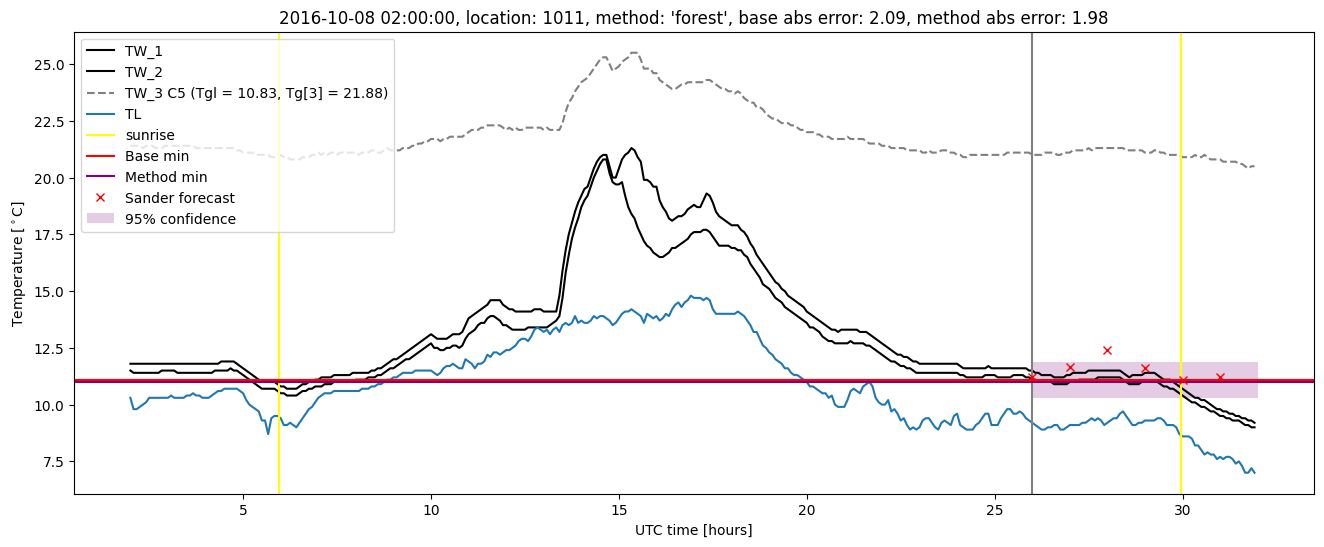
| forest |
winter 2019 |
0.987 |
0.000e+00 |
0.190 |
0.323 |
1.525 |
0.429 |
1.986 |
| baseline |
all |
0.983 |
0.052 |
0.330 |
0.411 |
2.881 |
NaN |
NaN |
| forest |
all |
0.991 |
0.103 |
0.278 |
0.386 |
2.640 |
0.434 |
2.386 |
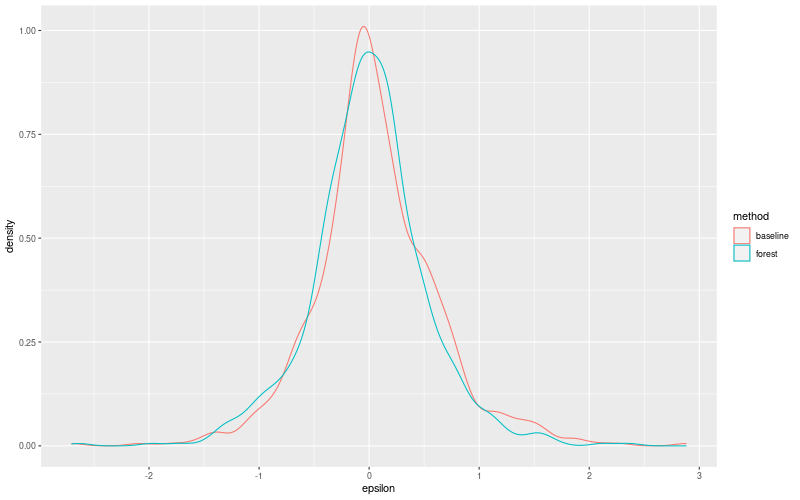
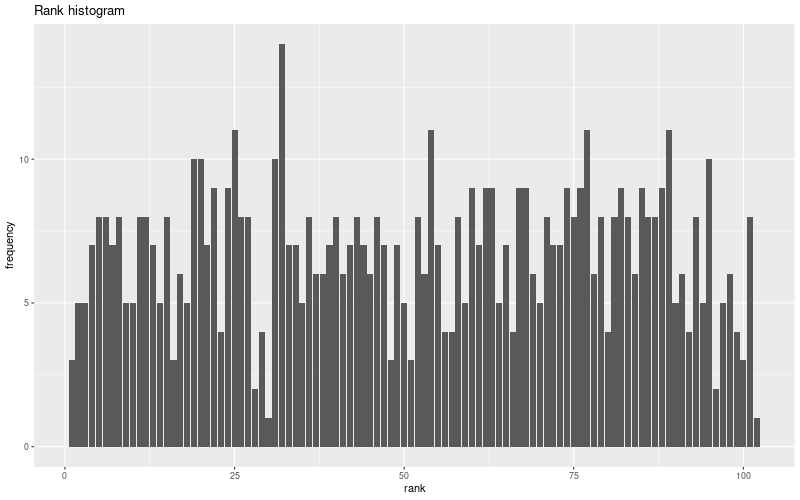
Random forest plots
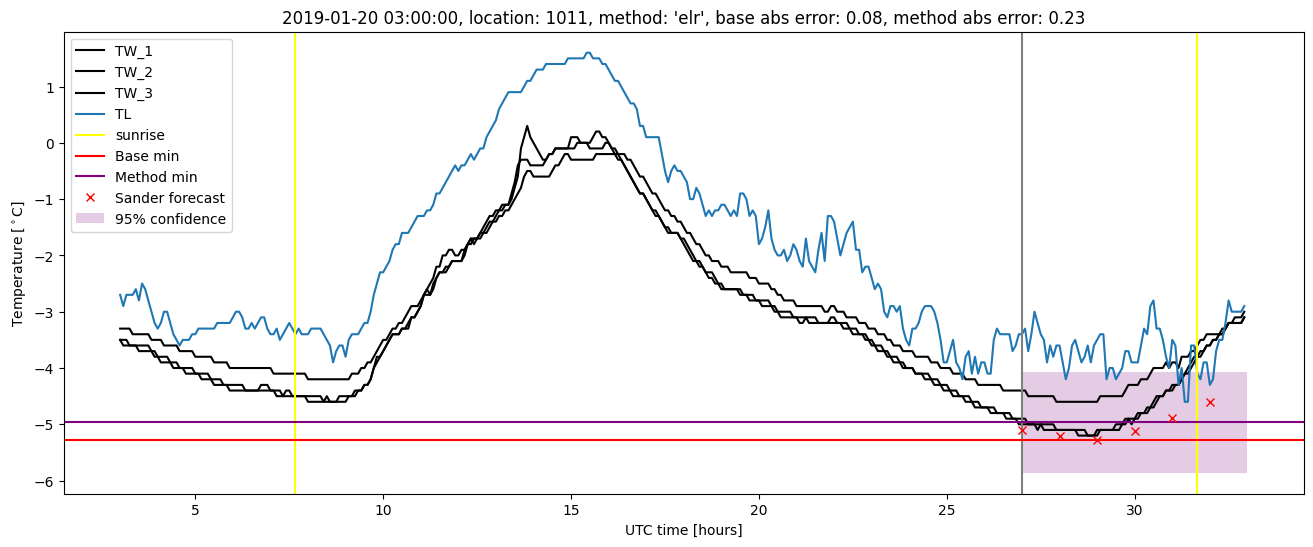
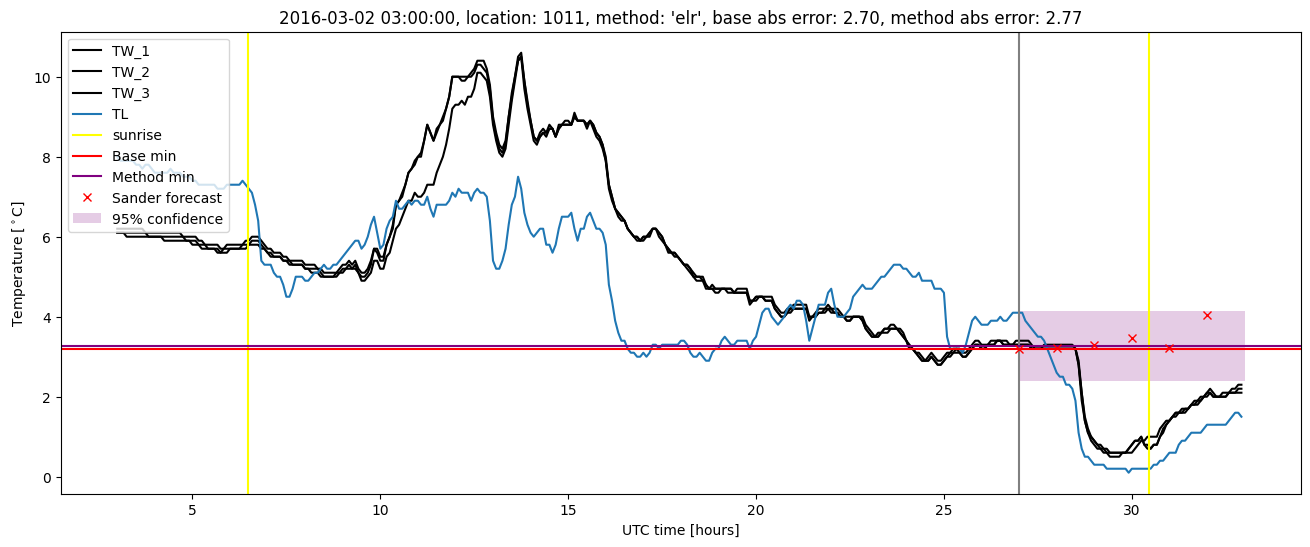
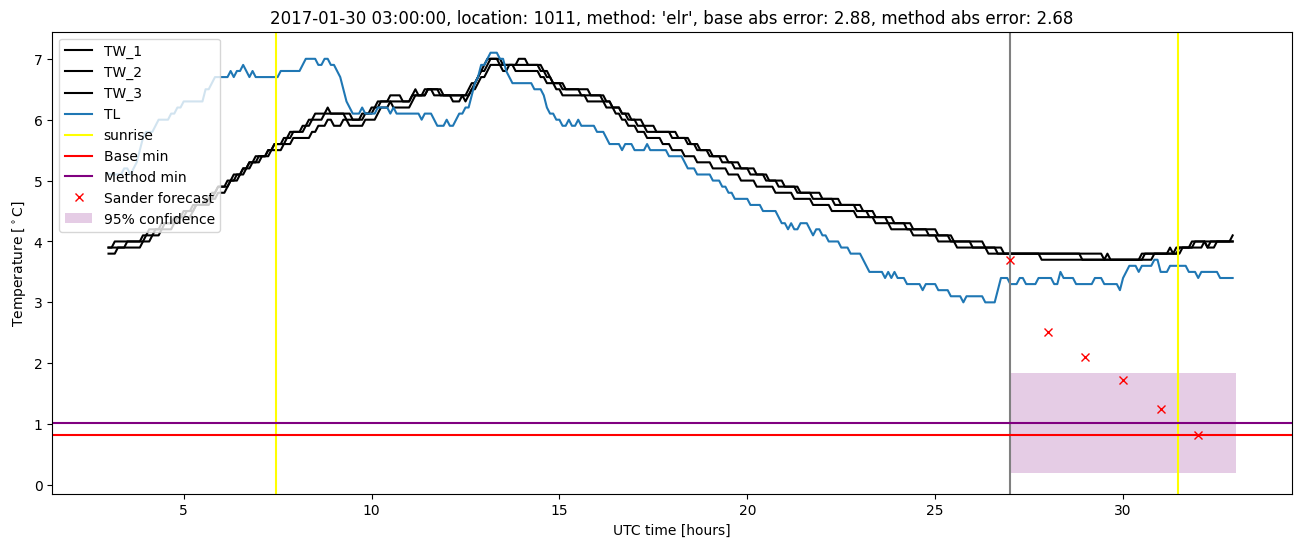
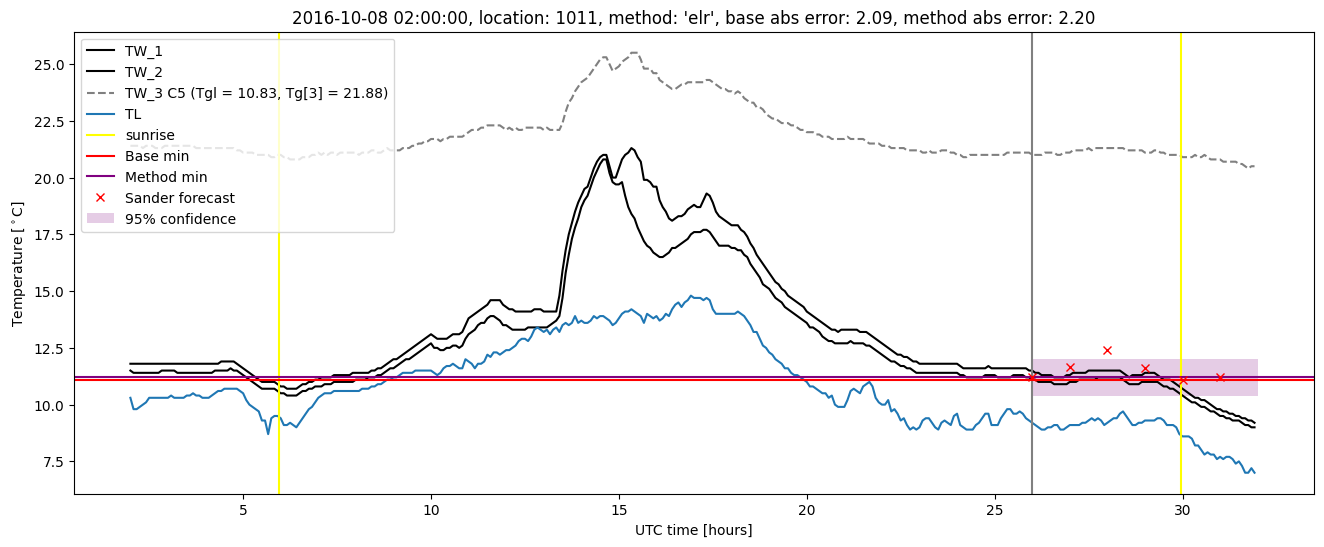
Extended logistic regression results
| names |
period |
power |
significance |
meanSquareError |
absError |
maxError |
CRPS |
IGN |
| baseline |
winter 2016 |
1.000 |
0.067 |
0.309 |
0.393 |
2.701 |
NaN |
NaN |
| elr |
winter 2016 |
1.000 |
0.267 |
0.324 |
0.421 |
2.771 |
0.471 |
3.392 |
| baseline |
winter 2017 |
0.961 |
0.000e+00 |
0.439 |
0.466 |
2.881 |
NaN |
NaN |
| elr |
winter 2017 |
0.969 |
0.045 |
0.389 |
0.444 |
2.684 |
0.498 |
4.947 |
| baseline |
winter 2018 |
0.975 |
0.167 |
0.340 |
0.434 |
2.271 |
NaN |
NaN |
| elr |
winter 2018 |
0.981 |
0.083 |
0.301 |
0.406 |
1.832 |
0.489 |
3.691 |
| baseline |
winter 2019 |
0.987 |
0.000e+00 |
0.247 |
0.363 |
1.572 |
NaN |
NaN |
| elr |
winter 2019 |
0.981 |
0.000e+00 |
0.219 |
0.356 |
1.633 |
0.491 |
3.364 |
| baseline |
all |
0.983 |
0.052 |
0.330 |
0.411 |
2.881 |
NaN |
NaN |
| elr |
all |
0.984 |
0.103 |
0.307 |
0.407 |
2.771 |
0.486 |
3.798 |
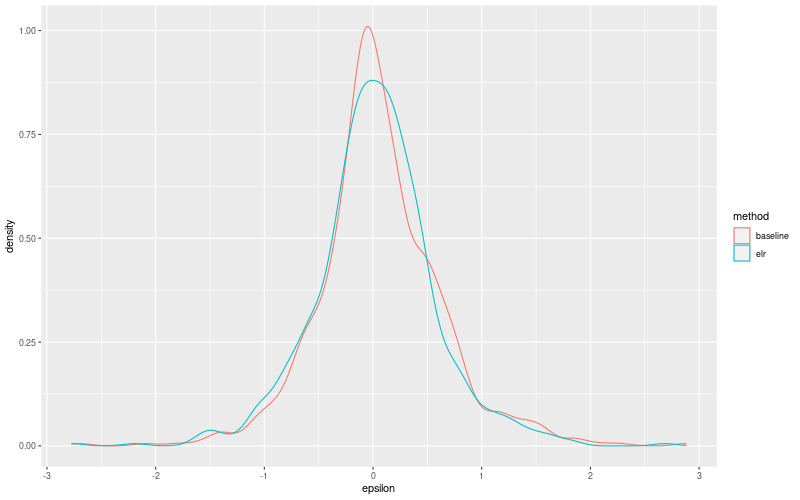
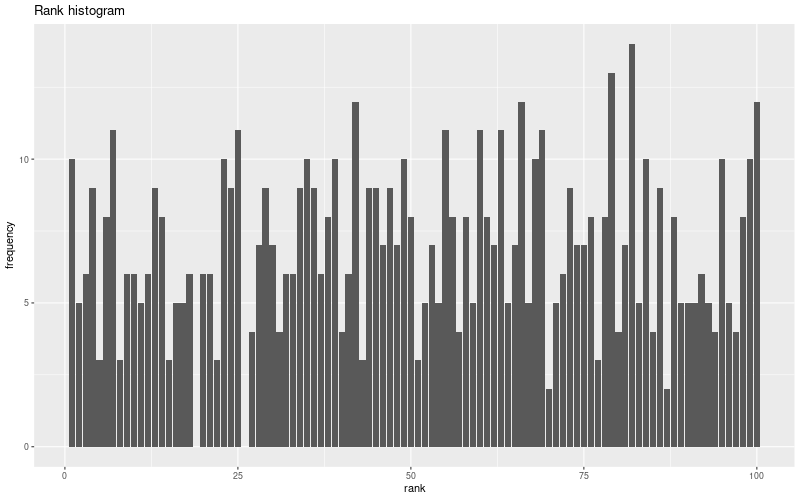
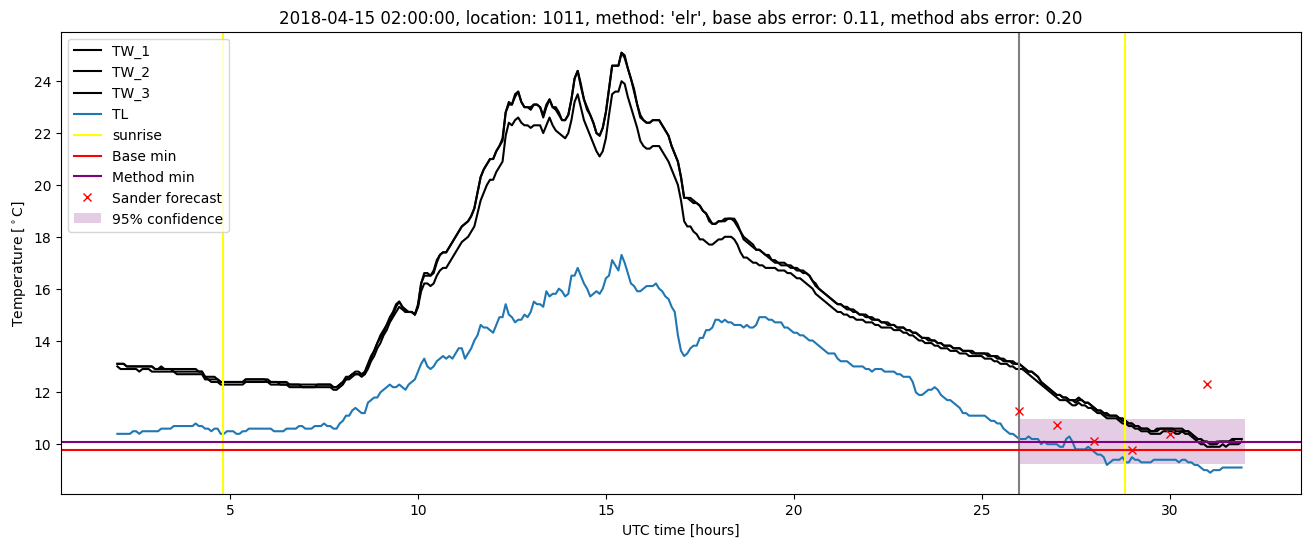
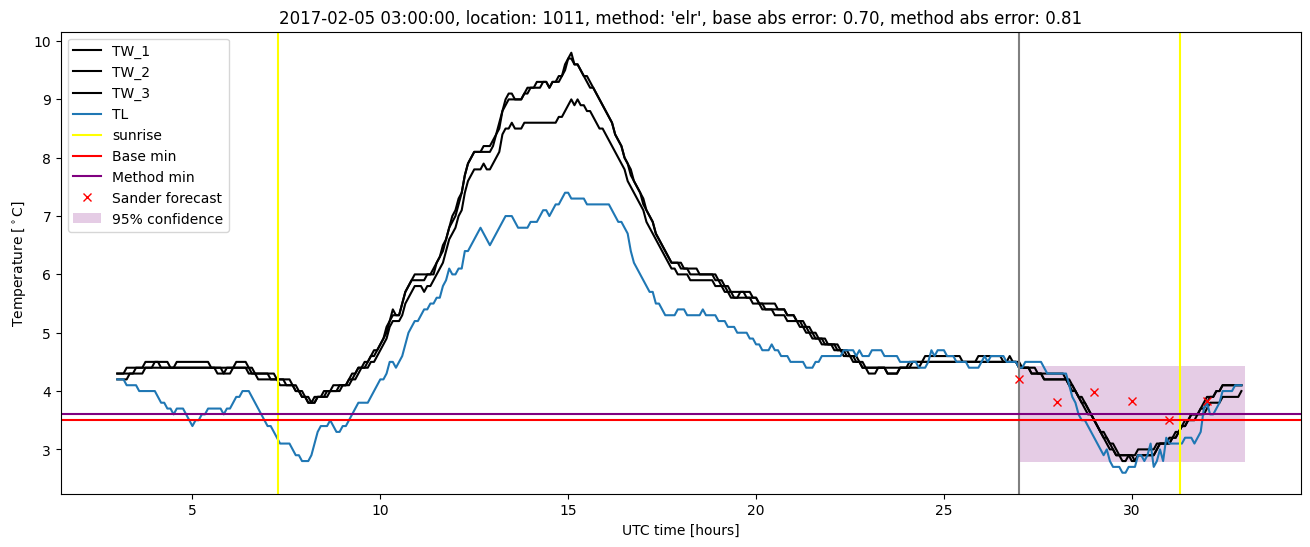
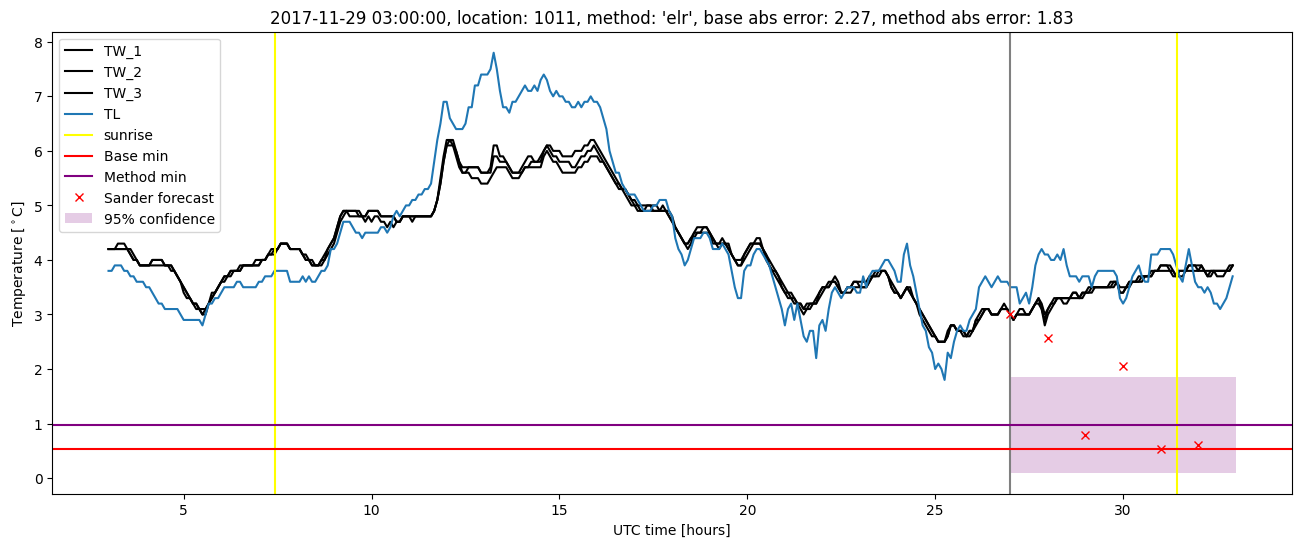
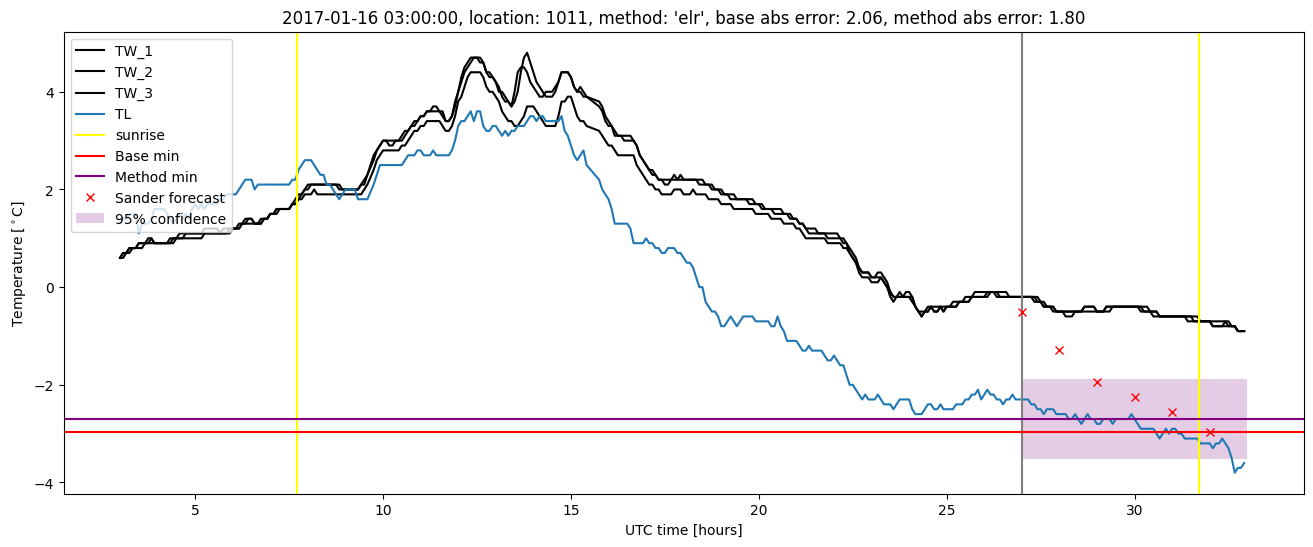
Extended logistic regression plots