GMS location: 101
Random forest results
| names |
period |
power |
significance |
meanSquareError |
absError |
maxError |
CRPS |
IGN |
| baseline |
winter 2016 |
0.977 |
0.036 |
0.390 |
0.449 |
2.465 |
NaN |
NaN |
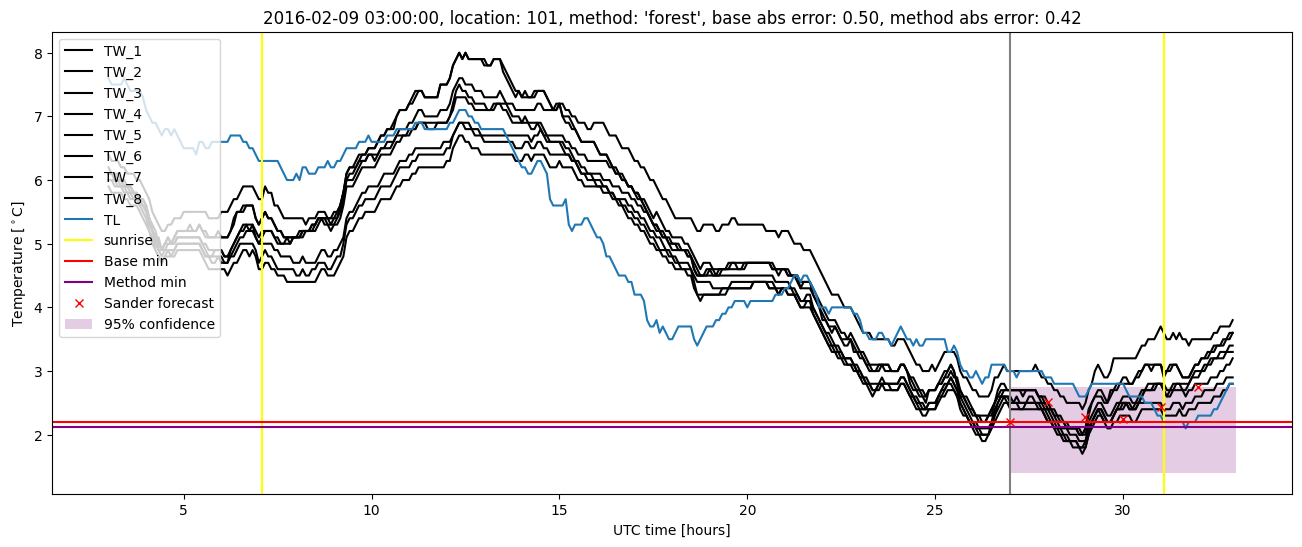
| forest |
winter 2016 |
0.966 |
0.000e+00 |
0.265 |
0.372 |
2.453 |
0.459 |
3.677 |
| baseline |
winter 2017 |
0.974 |
0.026 |
0.560 |
0.537 |
2.964 |
NaN |
NaN |
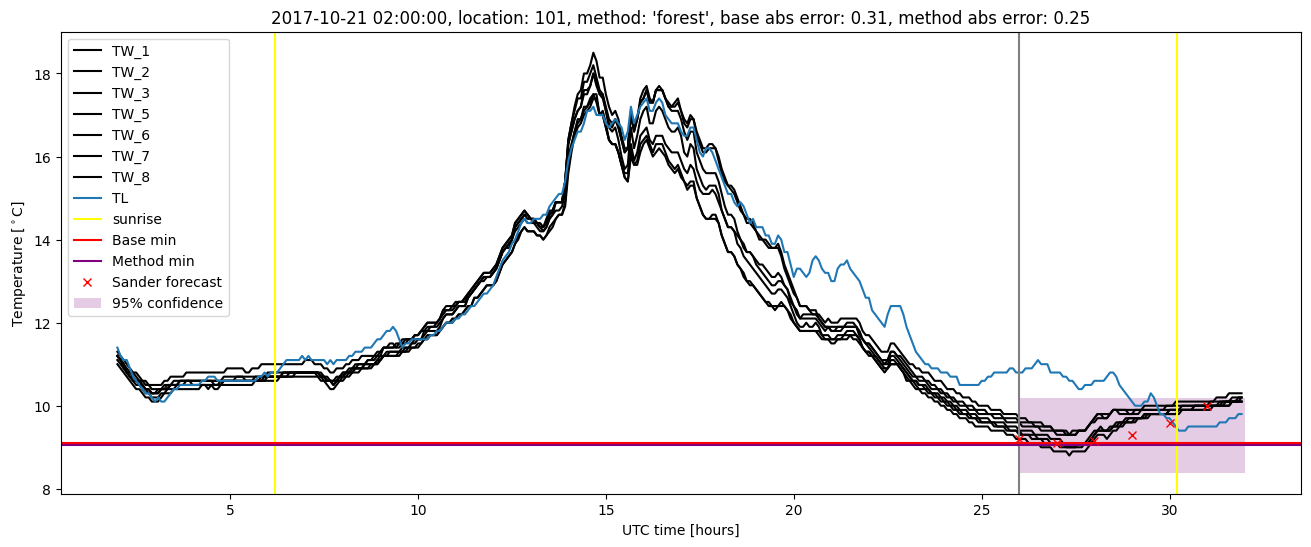
| forest |
winter 2017 |
0.983 |
0.026 |
0.349 |
0.417 |
2.236 |
0.453 |
3.703 |
| baseline |
winter 2018 |
0.977 |
0.067 |
0.441 |
0.496 |
2.166 |
NaN |
NaN |
| forest |
winter 2018 |
0.985 |
0.067 |
0.332 |
0.416 |
2.216 |
0.464 |
3.826 |
| baseline |
winter 2019 |
0.993 |
0.071 |
0.310 |
0.414 |
1.857 |
NaN |
NaN |
| forest |
winter 2019 |
1.000 |
0.071 |
0.219 |
0.350 |
1.610 |
0.460 |
3.428 |
| baseline |
all |
0.981 |
0.045 |
0.421 |
0.471 |
2.964 |
NaN |
NaN |
| forest |
all |
0.982 |
0.036 |
0.289 |
0.387 |
2.453 |
0.459 |
3.658 |
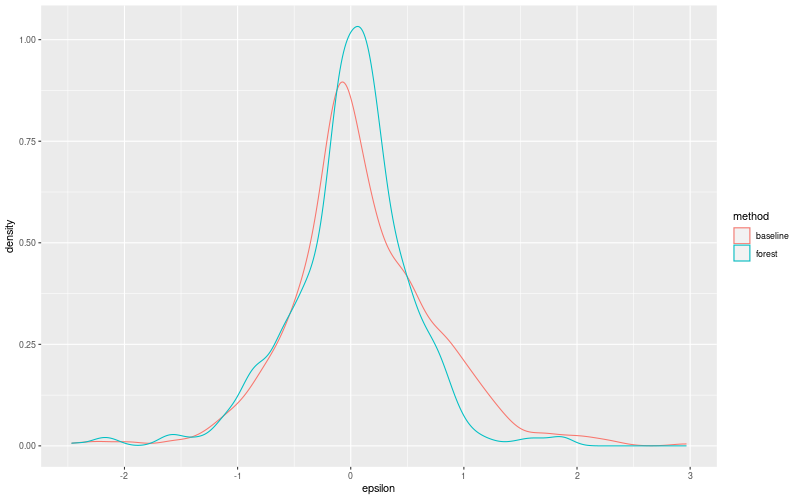
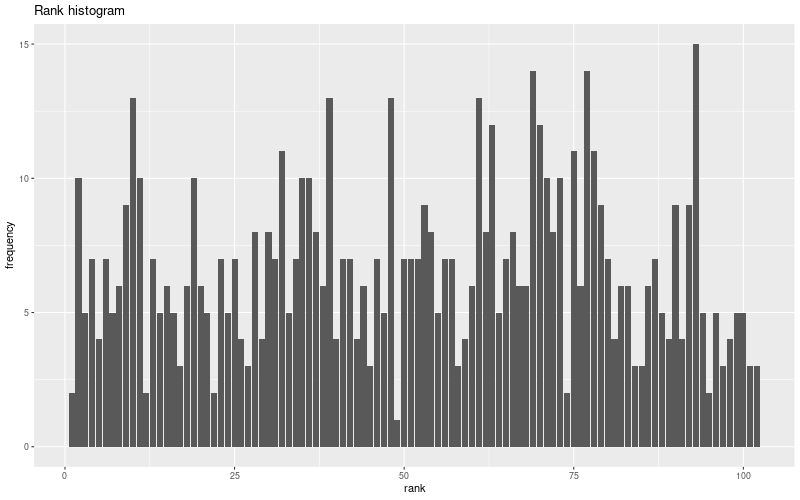
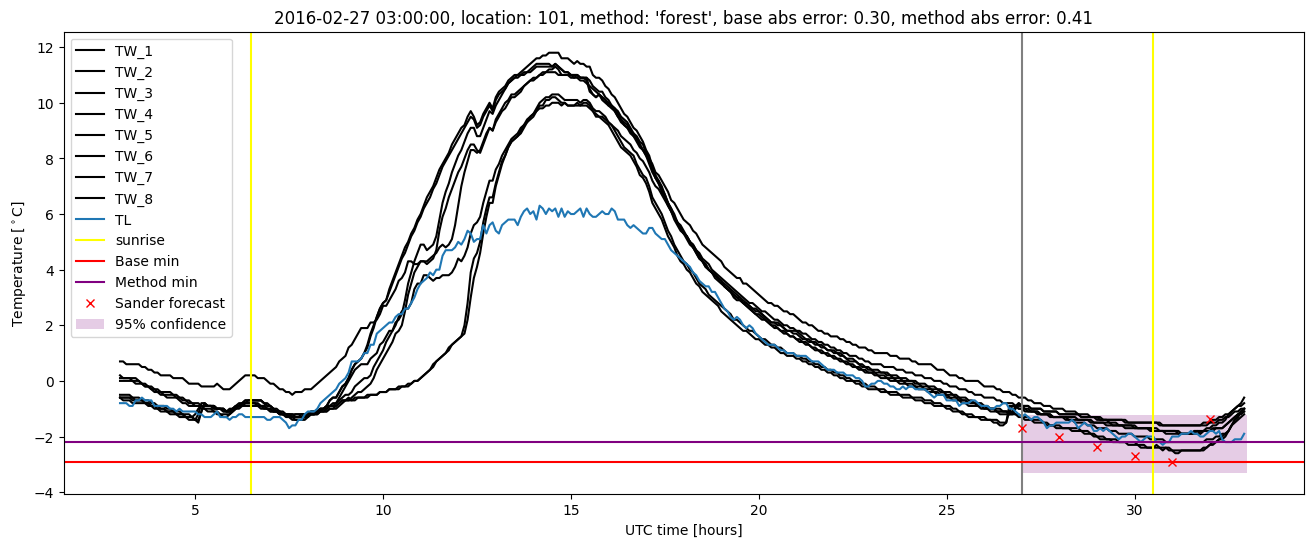
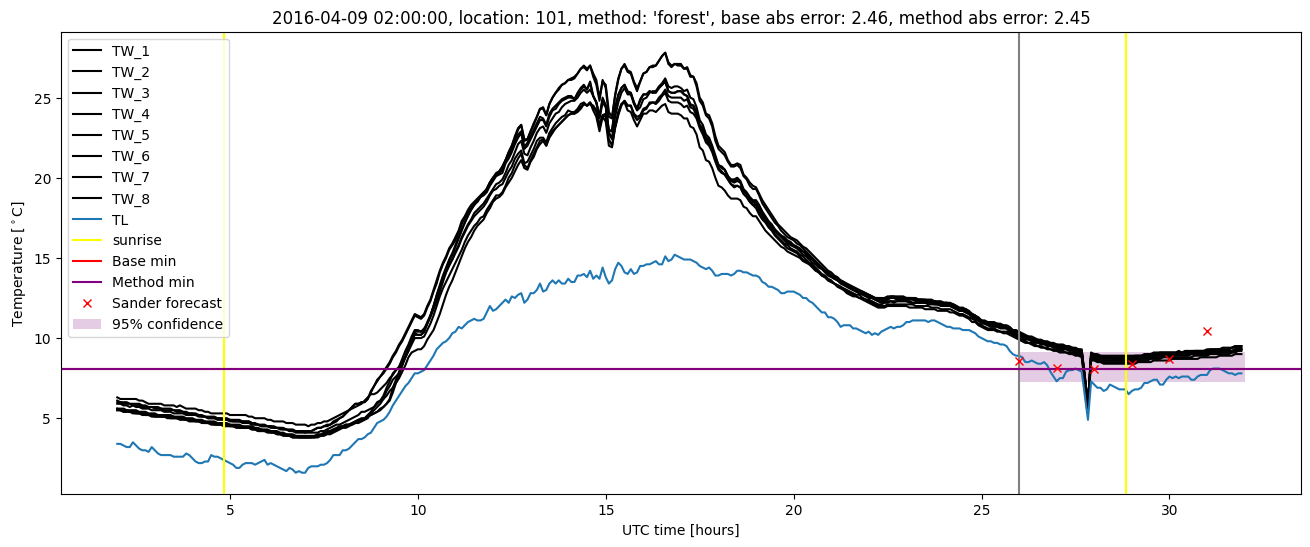
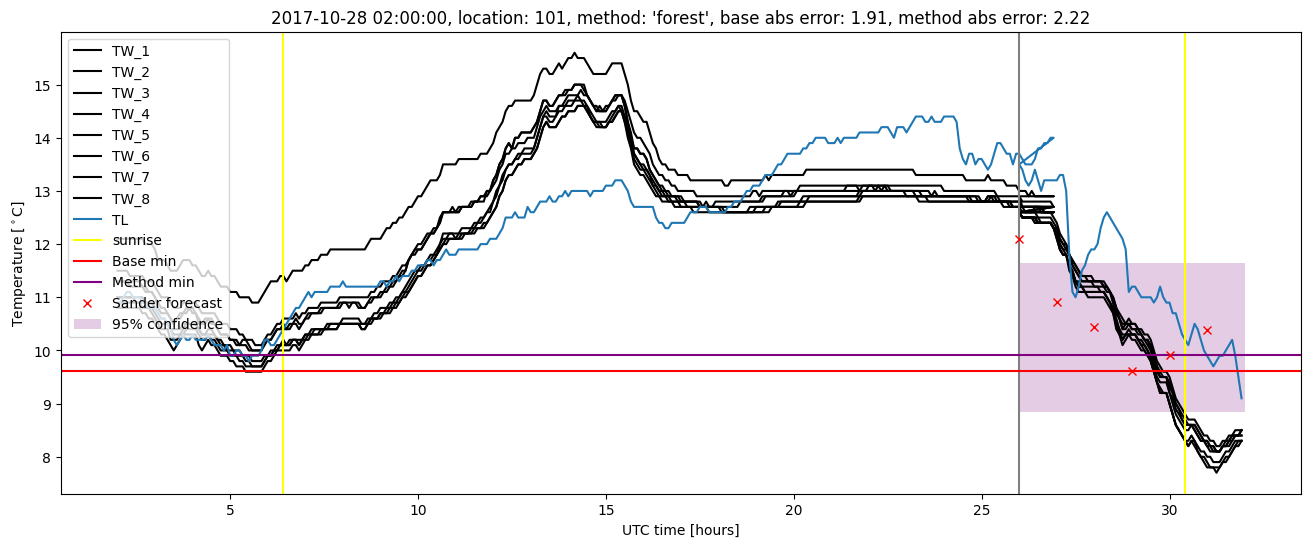
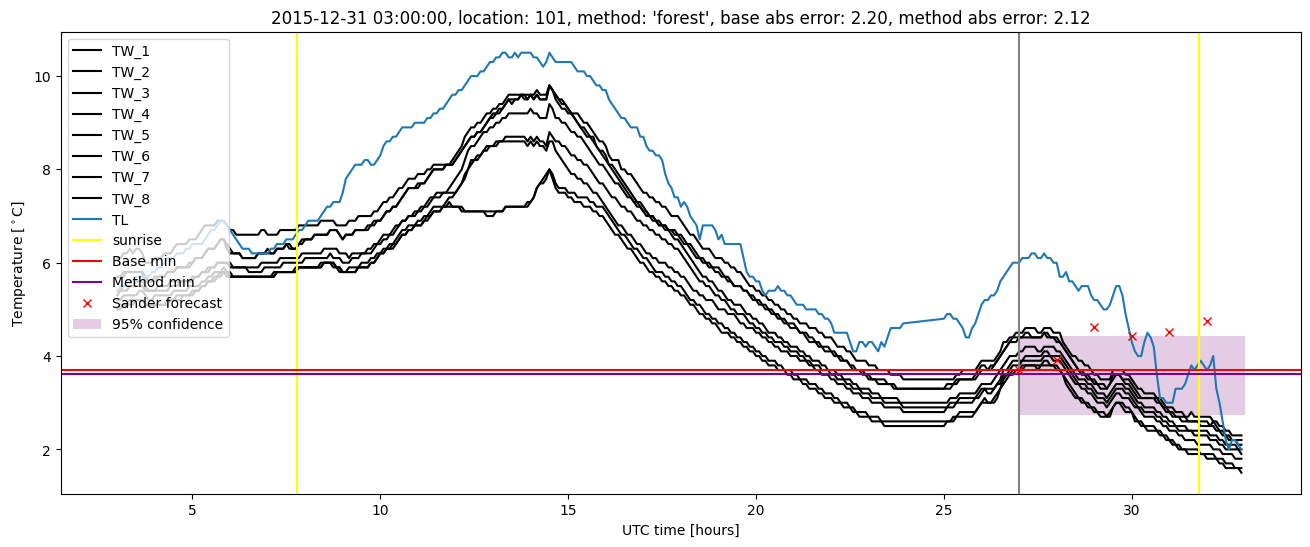
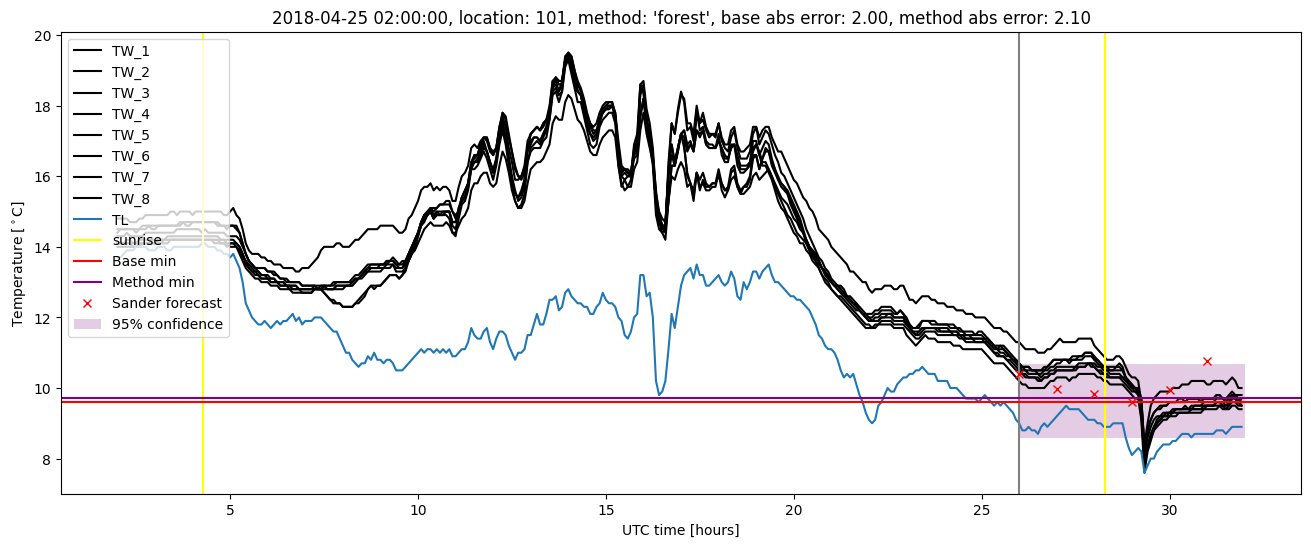
Random forest plots

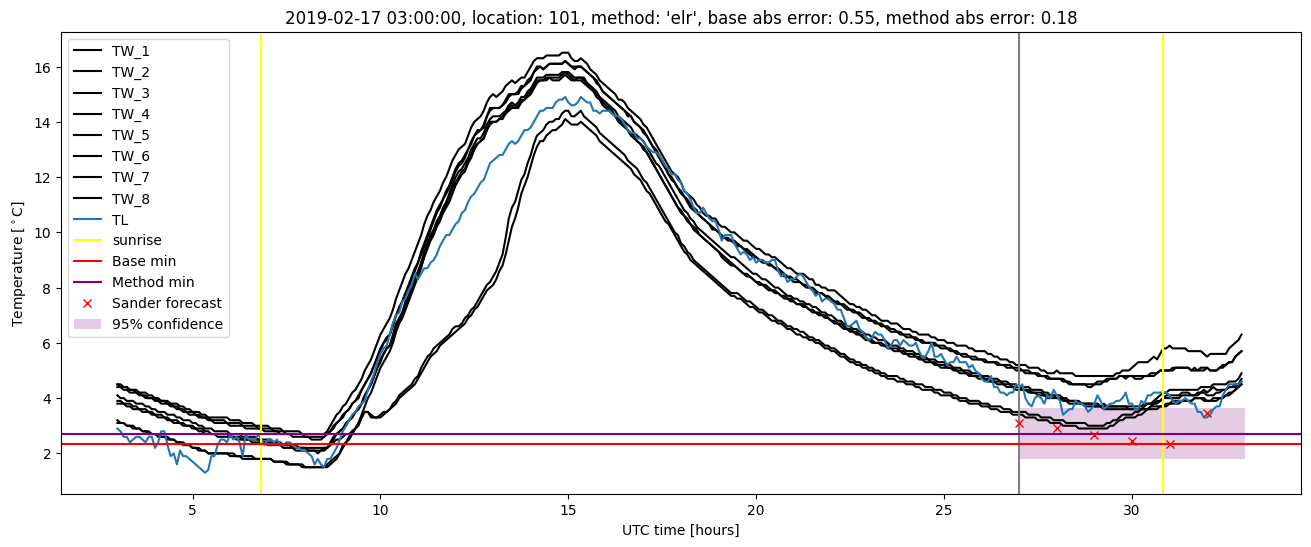
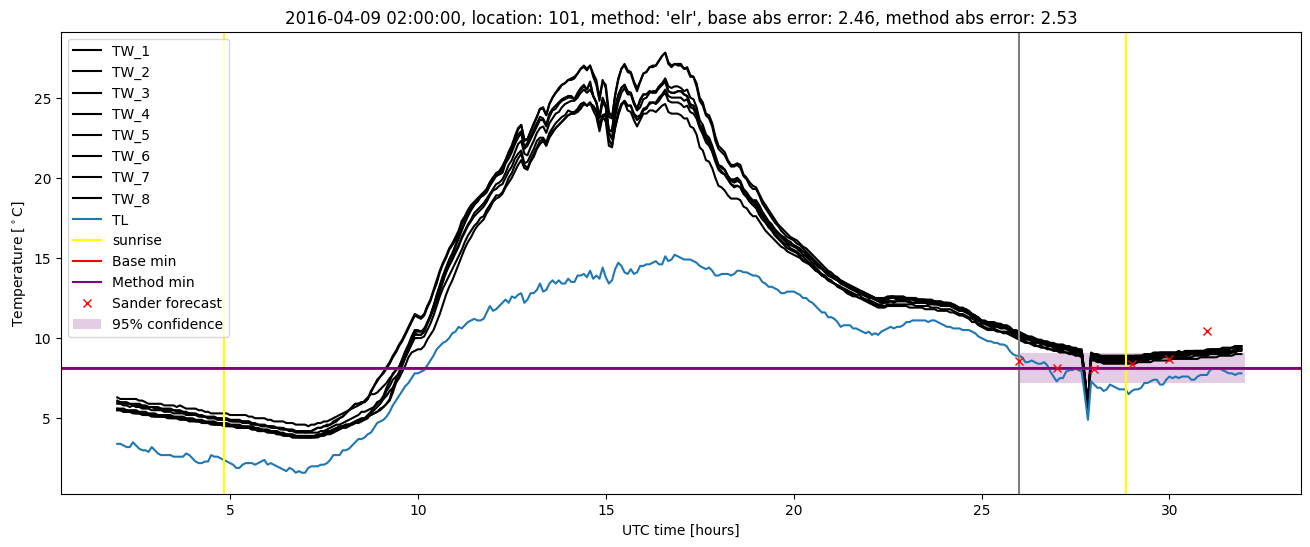
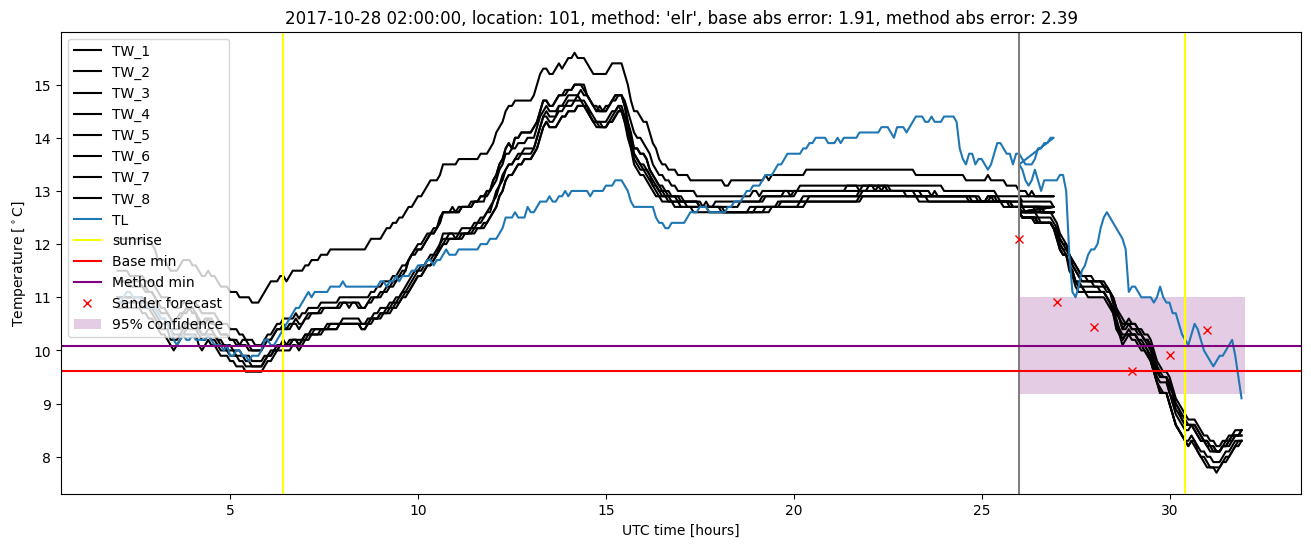
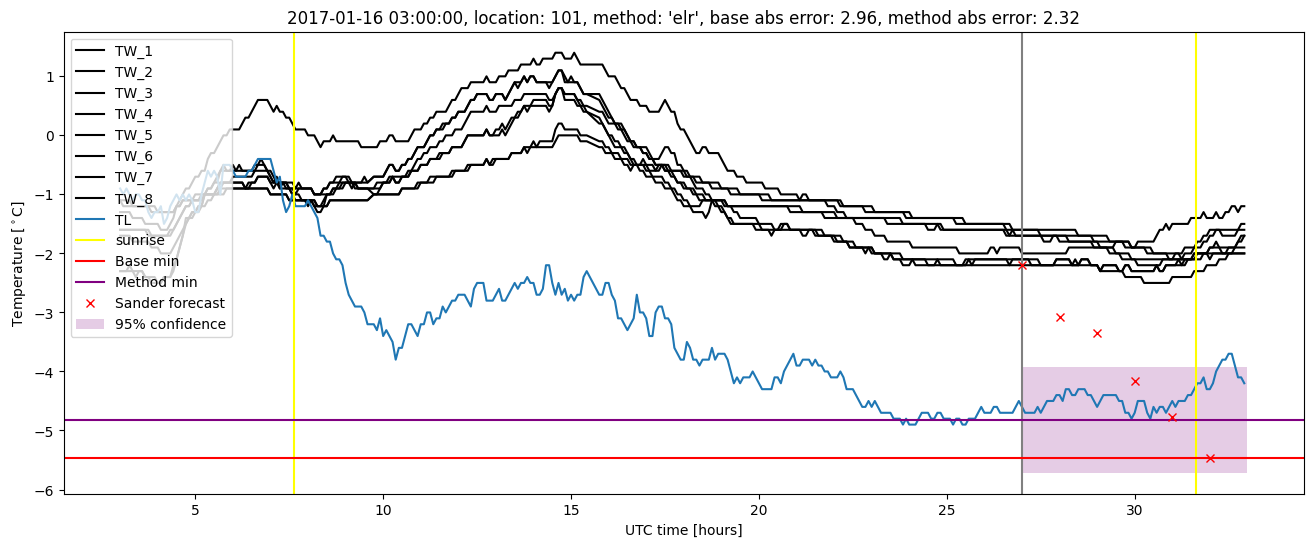
Extended logistic regression results
| names |
period |
power |
significance |
meanSquareError |
absError |
maxError |
CRPS |
IGN |
| baseline |
winter 2016 |
0.977 |
0.036 |
0.390 |
0.449 |
2.465 |
NaN |
NaN |
| elr |
winter 2016 |
0.983 |
0.036 |
0.321 |
0.432 |
2.532 |
0.528 |
3.449 |
| baseline |
winter 2017 |
0.974 |
0.026 |
0.560 |
0.537 |
2.964 |
NaN |
NaN |
| elr |
winter 2017 |
0.983 |
0.051 |
0.380 |
0.447 |
2.323 |
0.455 |
2.833 |
| baseline |
winter 2018 |
0.977 |
0.067 |
0.441 |
0.496 |
2.166 |
NaN |
NaN |
| elr |
winter 2018 |
0.992 |
0.067 |
0.360 |
0.447 |
2.391 |
0.527 |
3.631 |
| baseline |
winter 2019 |
0.993 |
0.071 |
0.310 |
0.414 |
1.857 |
NaN |
NaN |
| elr |
winter 2019 |
1.000 |
0.071 |
0.292 |
0.422 |
1.710 |
0.517 |
3.261 |
| baseline |
all |
0.981 |
0.045 |
0.421 |
0.471 |
2.964 |
NaN |
NaN |
| elr |
all |
0.990 |
0.054 |
0.337 |
0.436 |
2.532 |
0.509 |
3.308 |
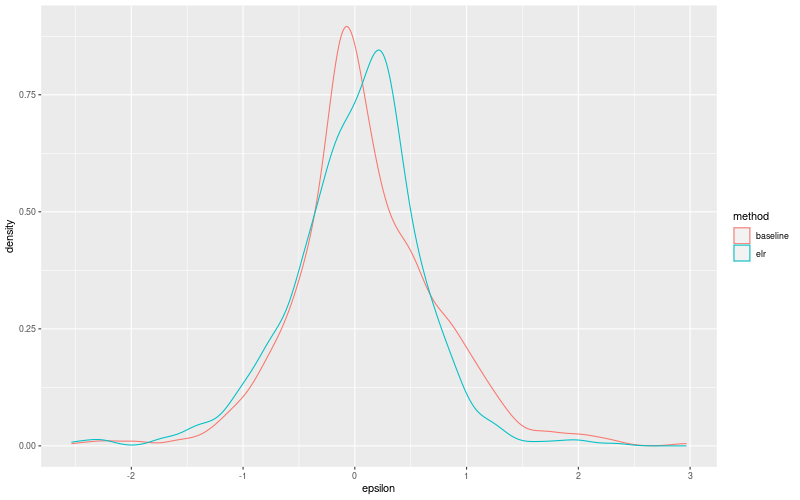
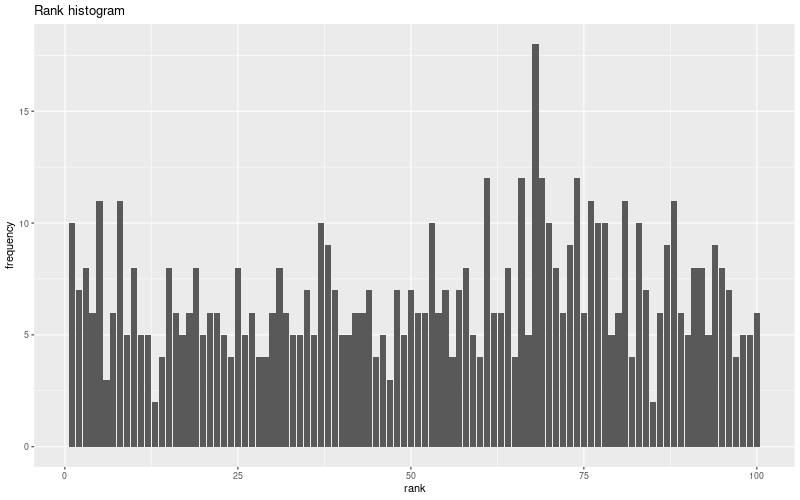
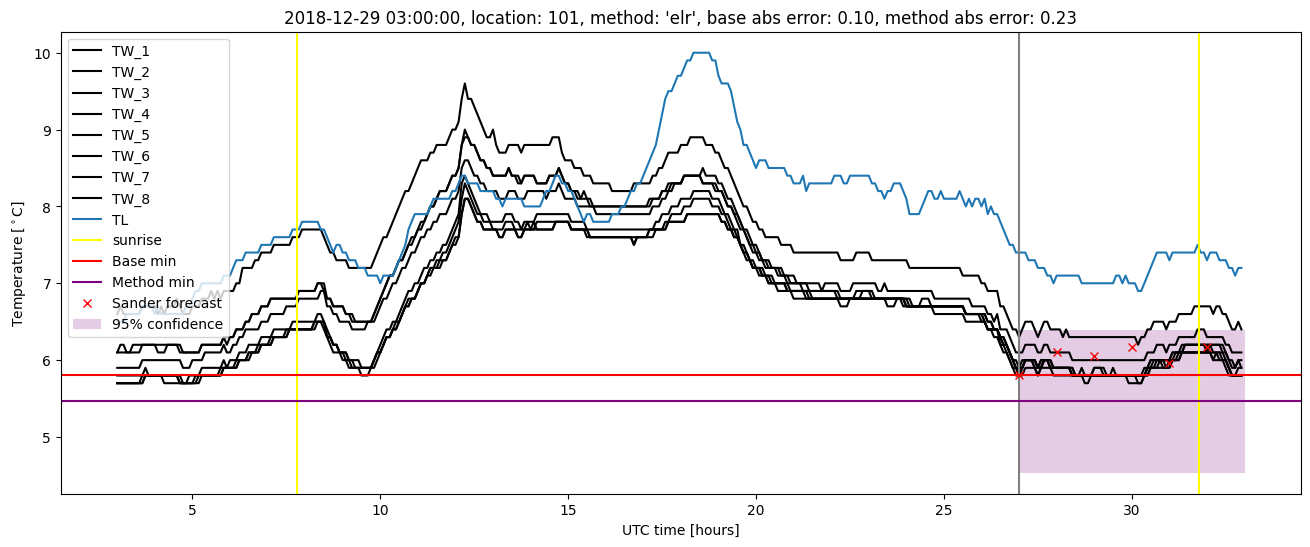
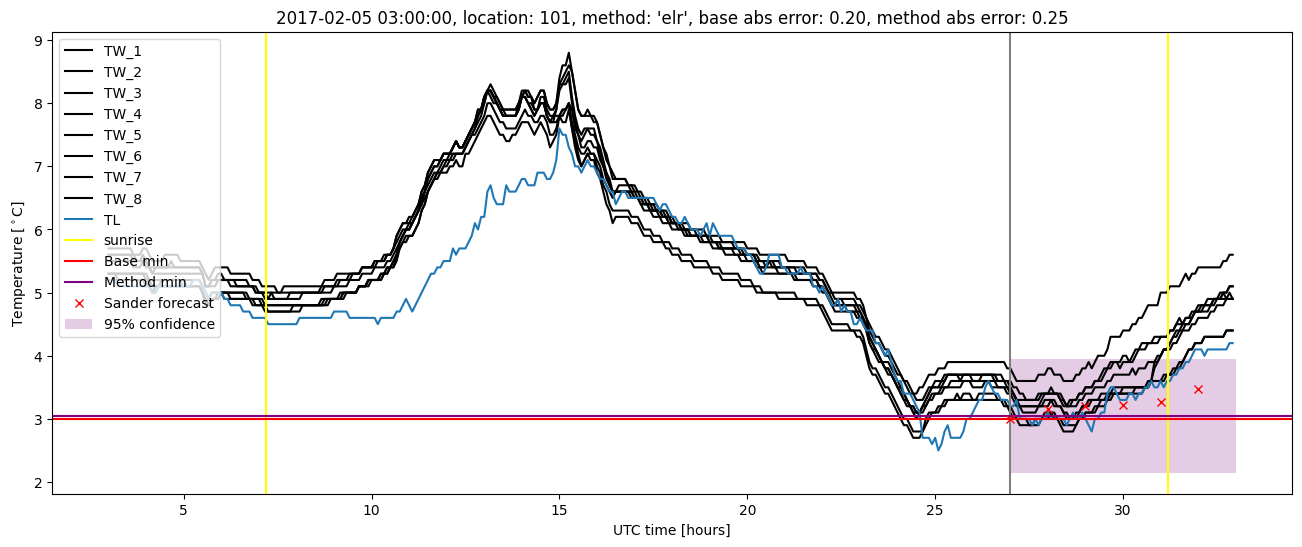
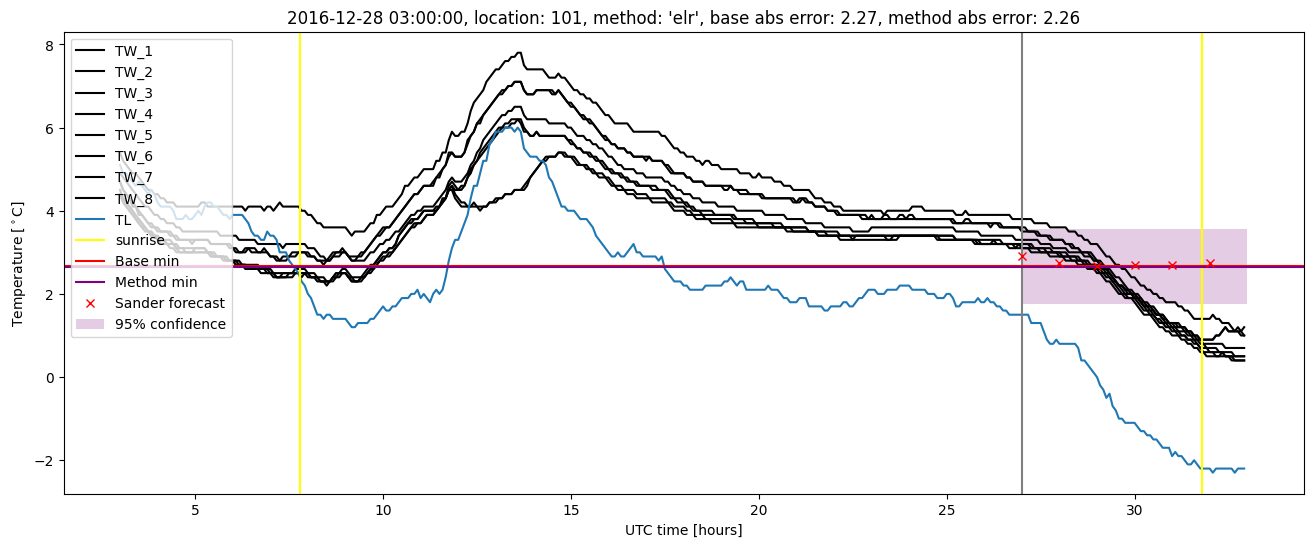
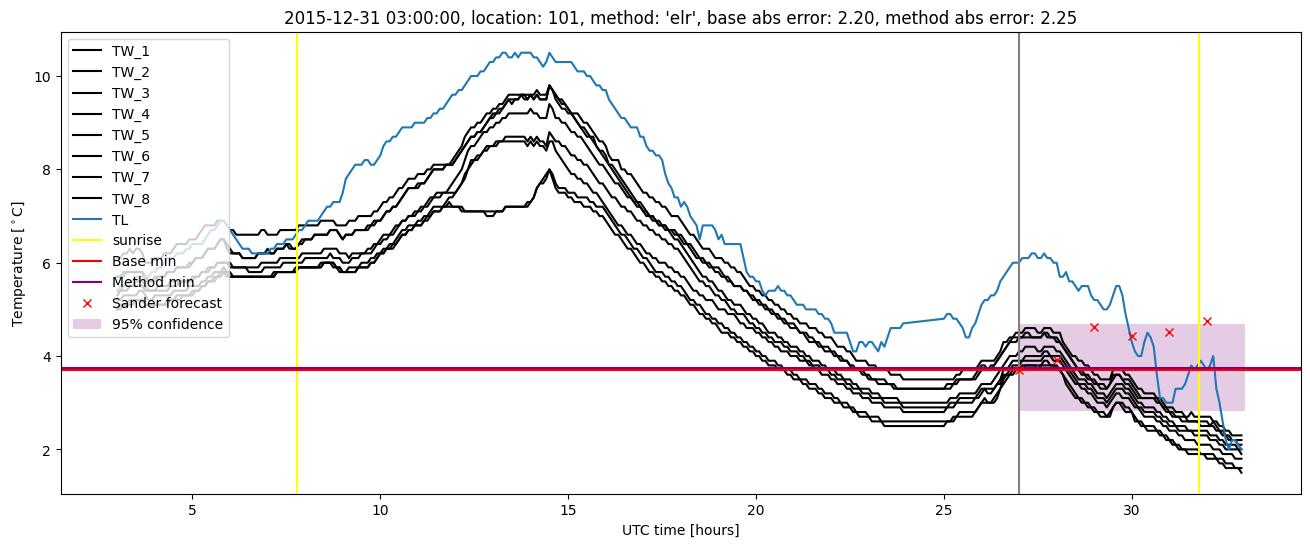
Extended logistic regression plots