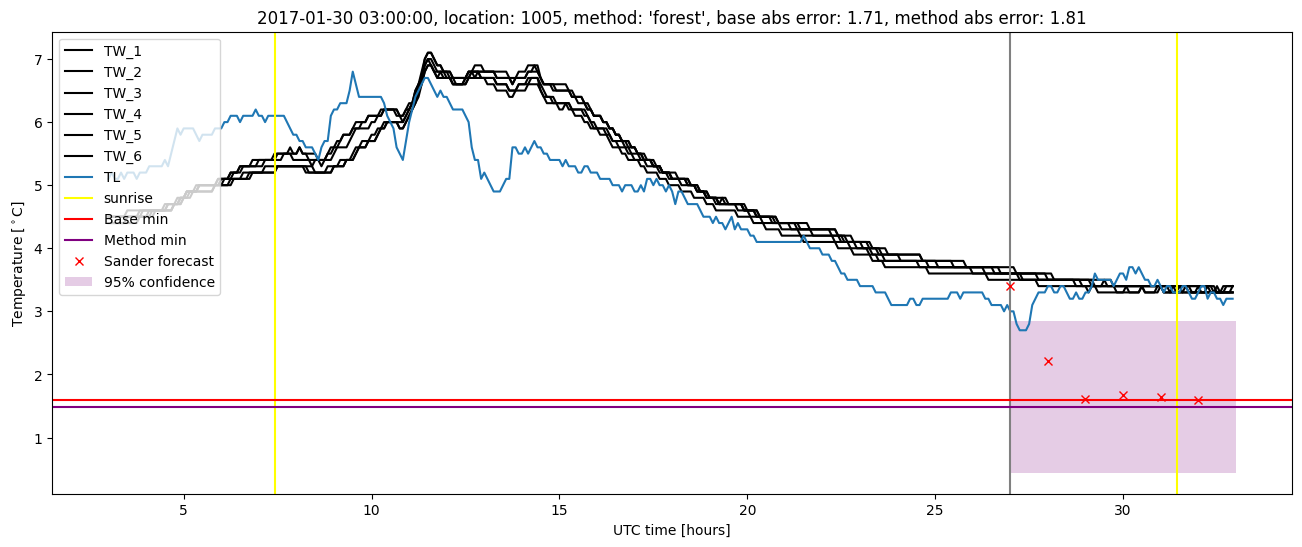
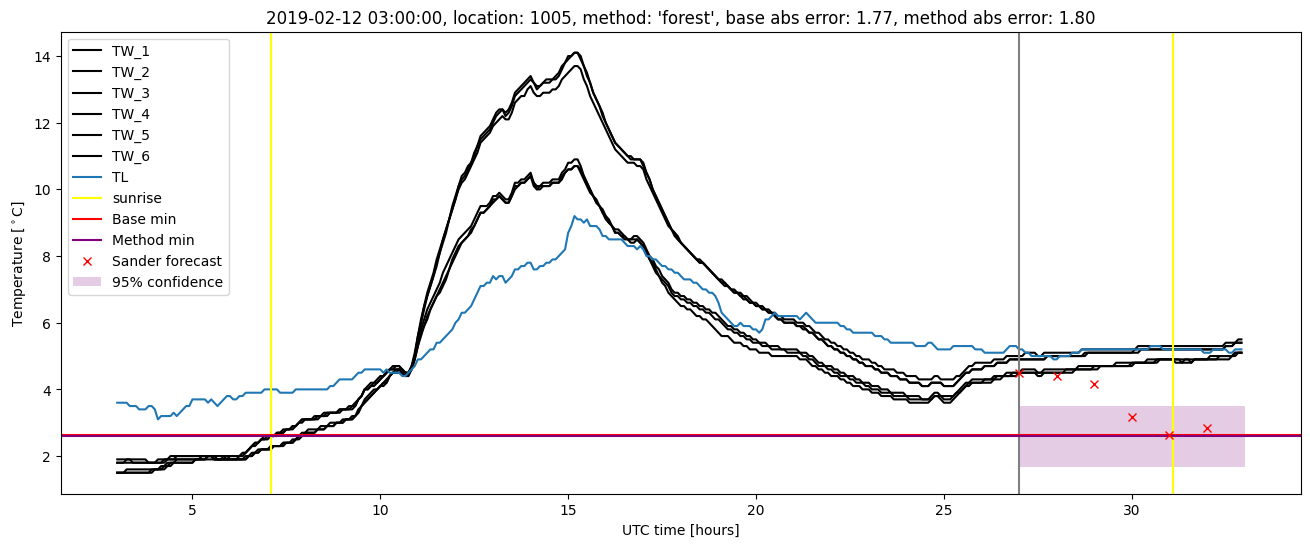
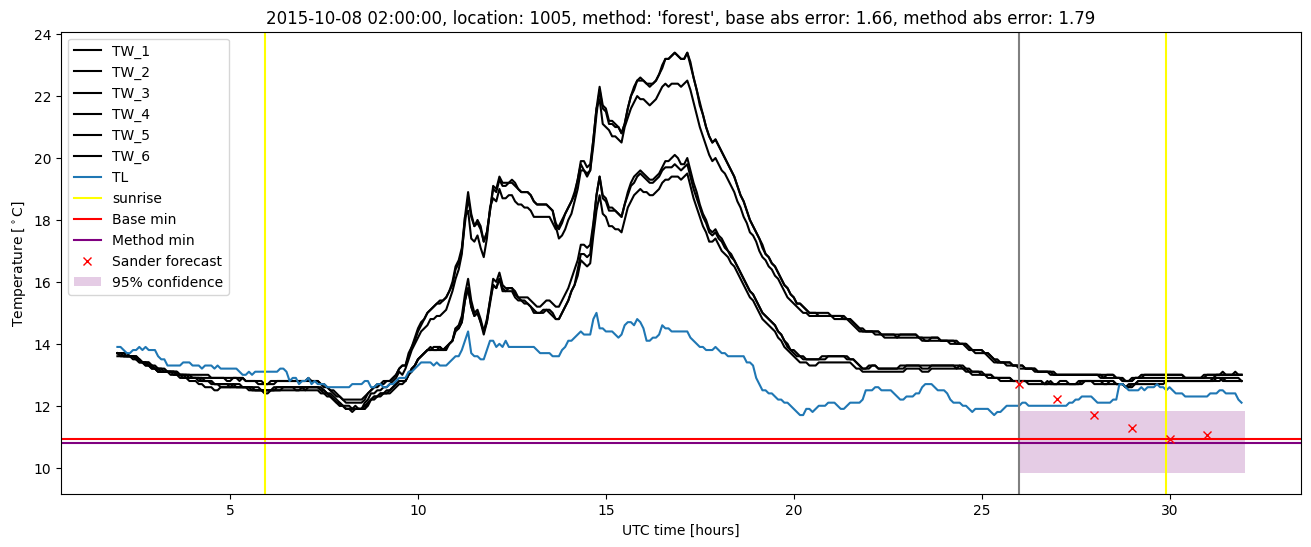
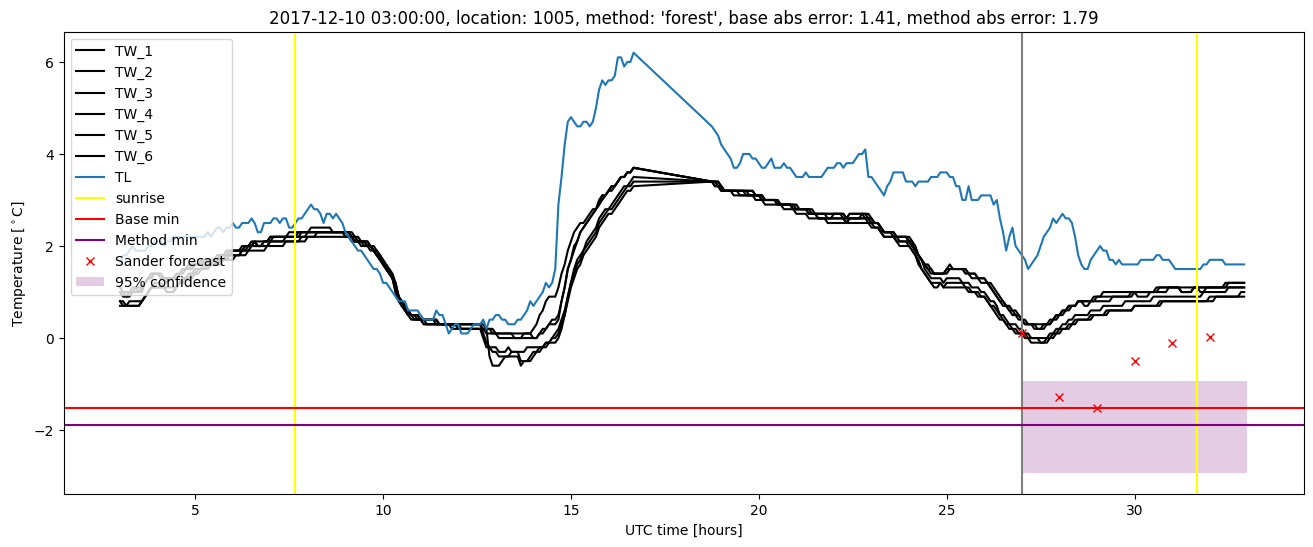
GMS location: 1005
Random forest results
| names |
period |
power |
significance |
meanSquareError |
absError |
maxError |
CRPS |
IGN |
| baseline |
winter 2016 |
1.000 |
0.133 |
0.308 |
0.424 |
1.660 |
NaN |
NaN |
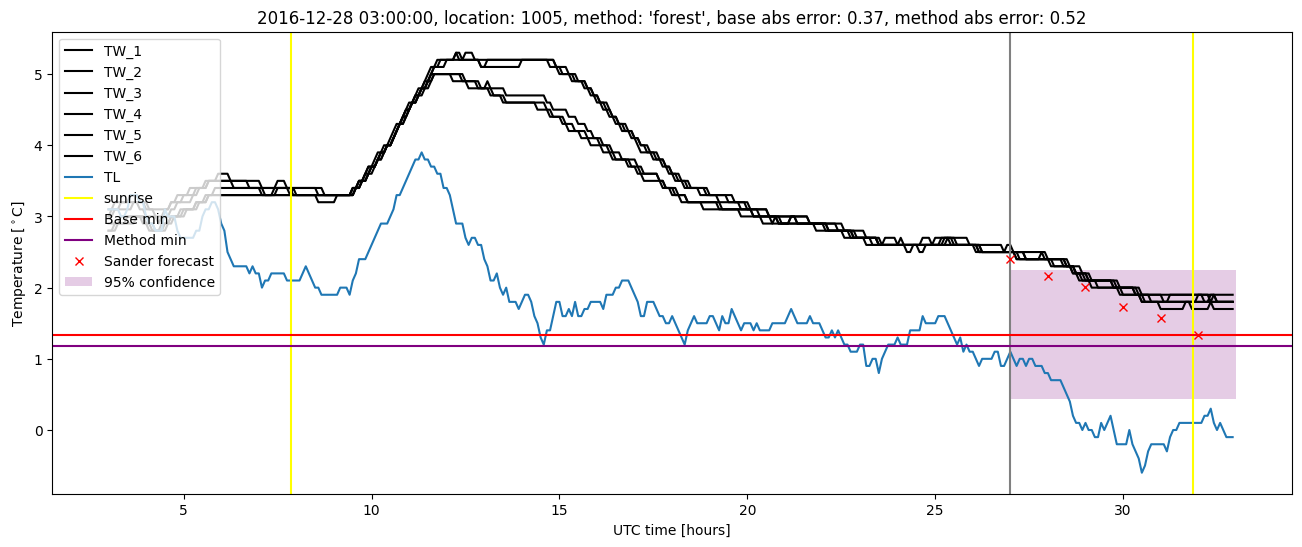
| forest |
winter 2016 |
1.000 |
0.067 |
0.274 |
0.403 |
1.790 |
0.558 |
5.933 |
| baseline |
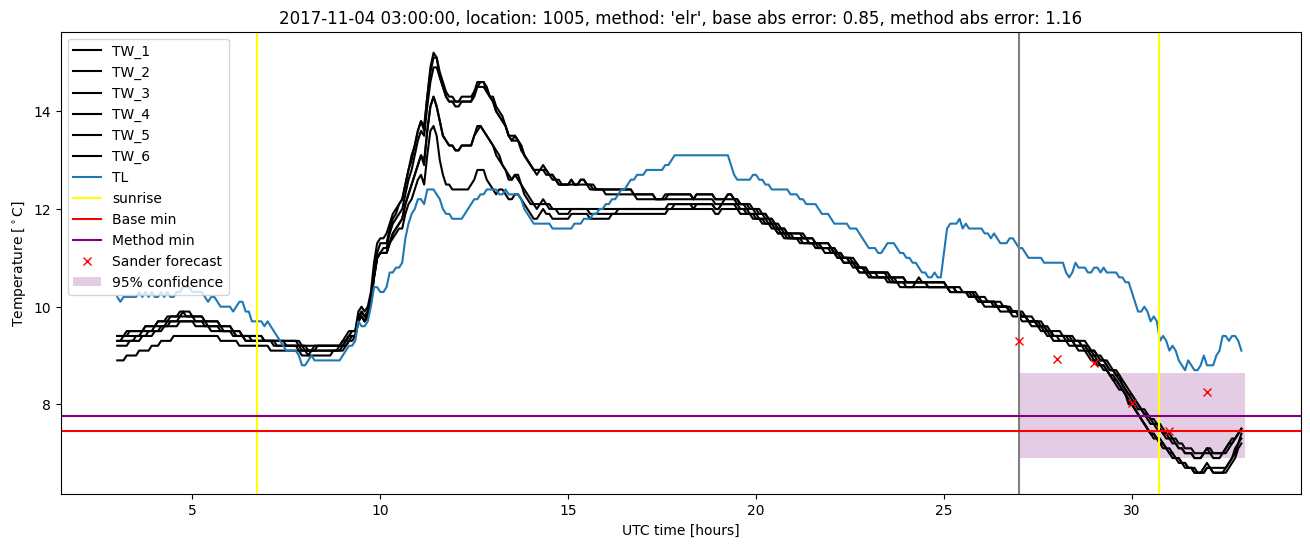
winter 2017 |
0.990 |
0.143 |
0.483 |
0.468 |
3.585 |
NaN |
NaN |
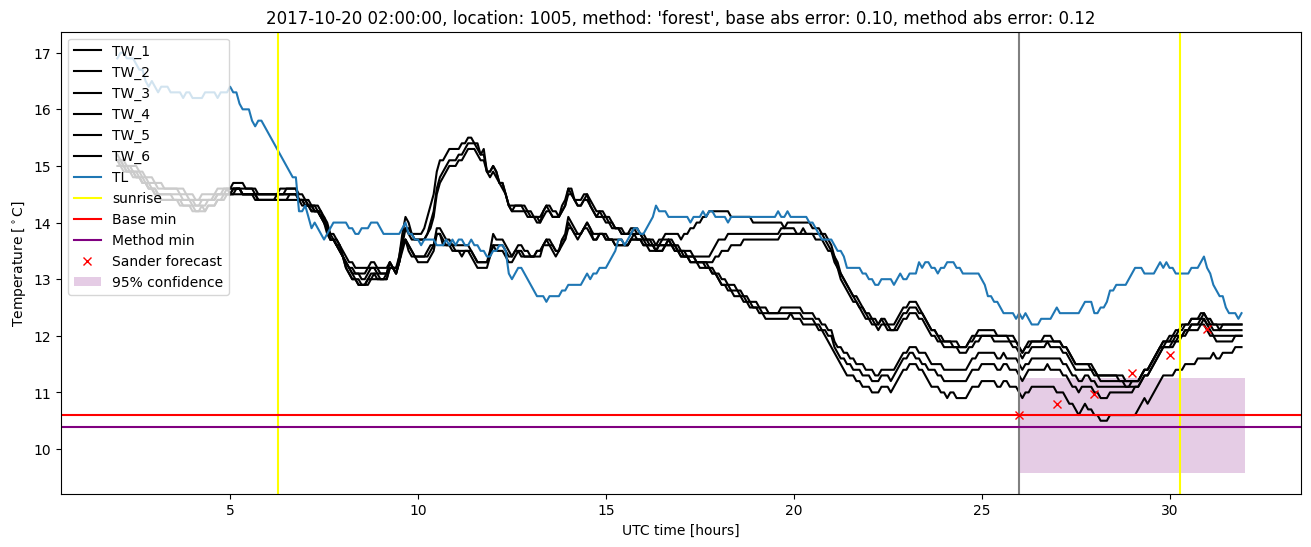
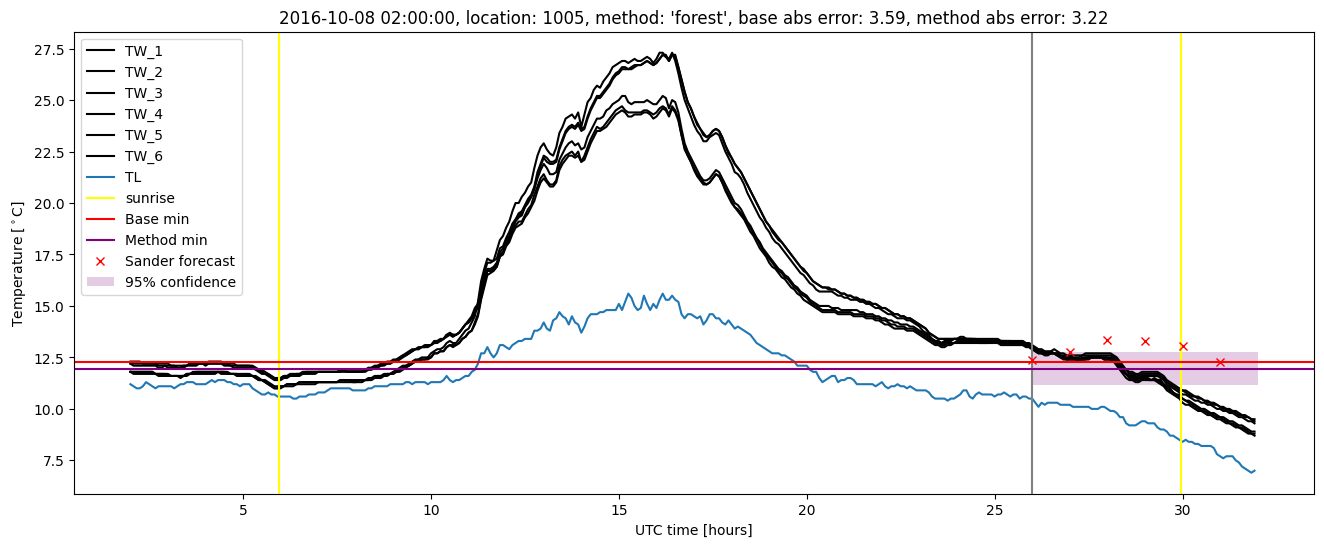
| forest |
winter 2017 |
0.970 |
0.143 |
0.399 |
0.432 |
3.221 |
0.579 |
5.975 |
| baseline |
winter 2018 |
0.994 |
0.120 |
0.280 |
0.401 |
1.720 |
NaN |
NaN |
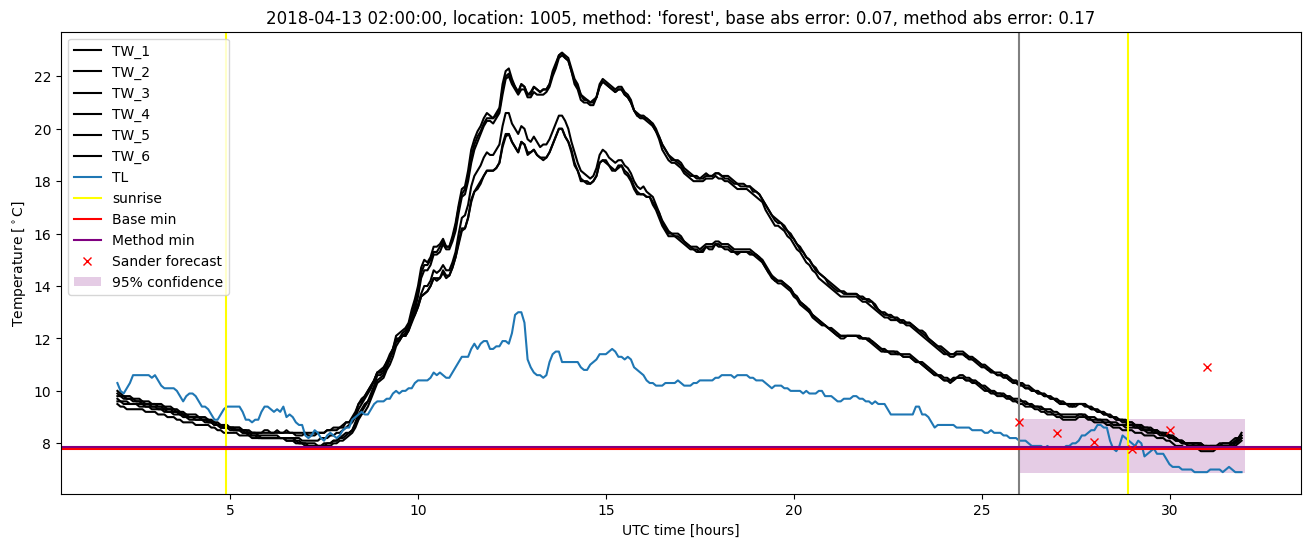
| forest |
winter 2018 |
0.975 |
0.120 |
0.227 |
0.342 |
1.790 |
0.563 |
3.546 |
| baseline |
winter 2019 |
0.987 |
0.000e+00 |
0.222 |
0.327 |
1.770 |
NaN |
NaN |
| forest |
winter 2019 |
0.974 |
0.000e+00 |
0.239 |
0.354 |
1.798 |
0.612 |
4.432 |
| baseline |
all |
0.993 |
0.116 |
0.312 |
0.402 |
3.585 |
NaN |
NaN |
| forest |
all |
0.982 |
0.101 |
0.276 |
0.380 |
3.221 |
0.576 |
4.930 |
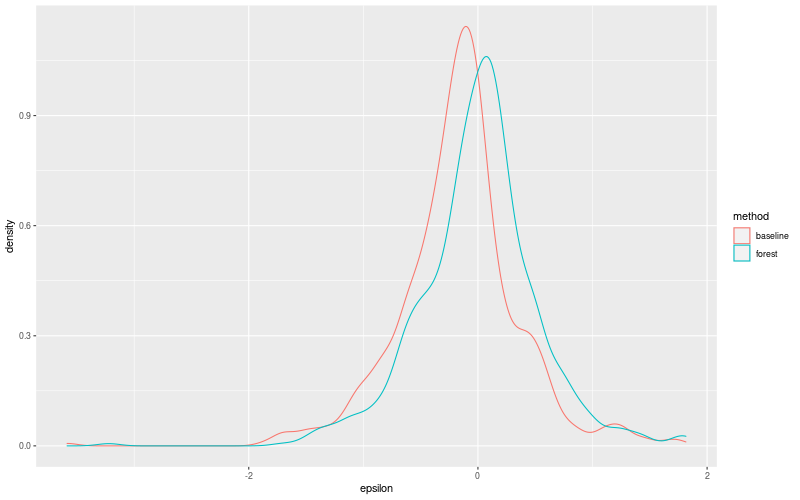
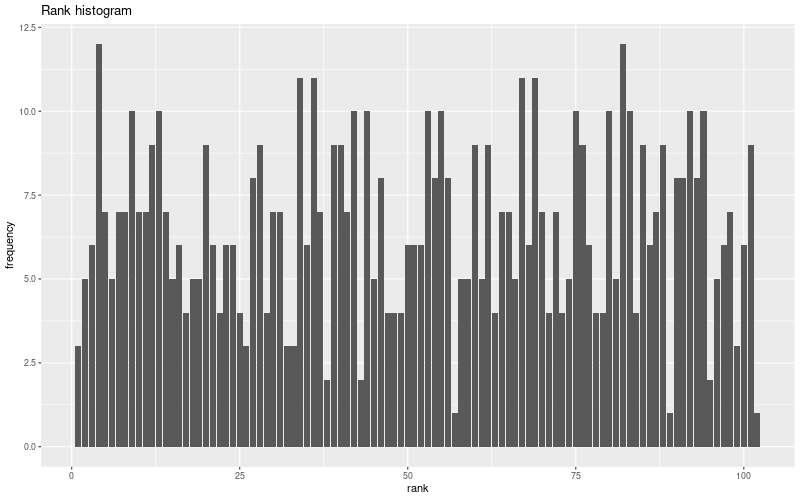
Random forest plots
Extended logistic regression results
| names |
period |
power |
significance |
meanSquareError |
absError |
maxError |
CRPS |
IGN |
| baseline |
winter 2016 |
1.000 |
0.133 |
0.308 |
0.424 |
1.660 |
NaN |
NaN |
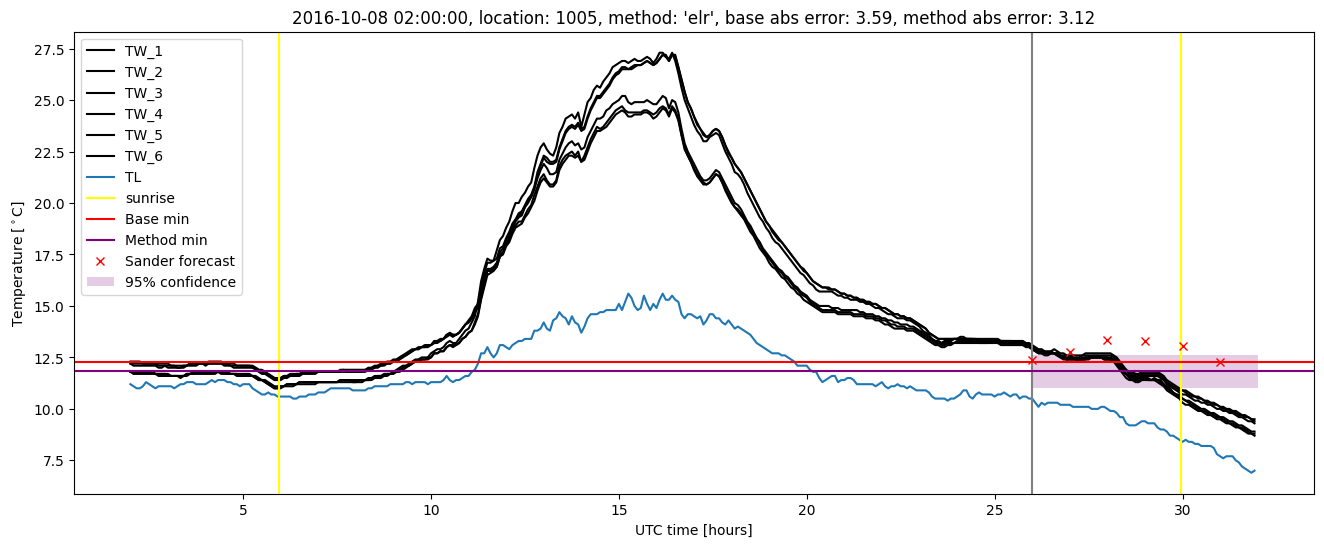
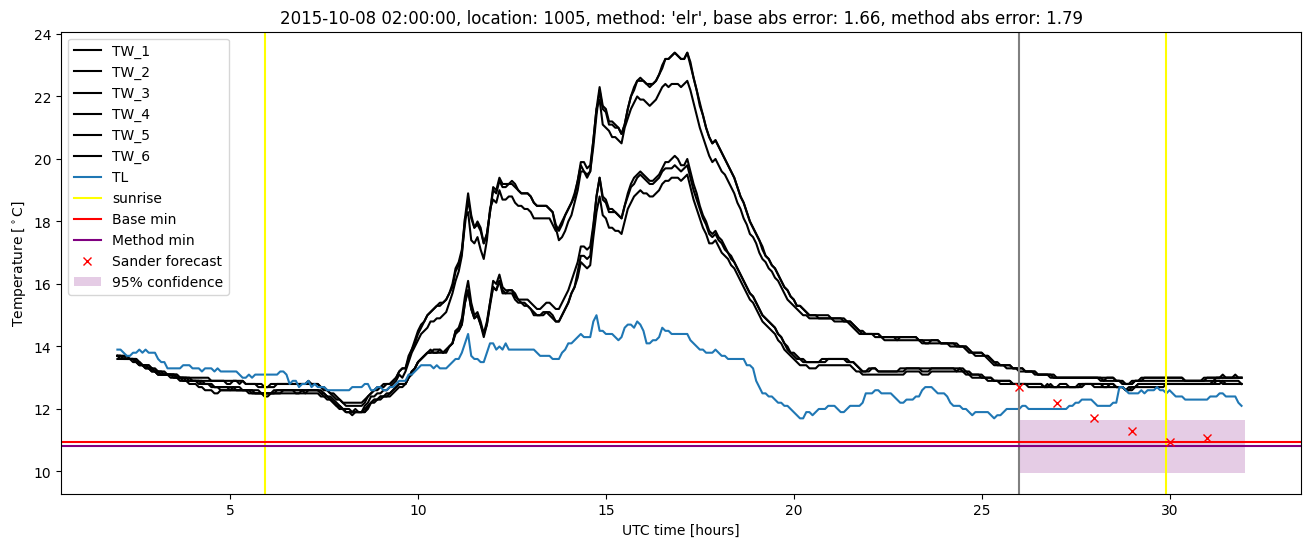
| elr |
winter 2016 |
1.000 |
0.067 |
0.289 |
0.420 |
1.794 |
0.636 |
6.506 |
| baseline |
winter 2017 |
0.990 |
0.143 |
0.483 |
0.468 |
3.585 |
NaN |
NaN |
| elr |
winter 2017 |
0.960 |
0.143 |
0.430 |
0.476 |
3.123 |
0.673 |
9.299 |
| baseline |
winter 2018 |
0.994 |
0.120 |
0.280 |
0.401 |
1.720 |
NaN |
NaN |
| elr |
winter 2018 |
0.981 |
0.080 |
0.243 |
0.373 |
1.709 |
0.618 |
5.609 |
| baseline |
winter 2019 |
0.987 |
0.000e+00 |
0.222 |
0.327 |
1.770 |
NaN |
NaN |
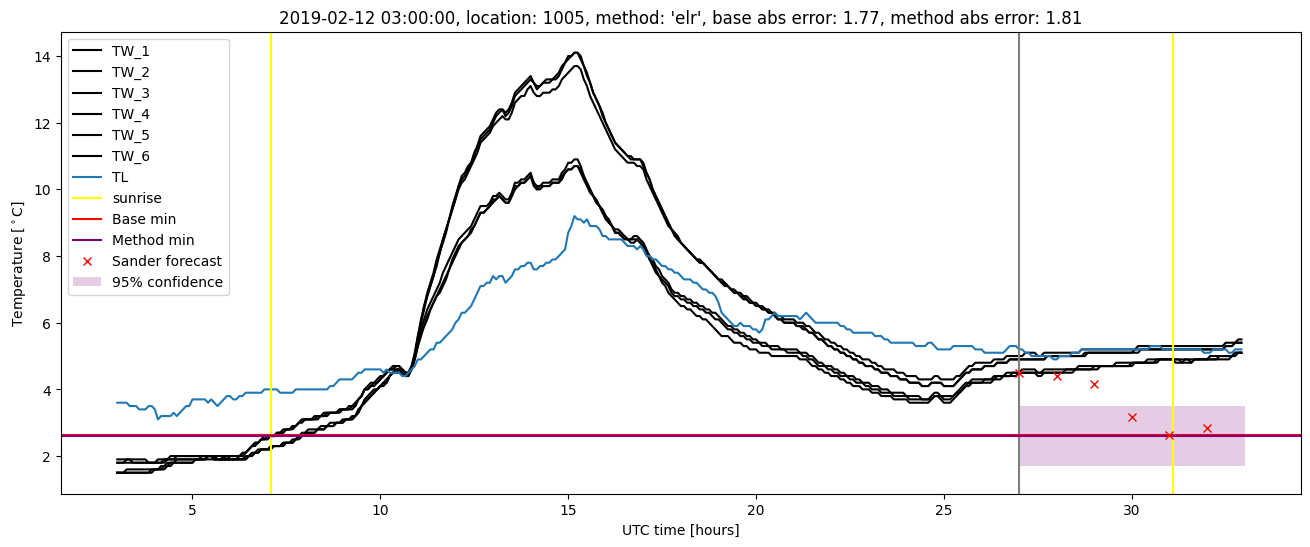
| elr |
winter 2019 |
0.980 |
0.000e+00 |
0.234 |
0.351 |
1.809 |
0.639 |
5.311 |
| baseline |
all |
0.993 |
0.116 |
0.312 |
0.402 |
3.585 |
NaN |
NaN |
| elr |
all |
0.983 |
0.087 |
0.289 |
0.401 |
3.123 |
0.638 |
6.484 |
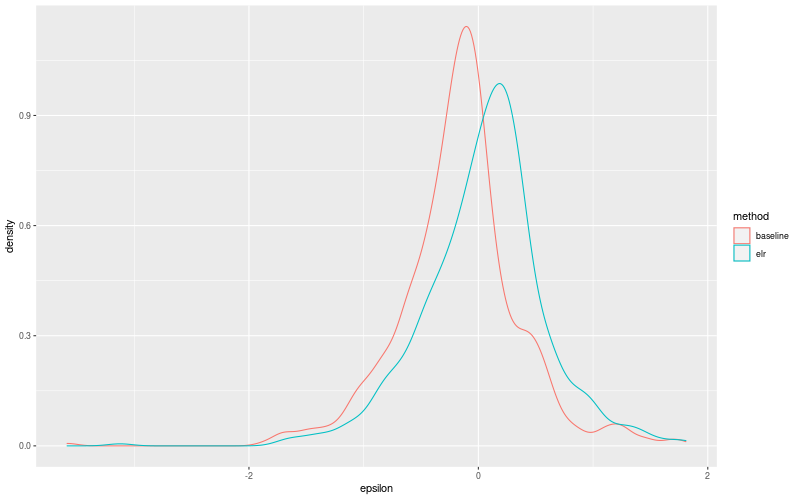
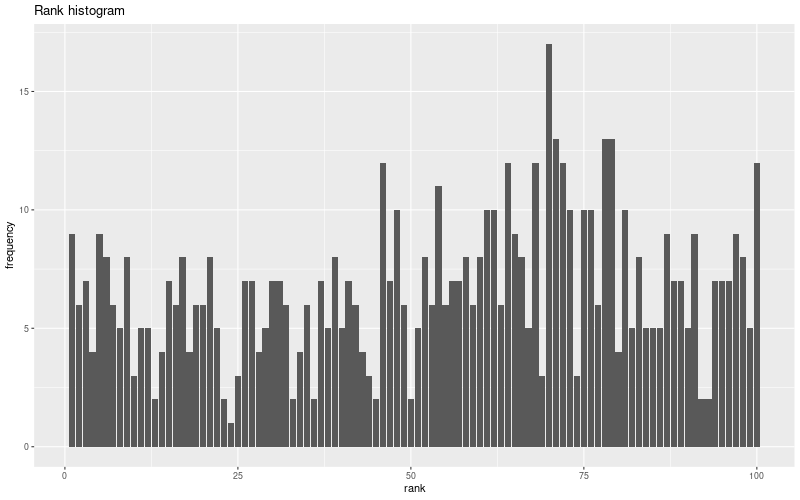
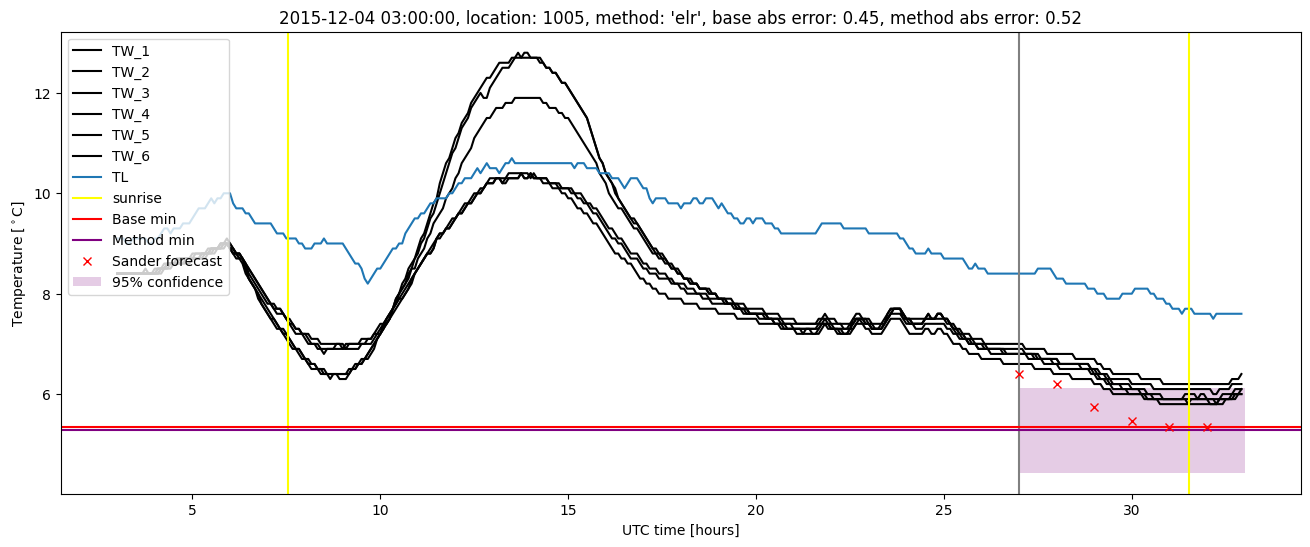
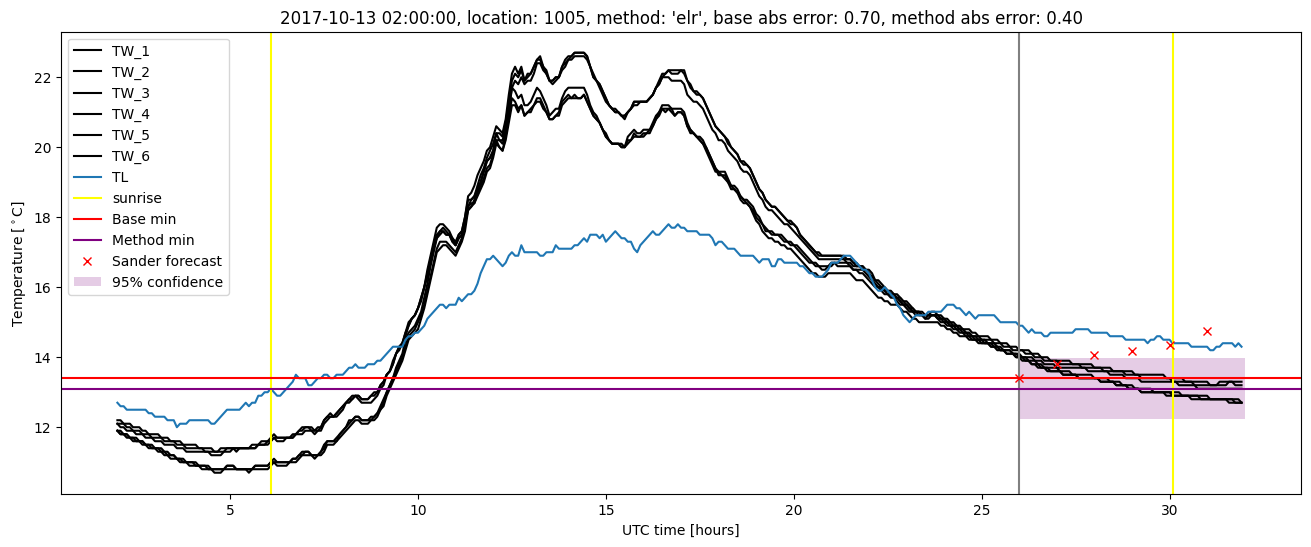
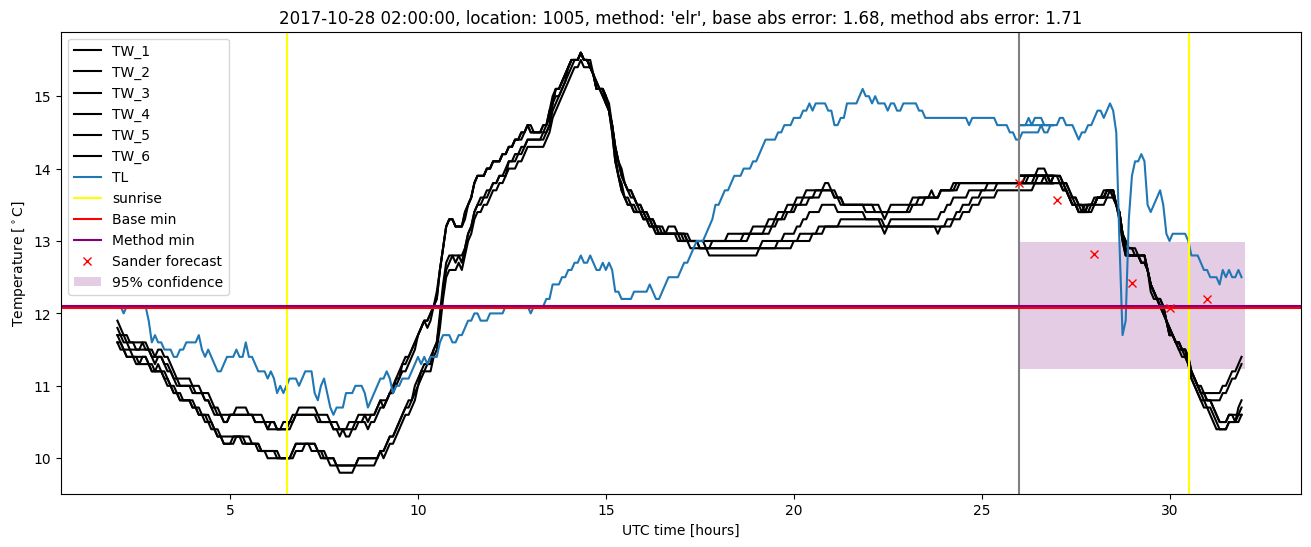
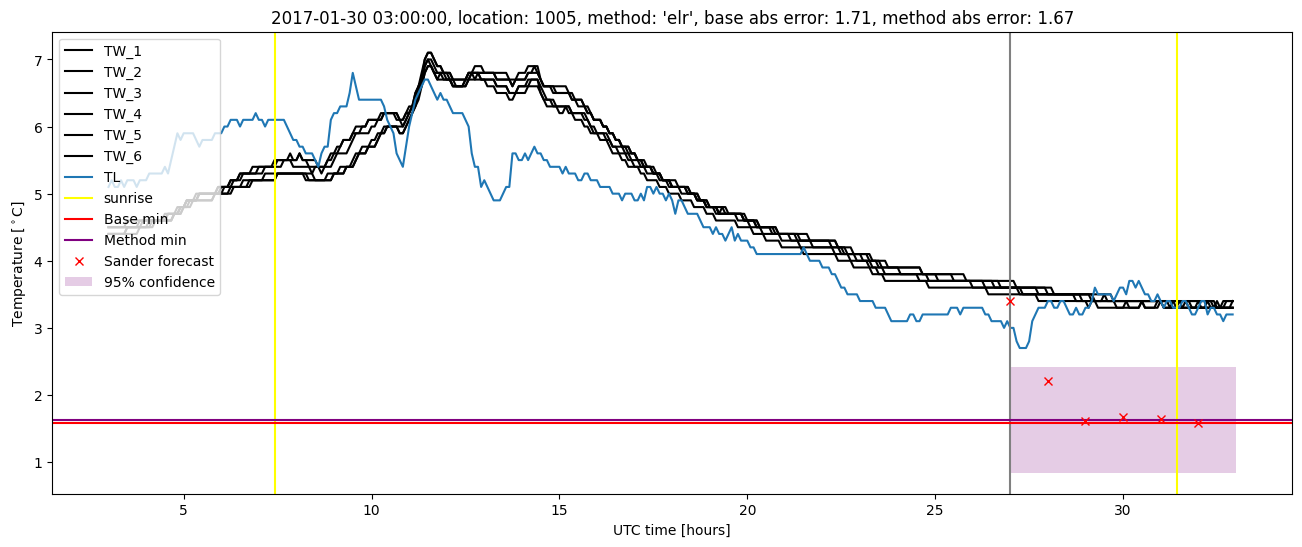
Extended logistic regression plots