GMS location: 1004
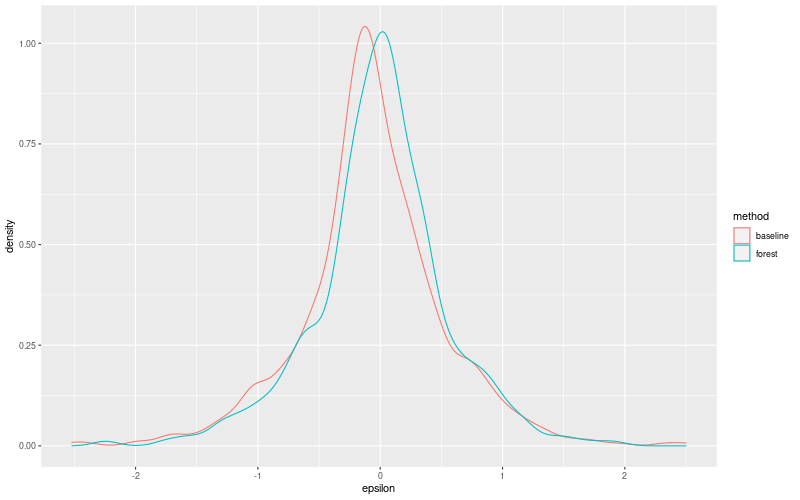
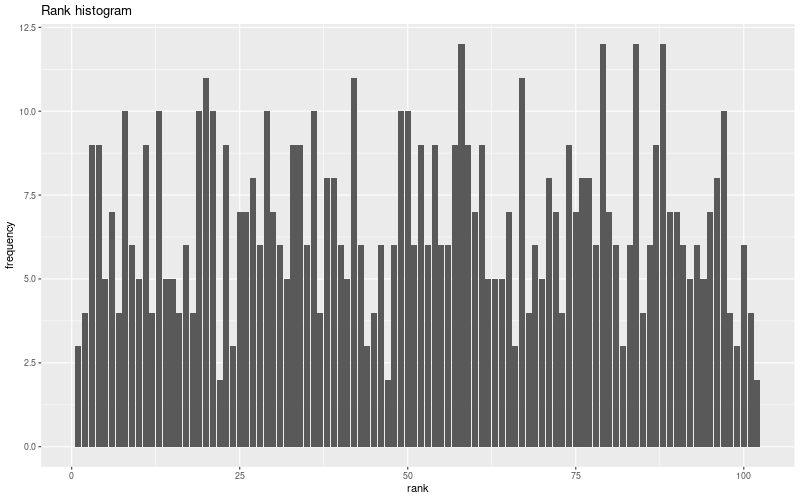
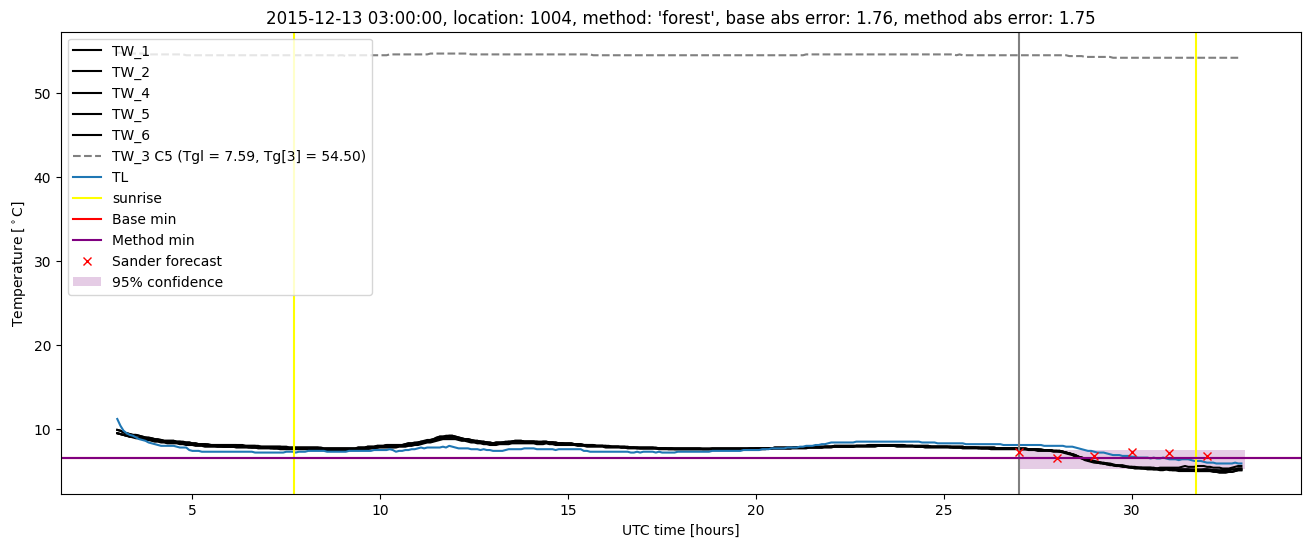
Random forest results
| names |
period |
power |
significance |
meanSquareError |
absError |
maxError |
CRPS |
IGN |
| baseline |
winter 2016 |
0.990 |
0.071 |
0.317 |
0.392 |
2.501 |
NaN |
NaN |
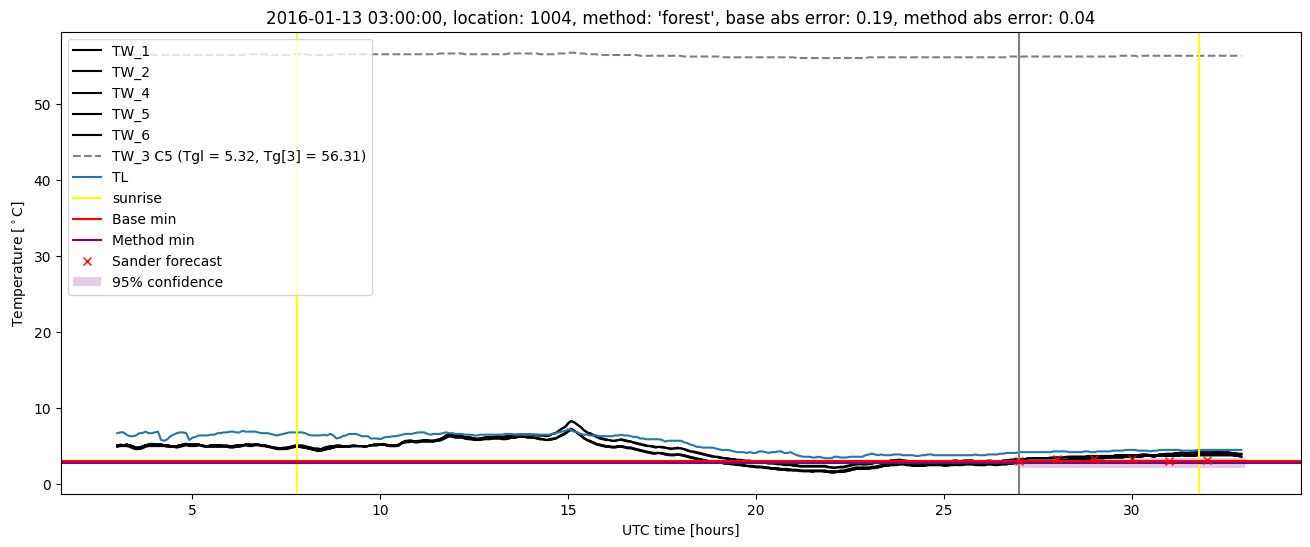
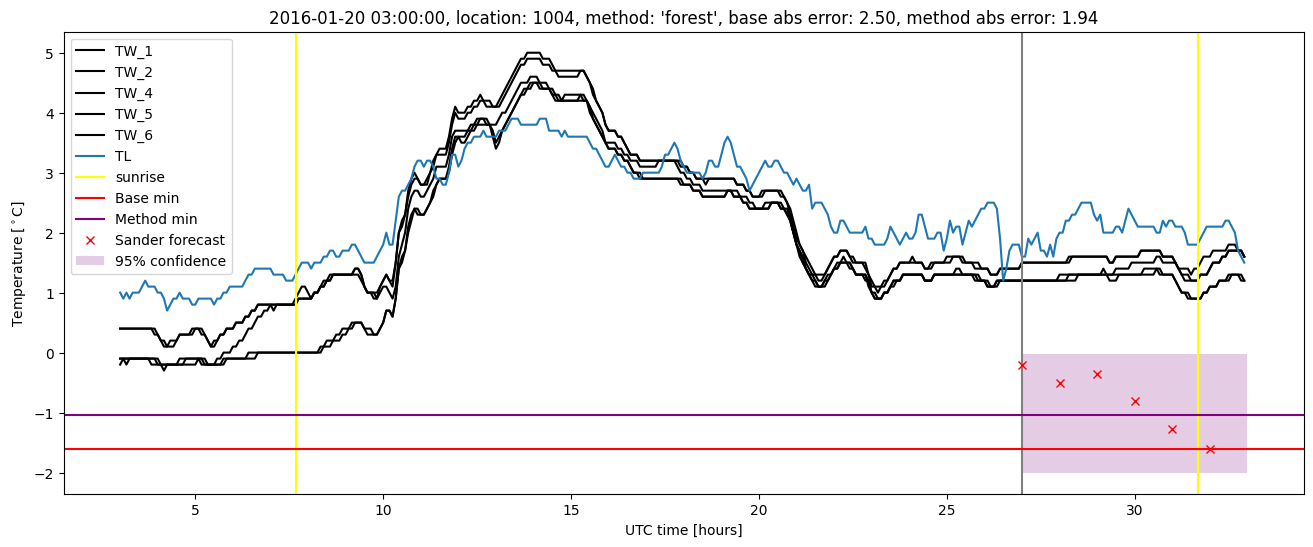
| forest |
winter 2016 |
0.990 |
0.071 |
0.290 |
0.387 |
1.944 |
0.504 |
2.950 |
| baseline |
winter 2017 |
0.977 |
0.040 |
0.475 |
0.488 |
2.521 |
NaN |
NaN |
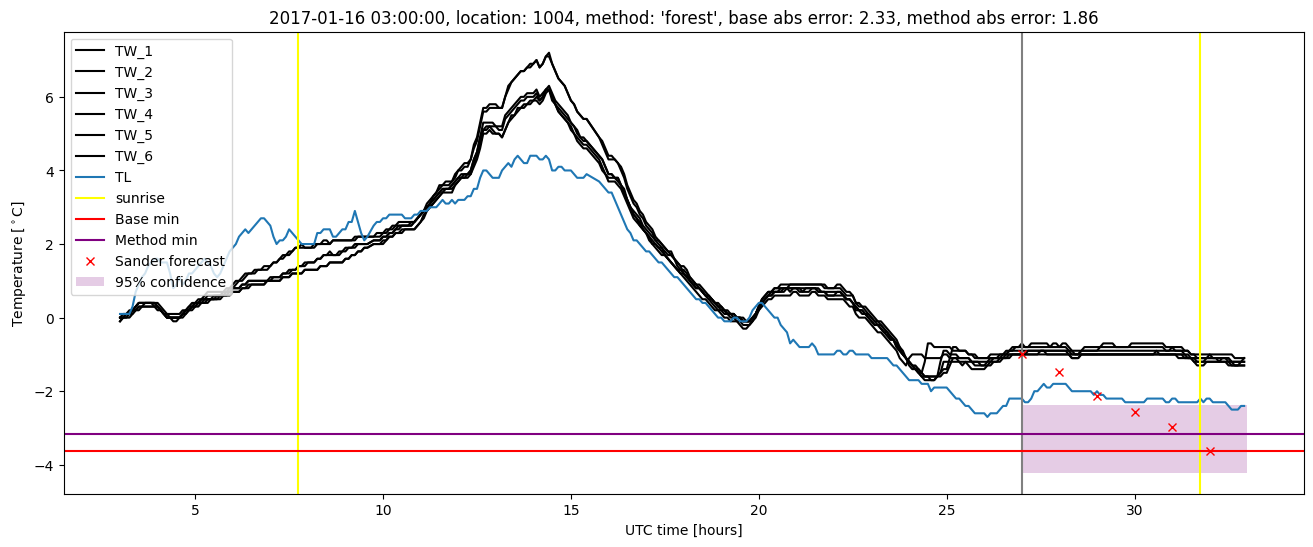
| forest |
winter 2017 |
0.977 |
0.080 |
0.394 |
0.448 |
2.262 |
0.505 |
4.720 |
| baseline |
winter 2018 |
0.980 |
0.053 |
0.352 |
0.459 |
1.718 |
NaN |
NaN |
| forest |
winter 2018 |
0.974 |
0.053 |
0.274 |
0.398 |
1.303 |
0.514 |
3.015 |
| baseline |
winter 2019 |
1.000 |
0.071 |
0.264 |
0.377 |
1.739 |
NaN |
NaN |
| forest |
winter 2019 |
1.000 |
0.071 |
0.226 |
0.341 |
1.620 |
0.512 |
2.996 |
| baseline |
all |
0.987 |
0.056 |
0.349 |
0.427 |
2.521 |
NaN |
NaN |
| forest |
all |
0.985 |
0.069 |
0.294 |
0.393 |
2.262 |
0.508 |
3.371 |
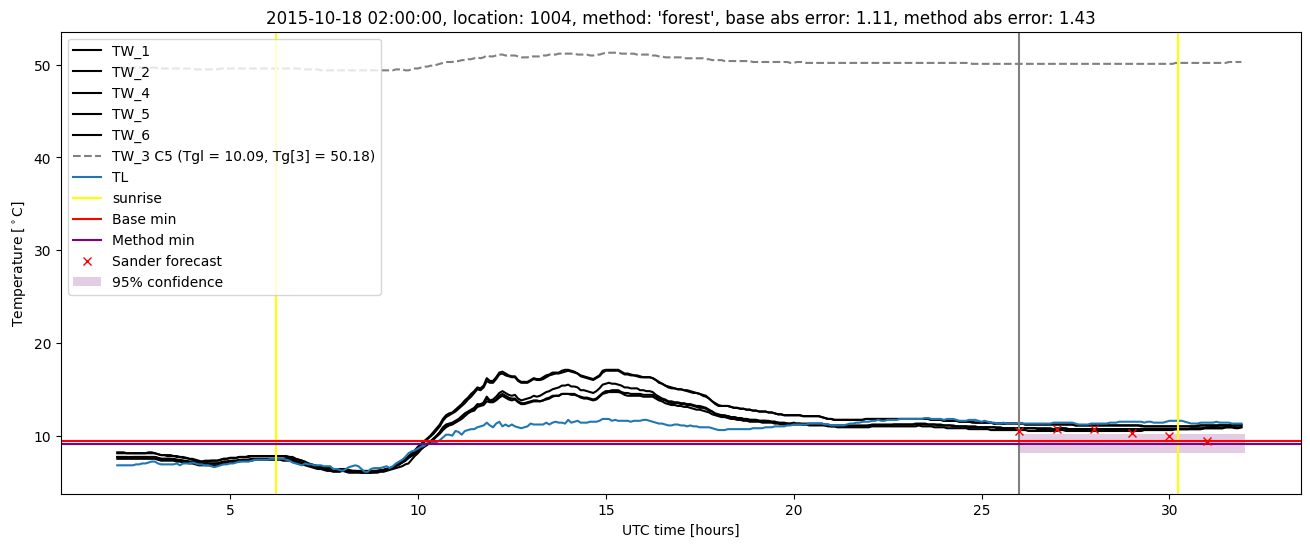
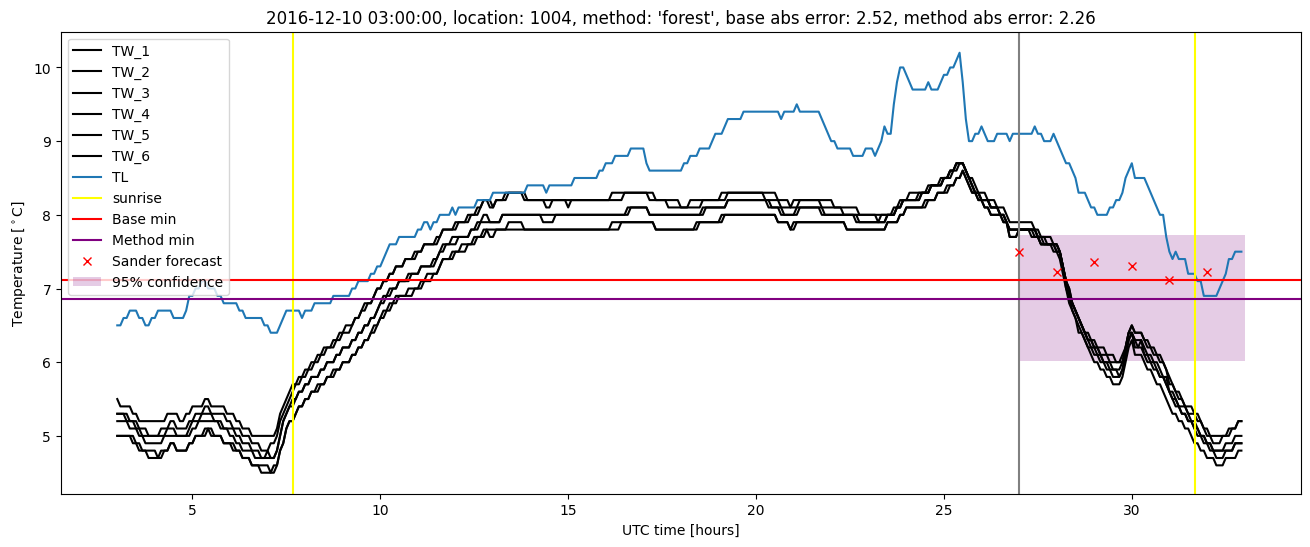
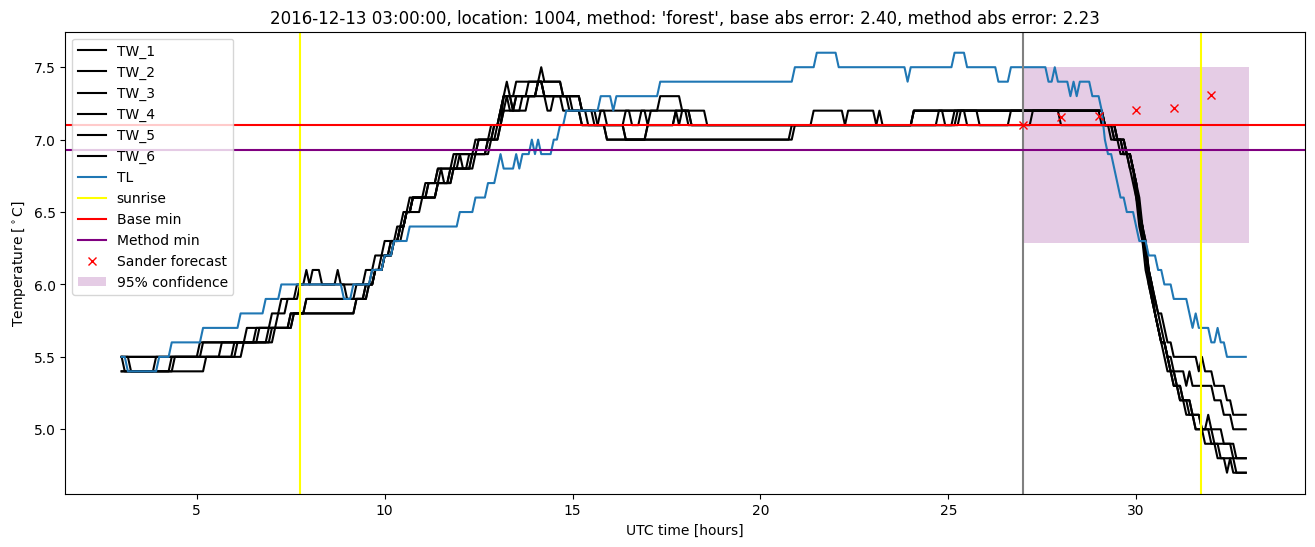
Random forest plots

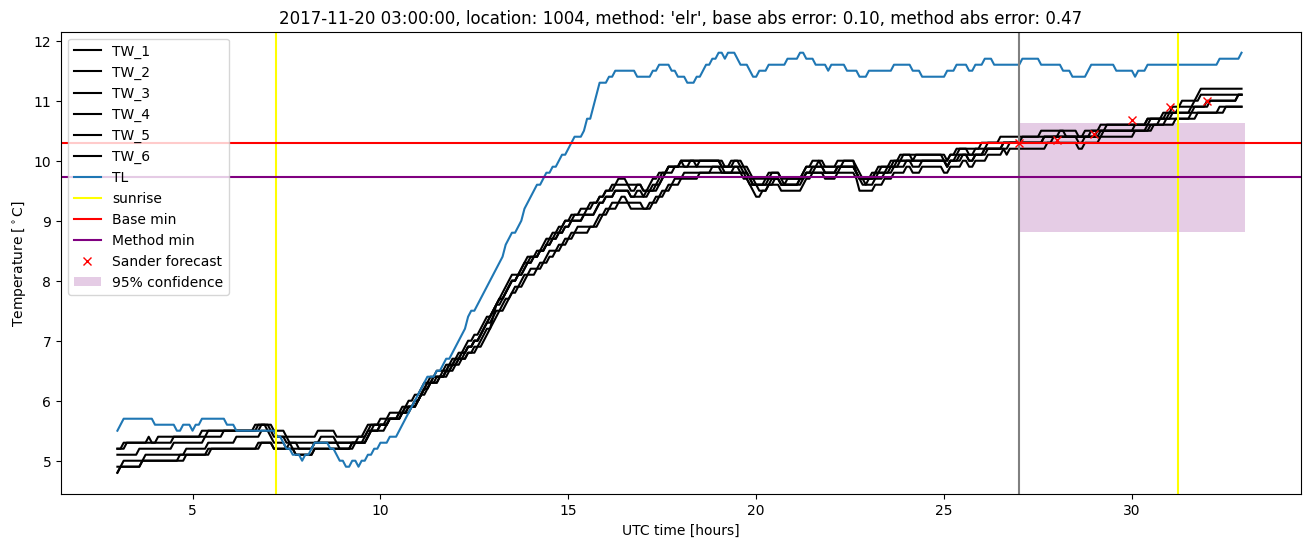
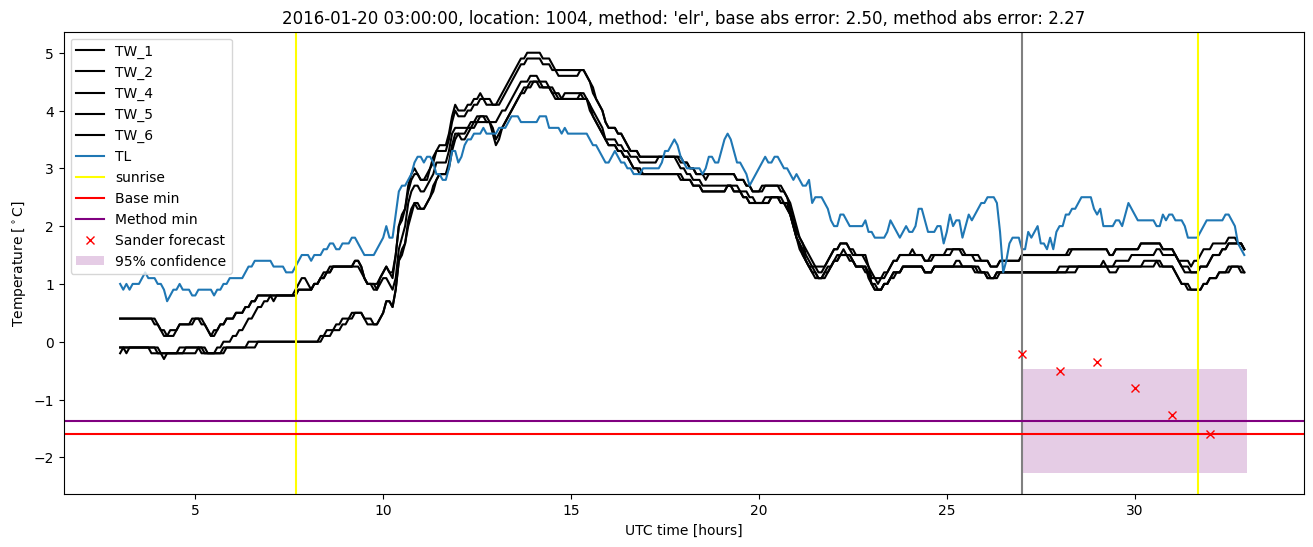
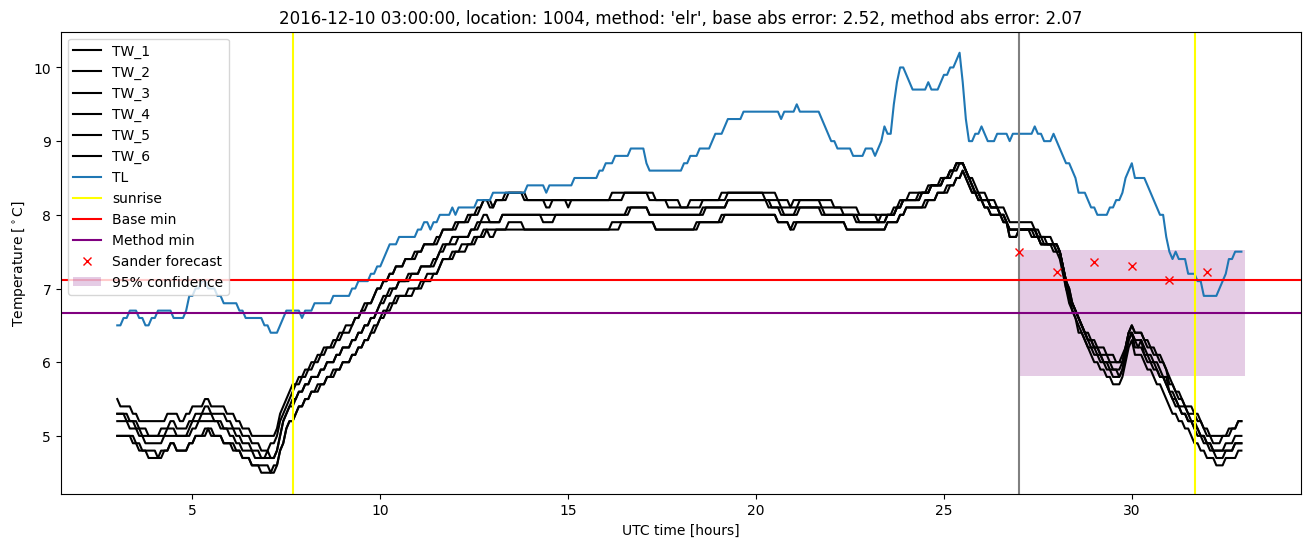
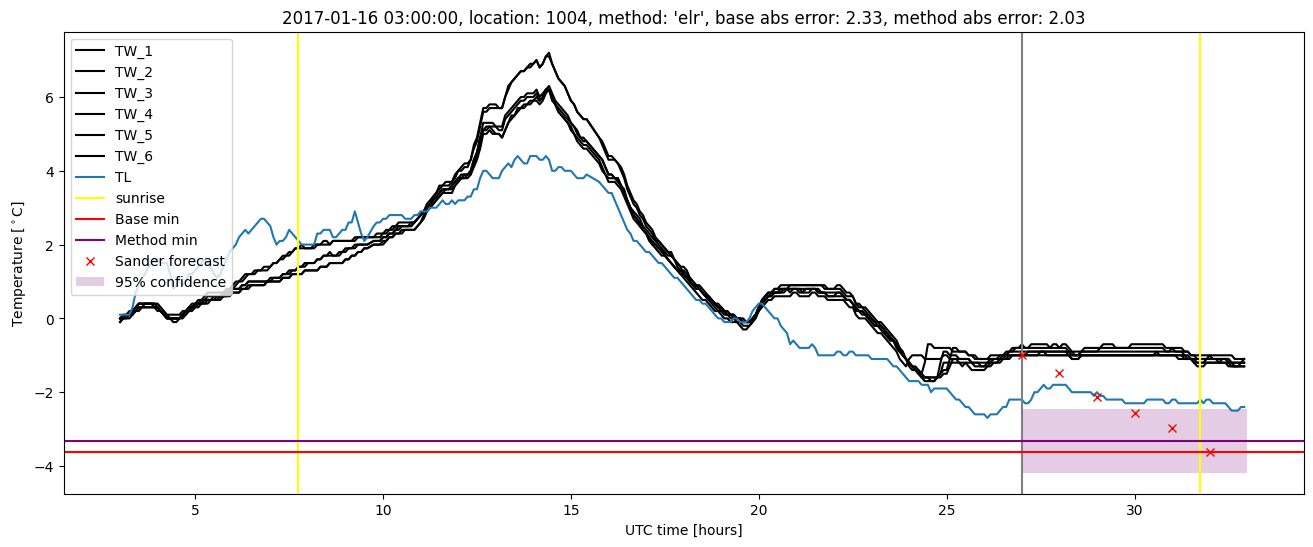
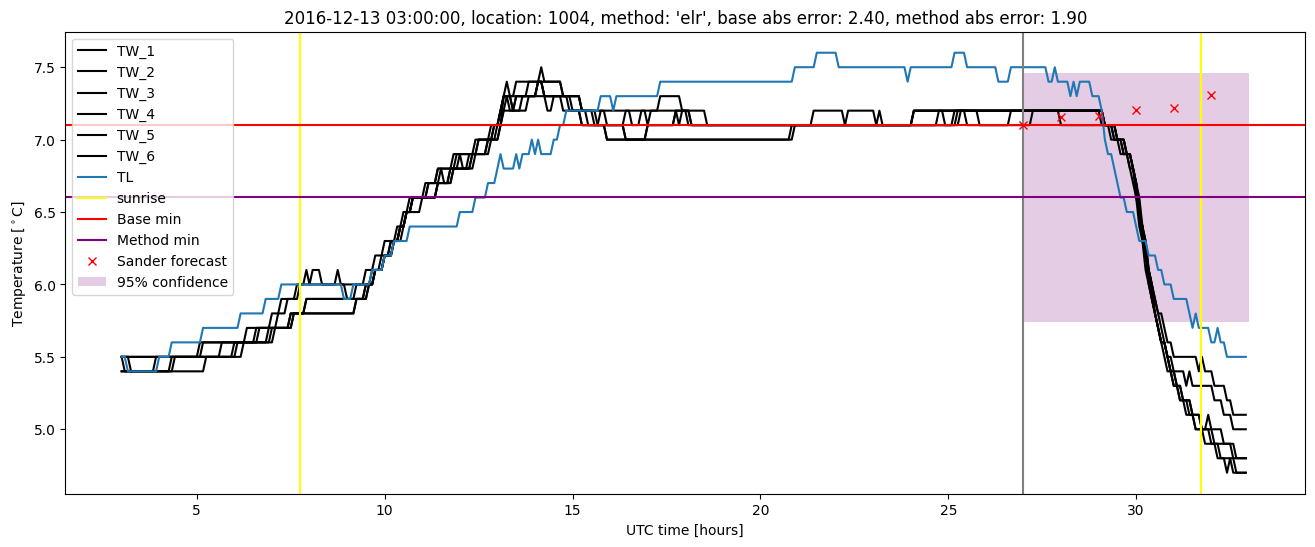
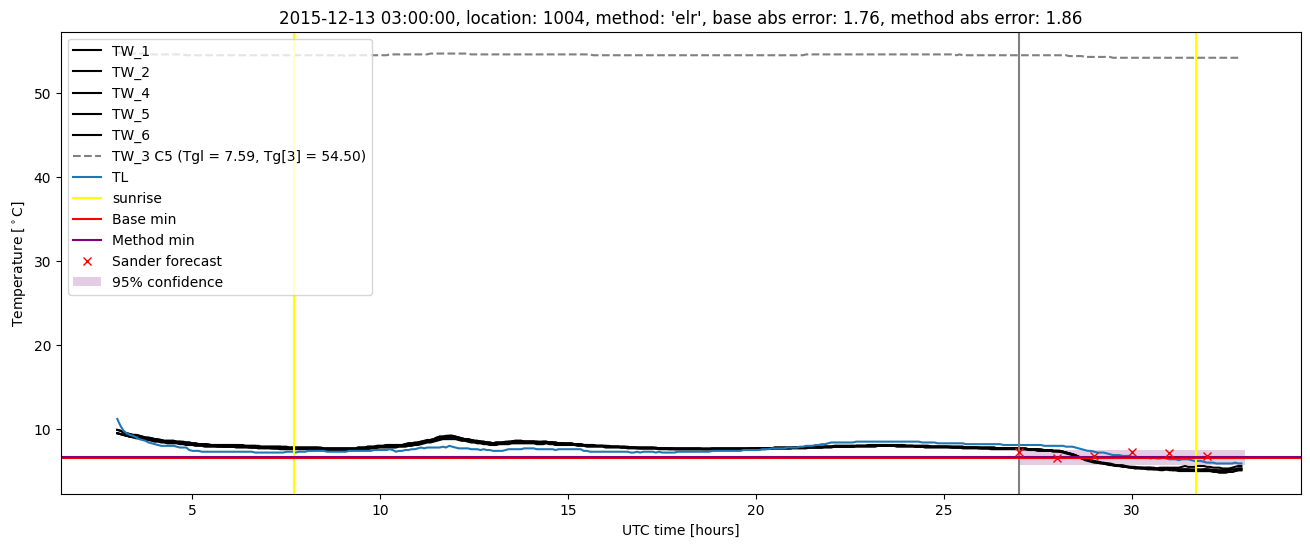
Extended logistic regression results
| names |
period |
power |
significance |
meanSquareError |
absError |
maxError |
CRPS |
IGN |
| baseline |
winter 2016 |
0.990 |
0.071 |
0.317 |
0.392 |
2.501 |
NaN |
NaN |
| elr |
winter 2016 |
0.990 |
0.071 |
0.296 |
0.410 |
2.269 |
0.585 |
4.599 |
| baseline |
winter 2017 |
0.977 |
0.040 |
0.475 |
0.488 |
2.521 |
NaN |
NaN |
| elr |
winter 2017 |
0.969 |
0.040 |
0.408 |
0.476 |
2.070 |
0.588 |
5.447 |
| baseline |
winter 2018 |
0.980 |
0.053 |
0.352 |
0.459 |
1.718 |
NaN |
NaN |
| elr |
winter 2018 |
0.974 |
0.053 |
0.293 |
0.431 |
1.556 |
0.565 |
4.120 |
| baseline |
winter 2019 |
1.000 |
0.071 |
0.264 |
0.377 |
1.739 |
NaN |
NaN |
| elr |
winter 2019 |
1.000 |
0.071 |
0.235 |
0.378 |
1.489 |
0.561 |
3.715 |
| baseline |
all |
0.987 |
0.056 |
0.349 |
0.427 |
2.521 |
NaN |
NaN |
| elr |
all |
0.984 |
0.056 |
0.306 |
0.423 |
2.269 |
0.575 |
4.468 |
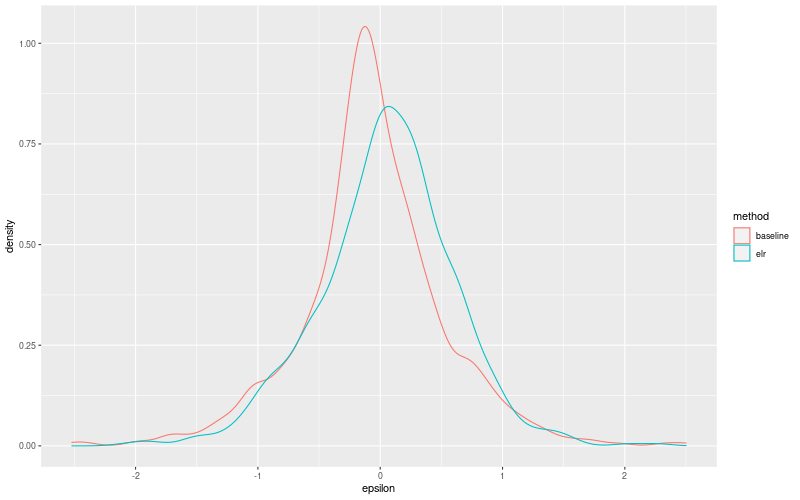
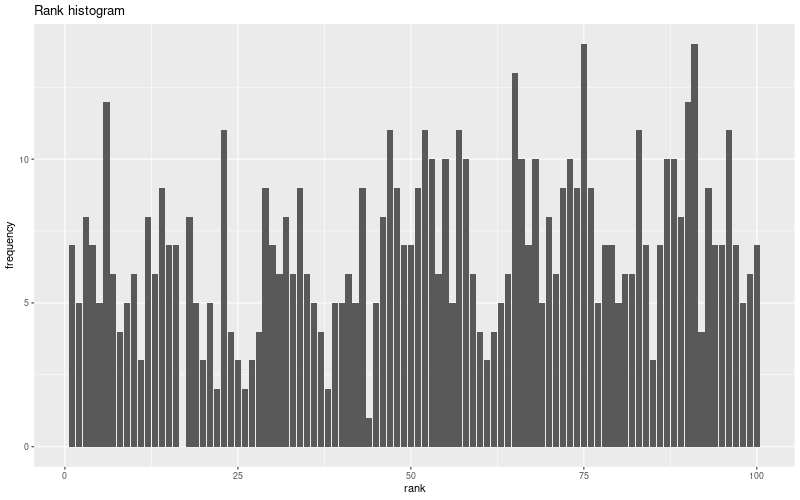
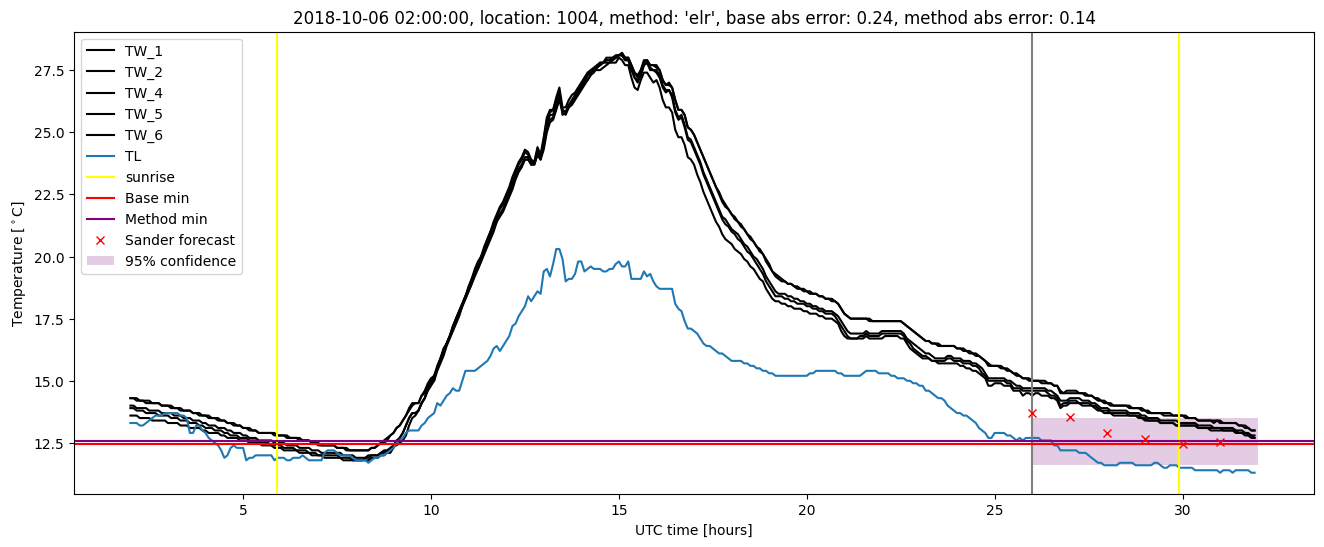
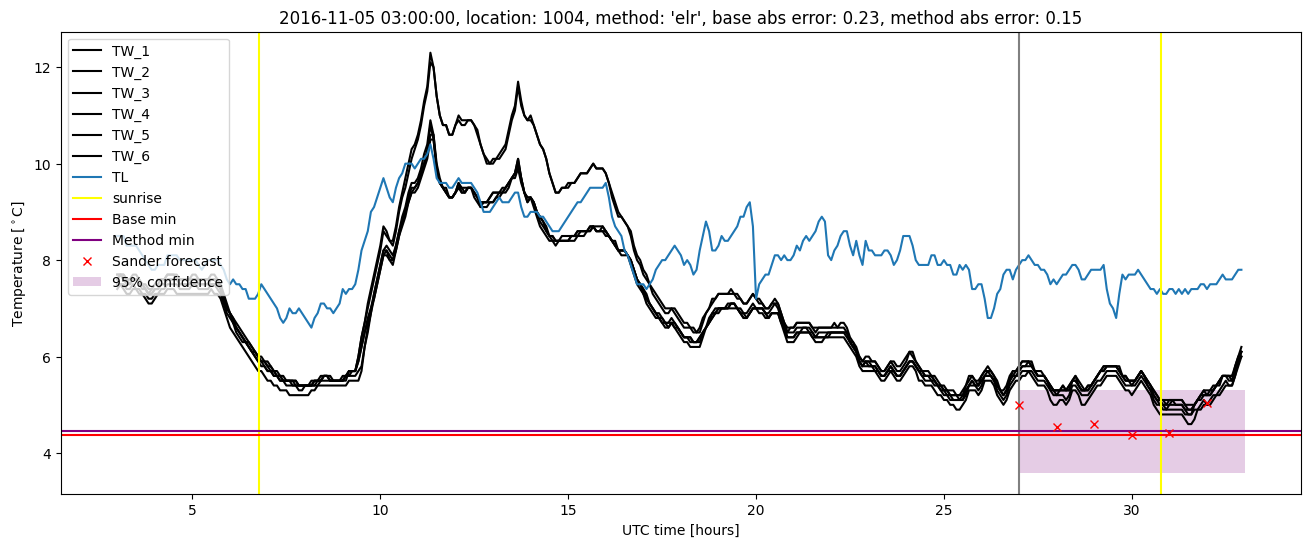
Extended logistic regression plots