GMS location: 1003
Random forest results
| names |
period |
power |
significance |
meanSquareError |
absError |
maxError |
CRPS |
IGN |
| baseline |
winter 2016 |
0.990 |
0.176 |
0.341 |
0.428 |
1.969 |
NaN |
NaN |
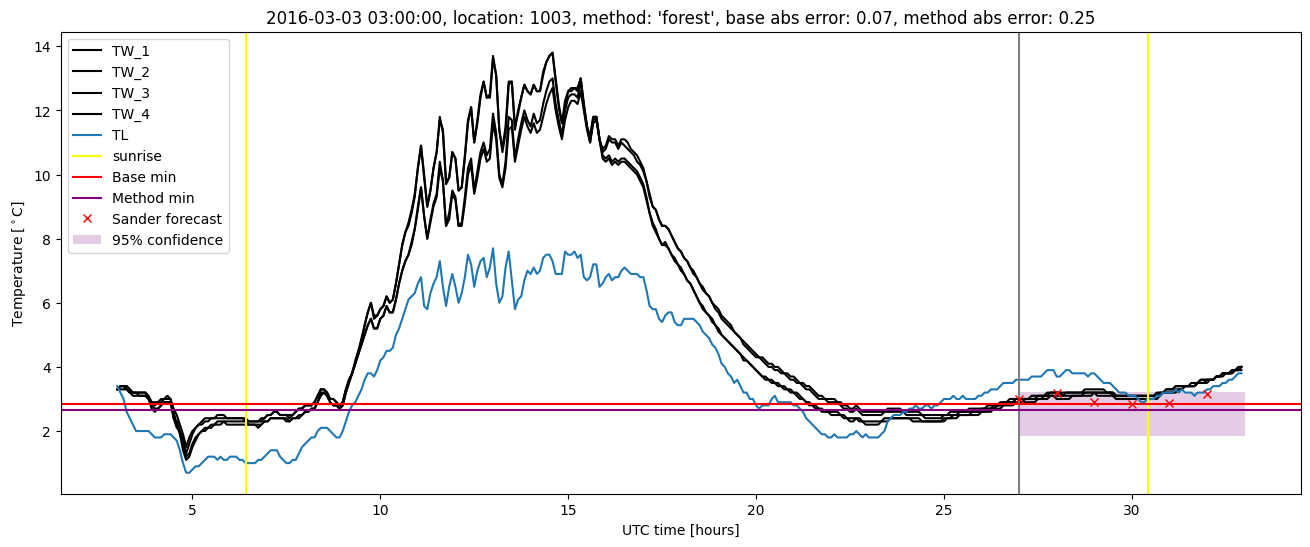
| forest |
winter 2016 |
0.984 |
0.176 |
0.292 |
0.402 |
1.720 |
0.474 |
2.726 |
| baseline |
winter 2017 |
0.976 |
0.000e+00 |
0.459 |
0.457 |
2.501 |
NaN |
NaN |
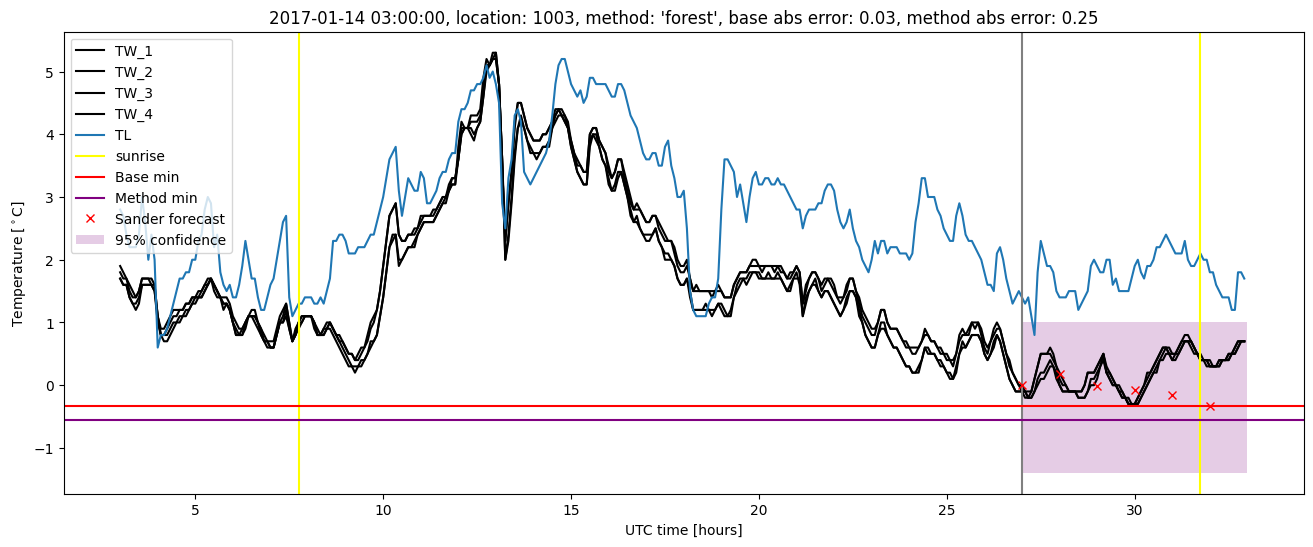
| forest |
winter 2017 |
0.976 |
0.038 |
0.344 |
0.412 |
2.314 |
0.496 |
4.290 |
| baseline |
winter 2018 |
0.980 |
0.143 |
0.329 |
0.446 |
1.766 |
NaN |
NaN |
| forest |
winter 2018 |
0.987 |
0.095 |
0.231 |
0.375 |
1.293 |
0.471 |
2.376 |
| baseline |
winter 2019 |
0.992 |
0.143 |
0.354 |
0.441 |
1.669 |
NaN |
NaN |
| forest |
winter 2019 |
0.992 |
0.143 |
0.271 |
0.397 |
1.715 |
0.470 |
2.747 |
| baseline |
all |
0.985 |
0.103 |
0.368 |
0.442 |
2.501 |
NaN |
NaN |
| forest |
all |
0.985 |
0.103 |
0.284 |
0.396 |
2.314 |
0.477 |
2.997 |
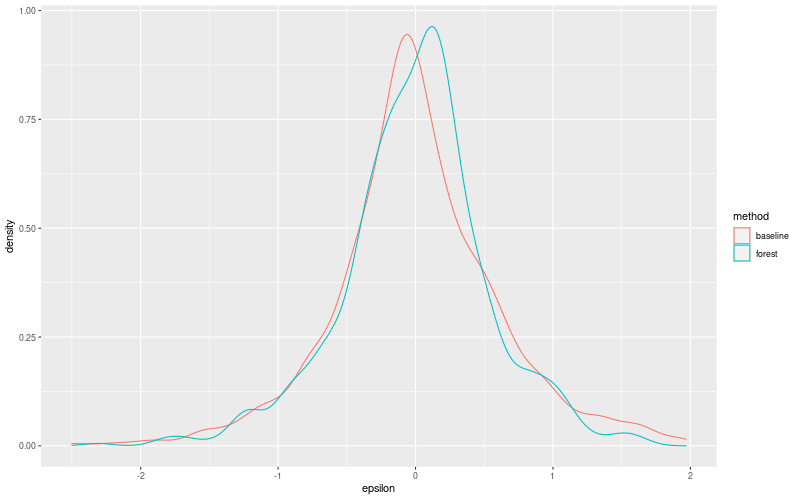
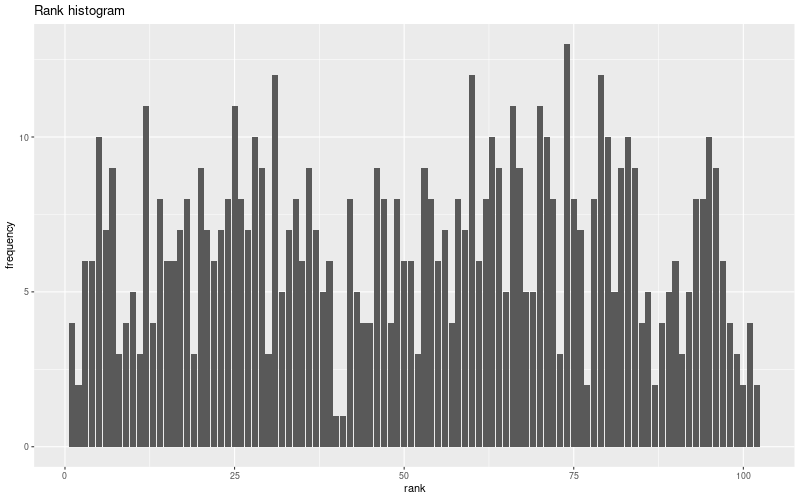
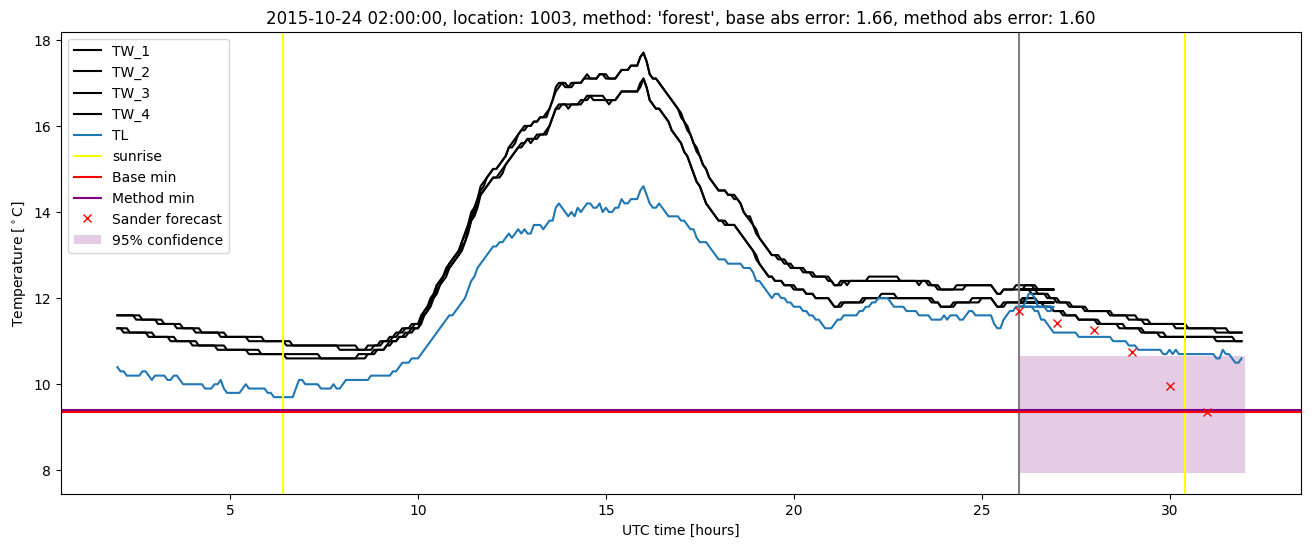
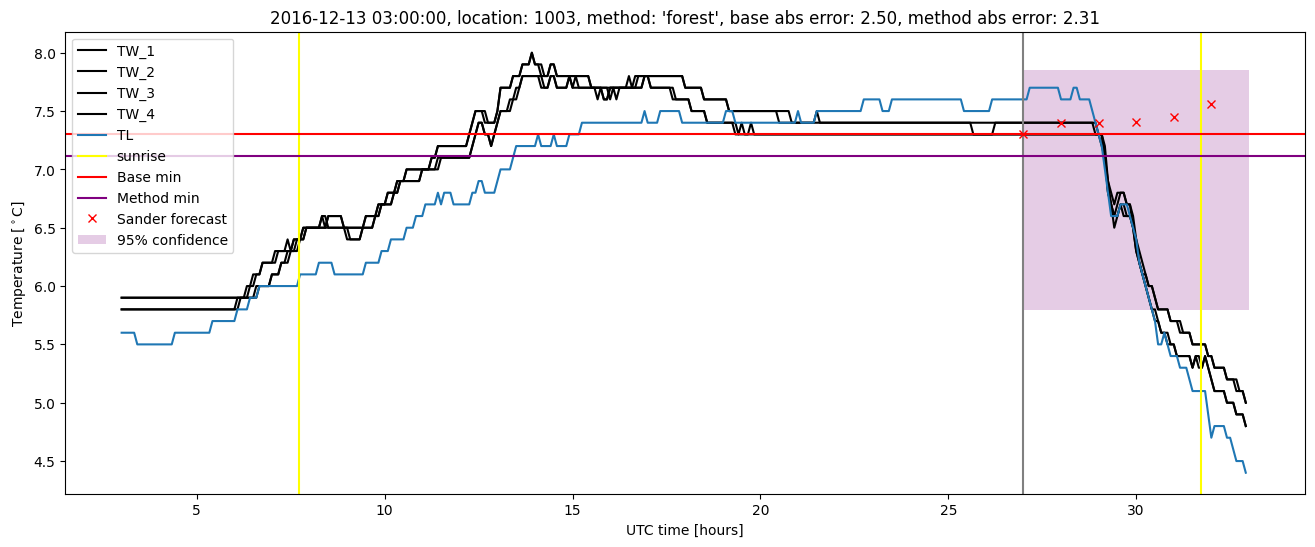
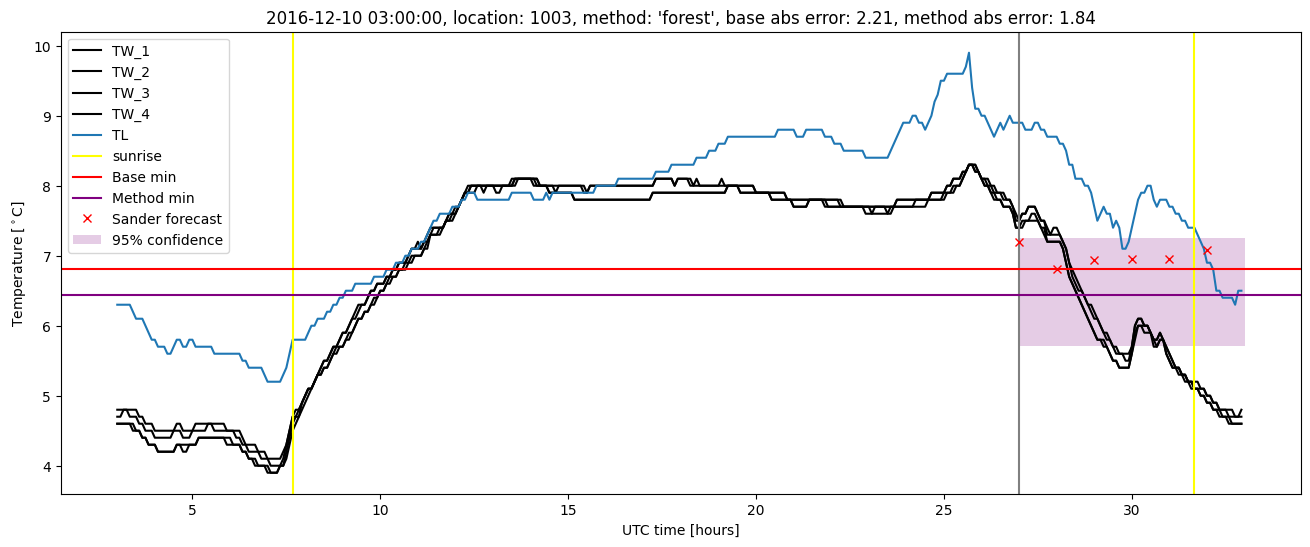
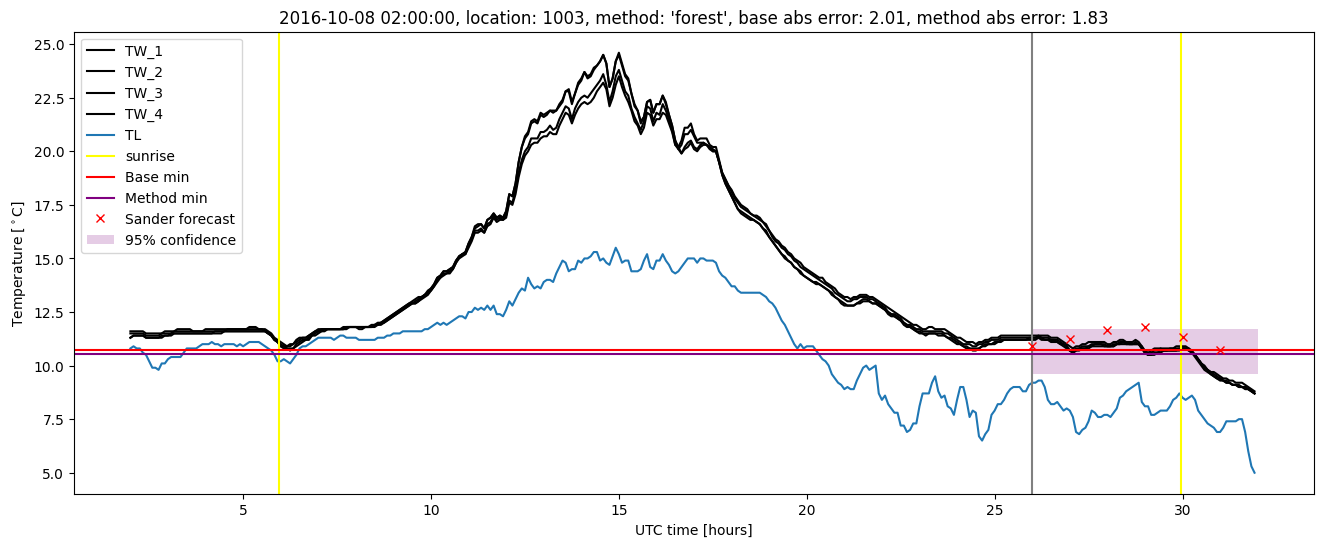
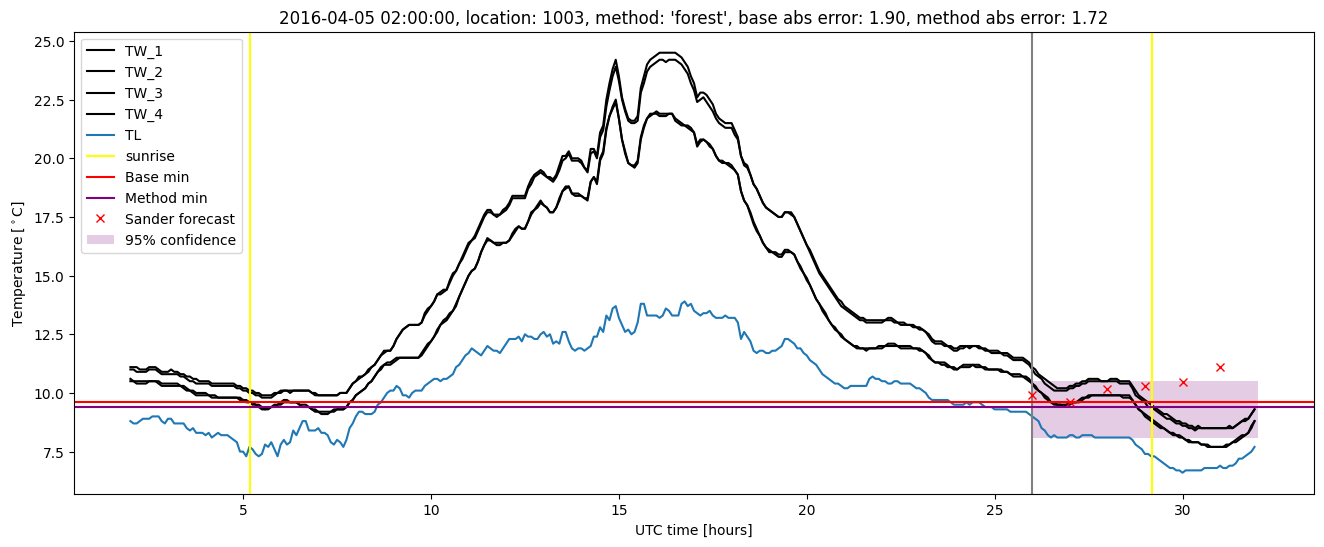
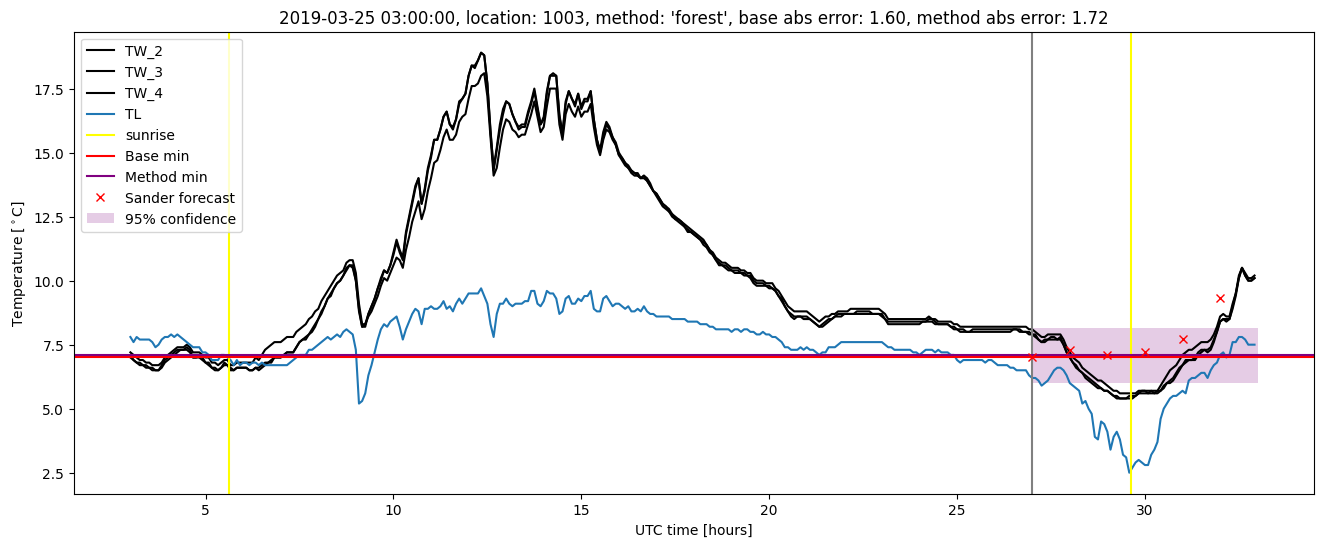
Random forest plots
Extended logistic regression results
| names |
period |
power |
significance |
meanSquareError |
absError |
maxError |
CRPS |
IGN |
| baseline |
winter 2016 |
0.990 |
0.176 |
0.341 |
0.428 |
1.969 |
NaN |
NaN |
| elr |
winter 2016 |
0.984 |
0.118 |
0.313 |
0.428 |
1.645 |
0.548 |
4.260 |
| baseline |
winter 2017 |
0.976 |
0.000e+00 |
0.459 |
0.457 |
2.501 |
NaN |
NaN |
| elr |
winter 2017 |
0.984 |
0.000e+00 |
0.374 |
0.463 |
2.035 |
0.564 |
5.419 |
| baseline |
winter 2018 |
0.980 |
0.143 |
0.329 |
0.446 |
1.766 |
NaN |
NaN |
| elr |
winter 2018 |
0.993 |
0.095 |
0.266 |
0.401 |
1.518 |
0.541 |
3.689 |
| baseline |
winter 2019 |
0.992 |
0.143 |
0.354 |
0.441 |
1.669 |
NaN |
NaN |
| elr |
winter 2019 |
0.984 |
0.143 |
0.317 |
0.452 |
1.772 |
0.527 |
3.929 |
| baseline |
all |
0.985 |
0.103 |
0.368 |
0.442 |
2.501 |
NaN |
NaN |
| elr |
all |
0.987 |
0.077 |
0.316 |
0.434 |
2.035 |
0.545 |
4.308 |
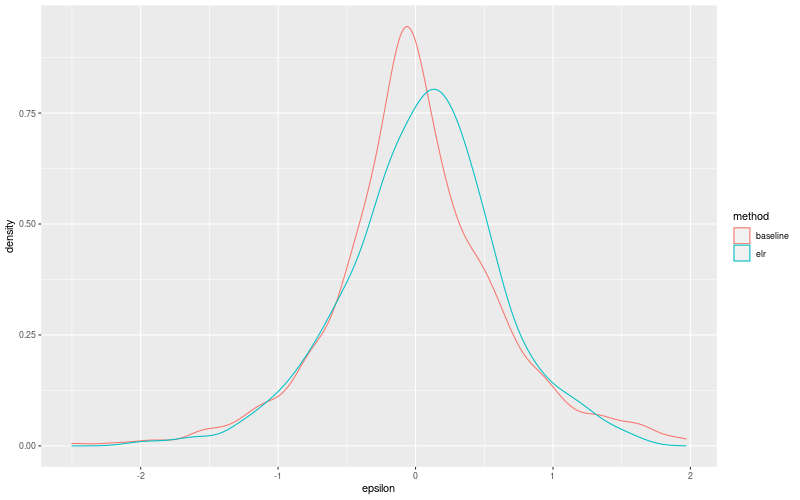
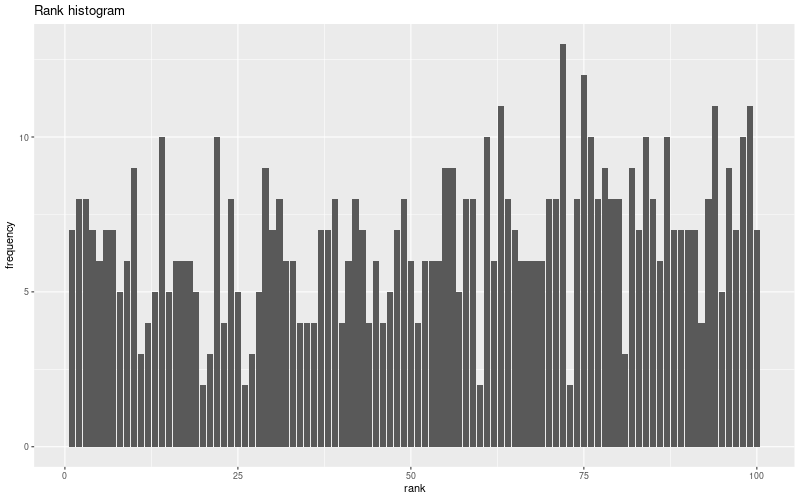
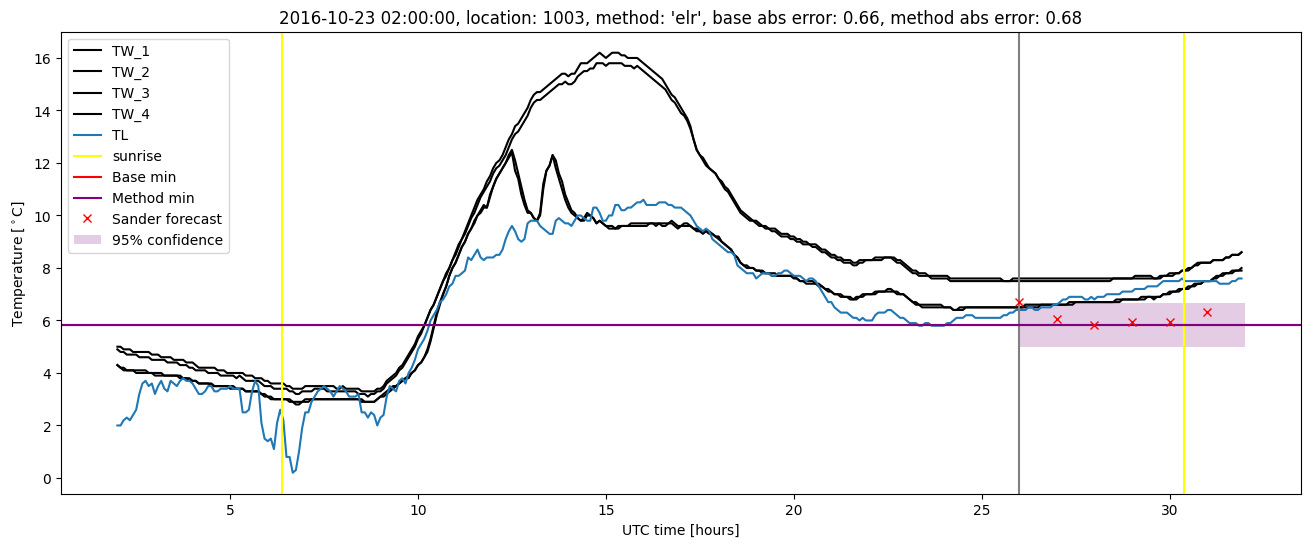
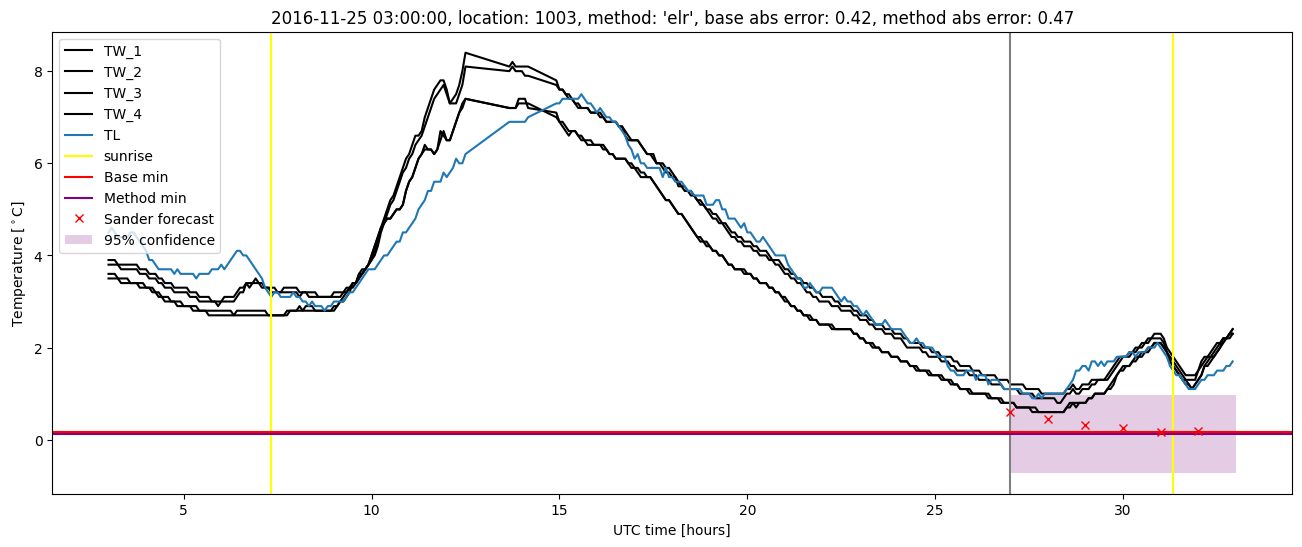
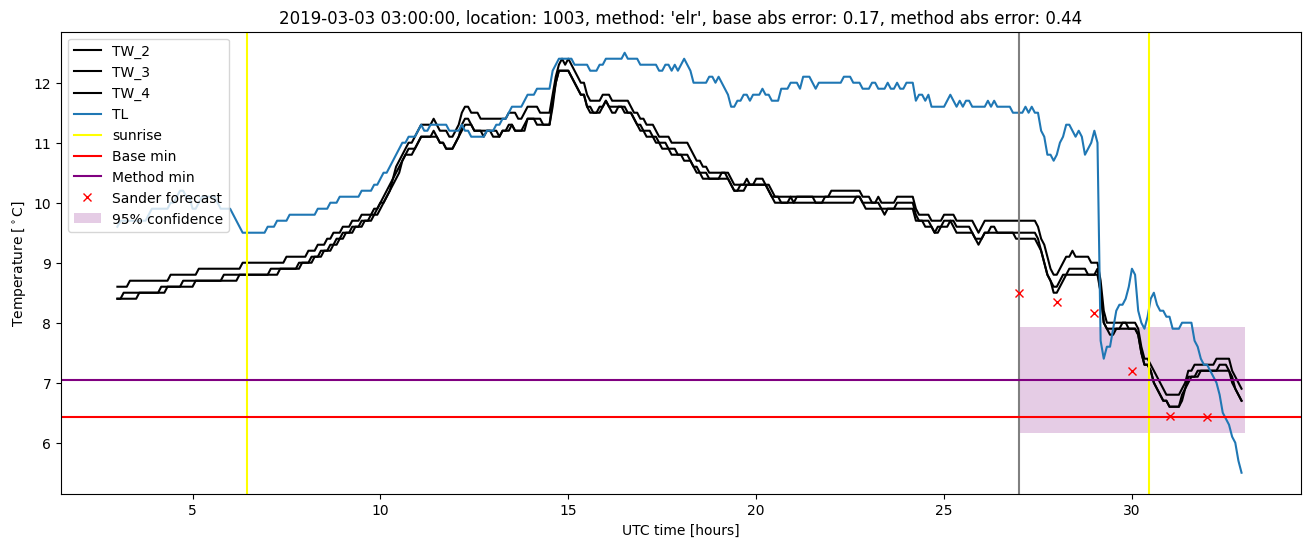
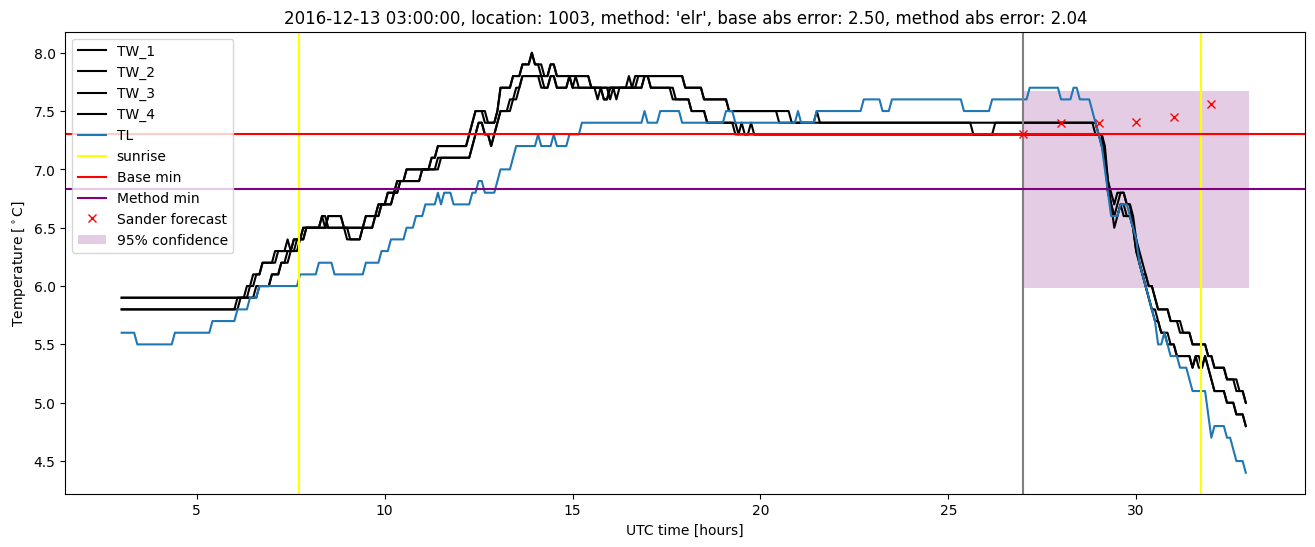
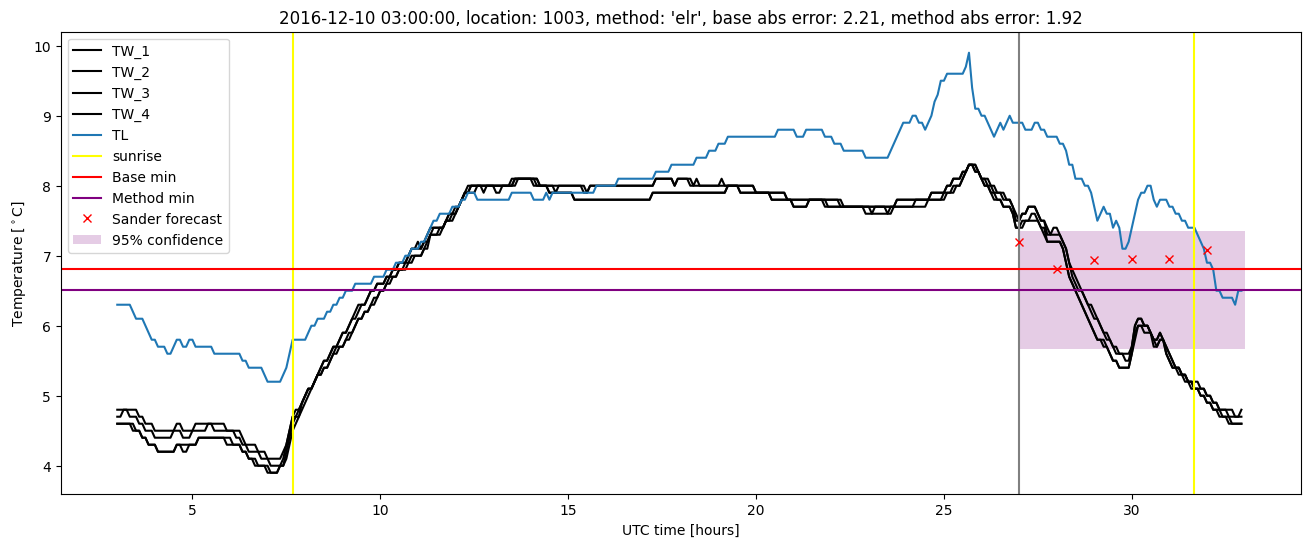
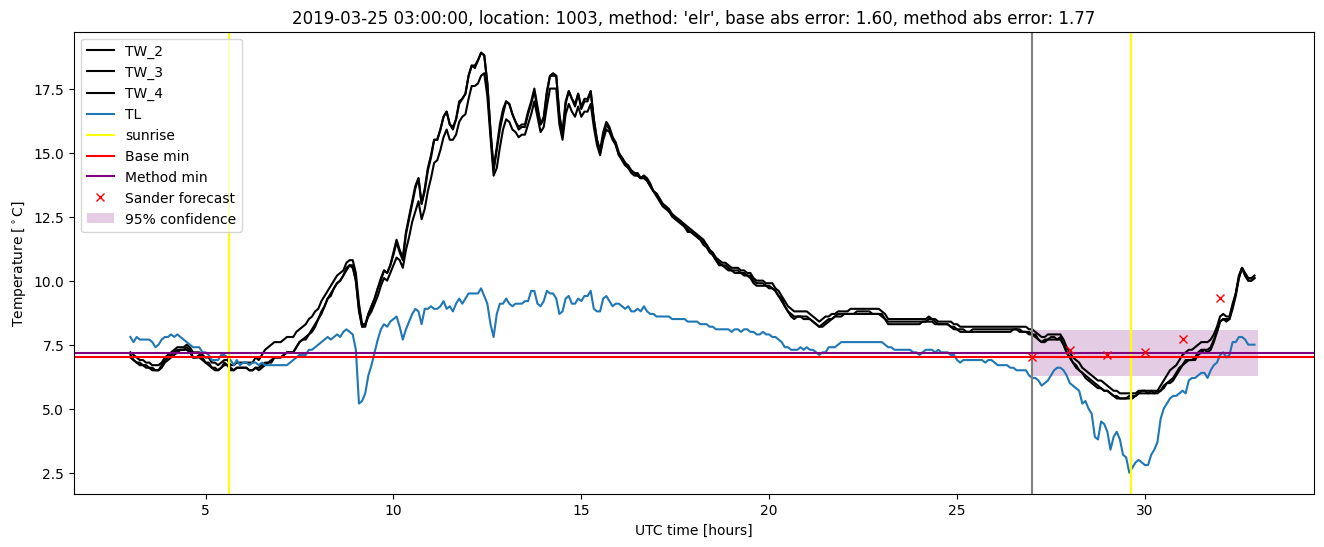
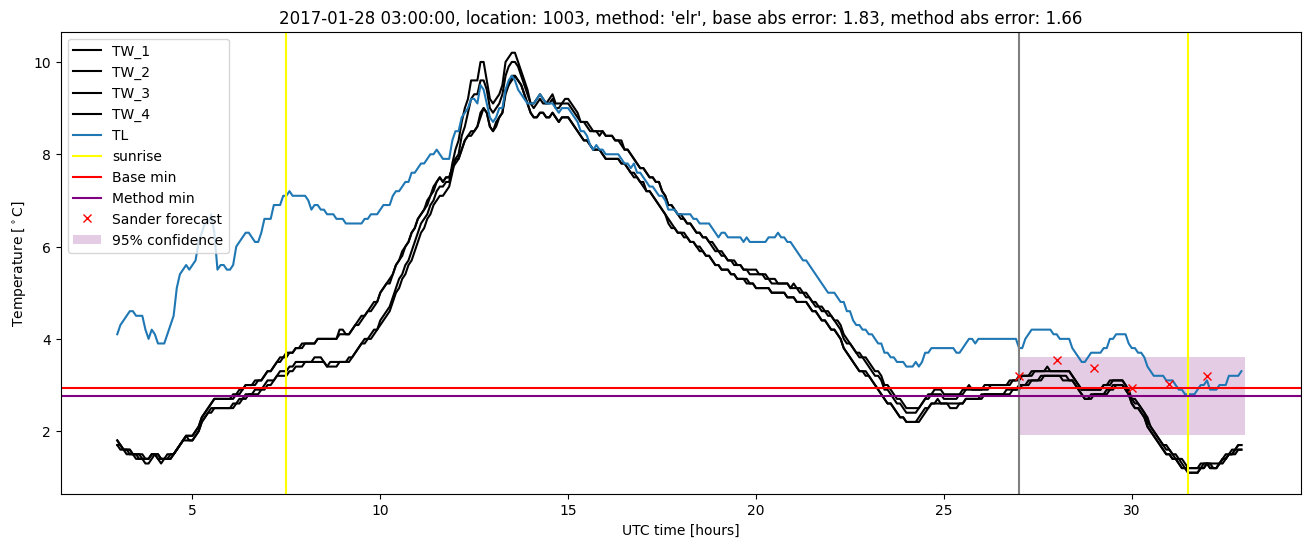
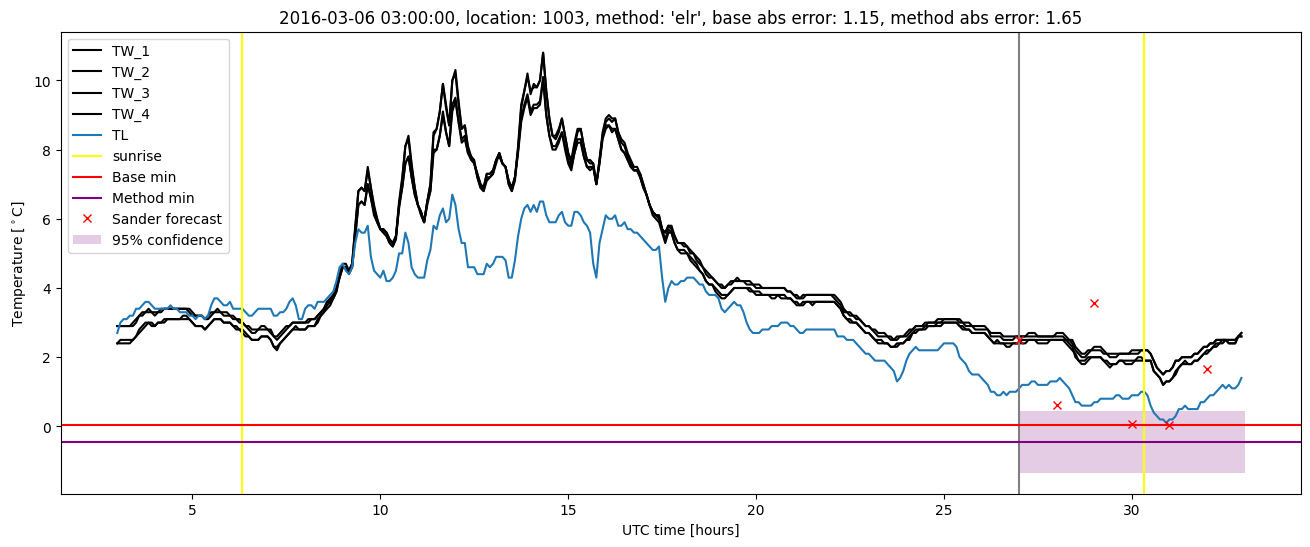
Extended logistic regression plots