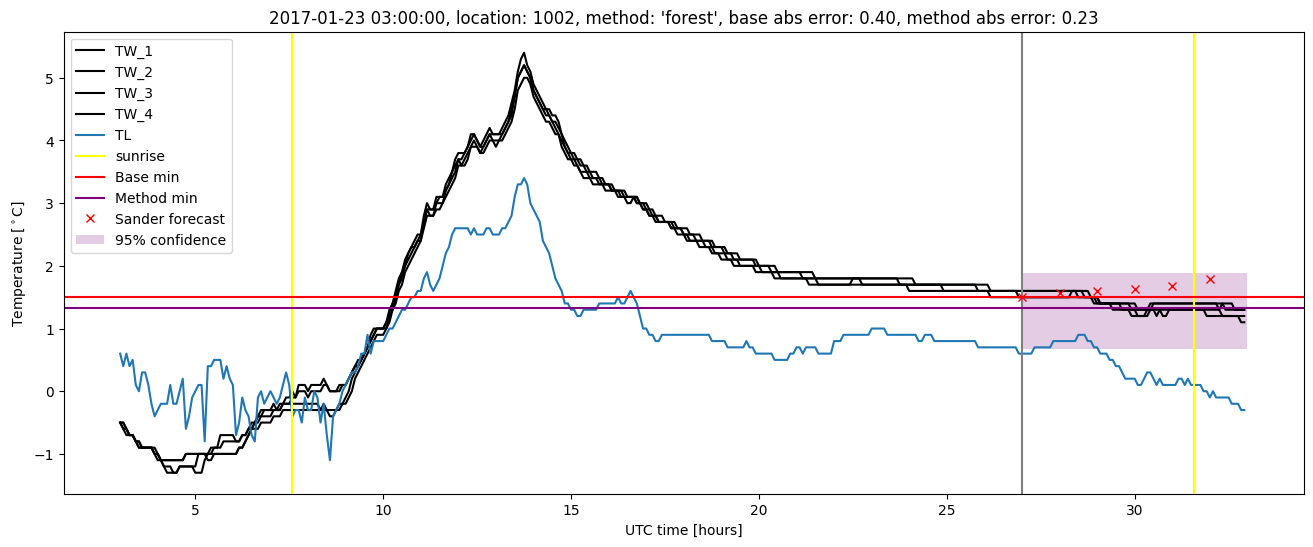
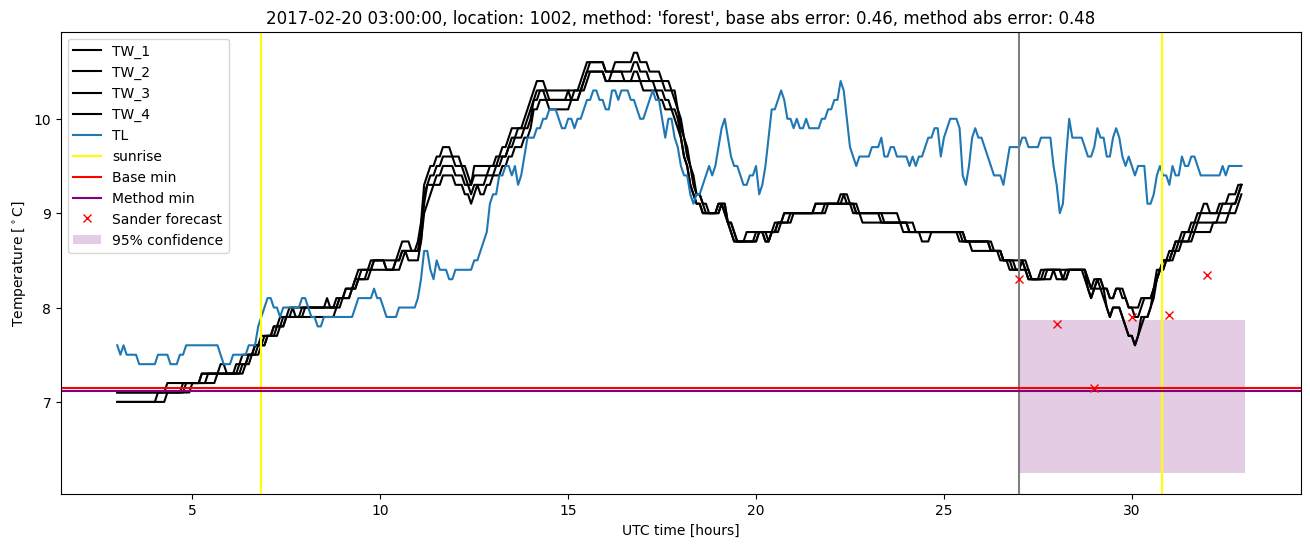
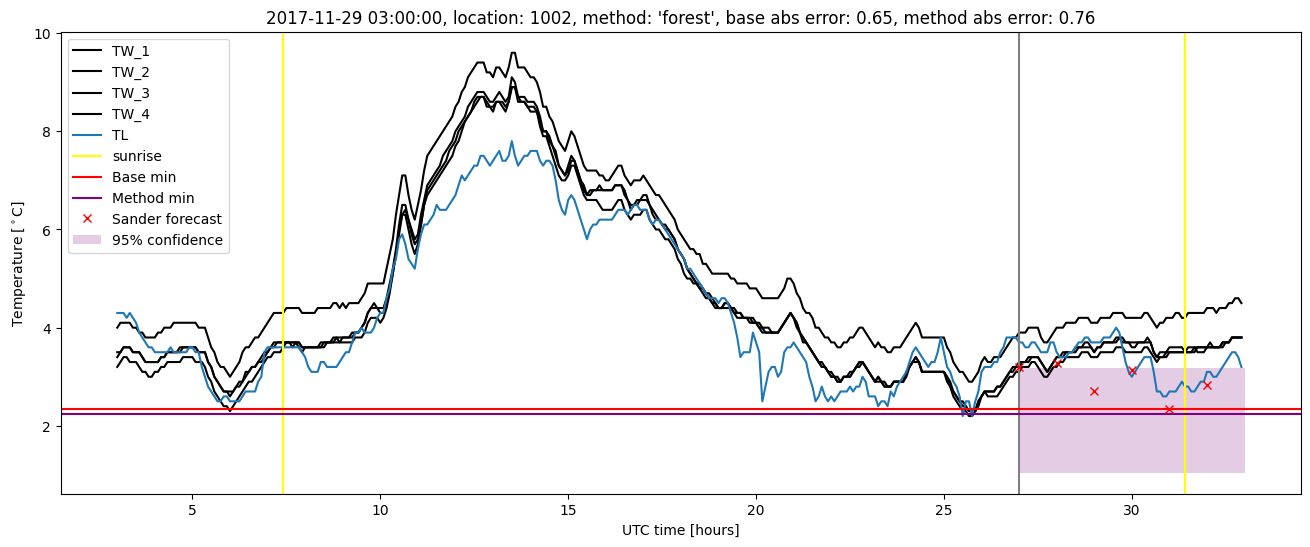
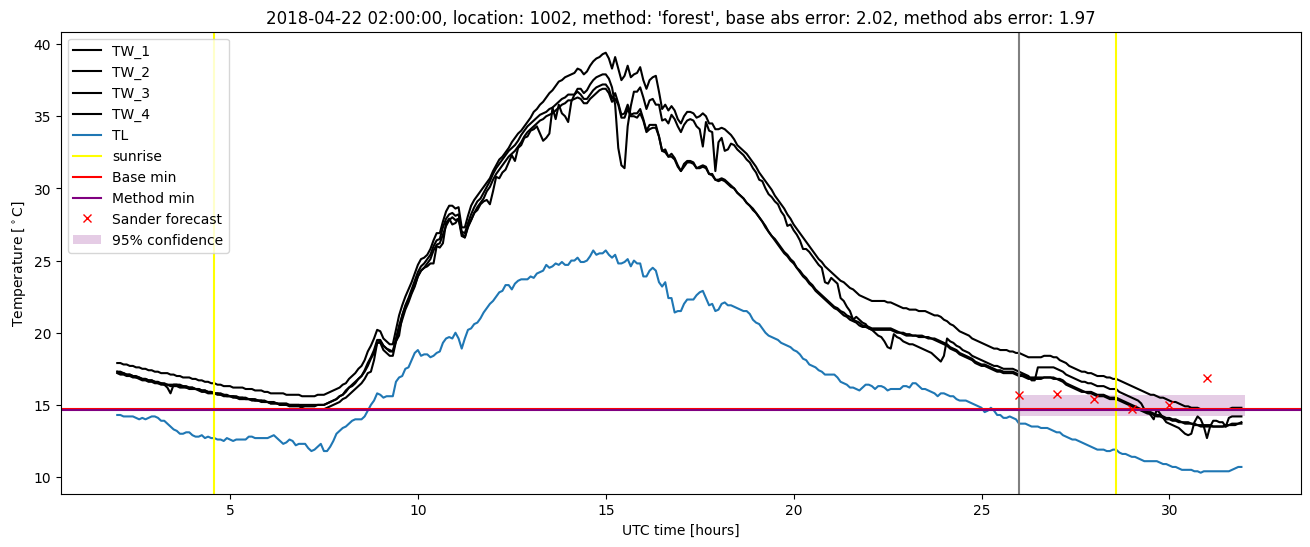
GMS location: 1002
Random forest results
| names |
period |
power |
significance |
meanSquareError |
absError |
maxError |
CRPS |
IGN |
| baseline |
winter 2016 |
1.000 |
0.154 |
0.333 |
0.404 |
2.541 |
NaN |
NaN |
| forest |
winter 2016 |
0.994 |
0.385 |
0.308 |
0.404 |
2.638 |
0.455 |
2.474 |
| baseline |
winter 2017 |
0.977 |
0.000e+00 |
0.340 |
0.408 |
2.181 |
NaN |
NaN |
| forest |
winter 2017 |
0.977 |
0.043 |
0.294 |
0.401 |
1.947 |
0.465 |
3.182 |
| baseline |
winter 2018 |
0.980 |
0.286 |
0.316 |
0.422 |
2.018 |
NaN |
NaN |
| forest |
winter 2018 |
0.993 |
0.286 |
0.275 |
0.388 |
1.970 |
0.449 |
2.478 |
| baseline |
winter 2019 |
1.000 |
NaN |
0.342 |
0.414 |
1.499 |
NaN |
NaN |
| forest |
winter 2019 |
1.000 |
NaN |
0.294 |
0.353 |
1.653 |
0.415 |
2.097 |
| baseline |
all |
0.987 |
0.120 |
0.330 |
0.411 |
2.541 |
NaN |
NaN |
| forest |
all |
0.990 |
0.200 |
0.293 |
0.396 |
2.638 |
0.454 |
2.667 |
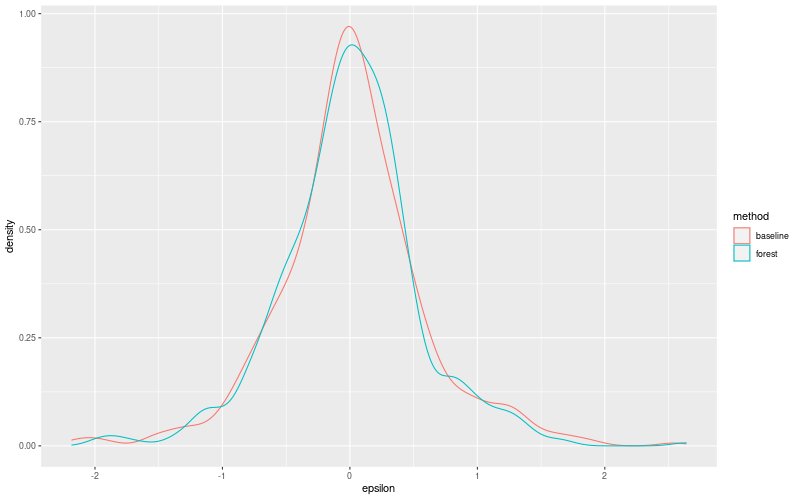
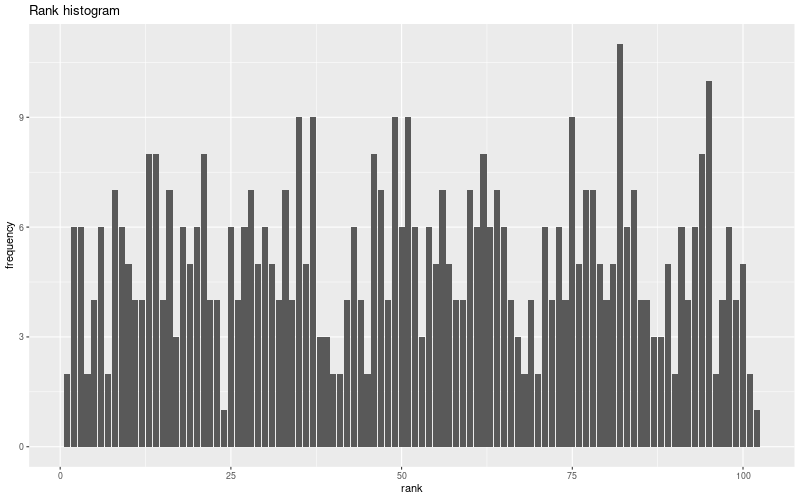
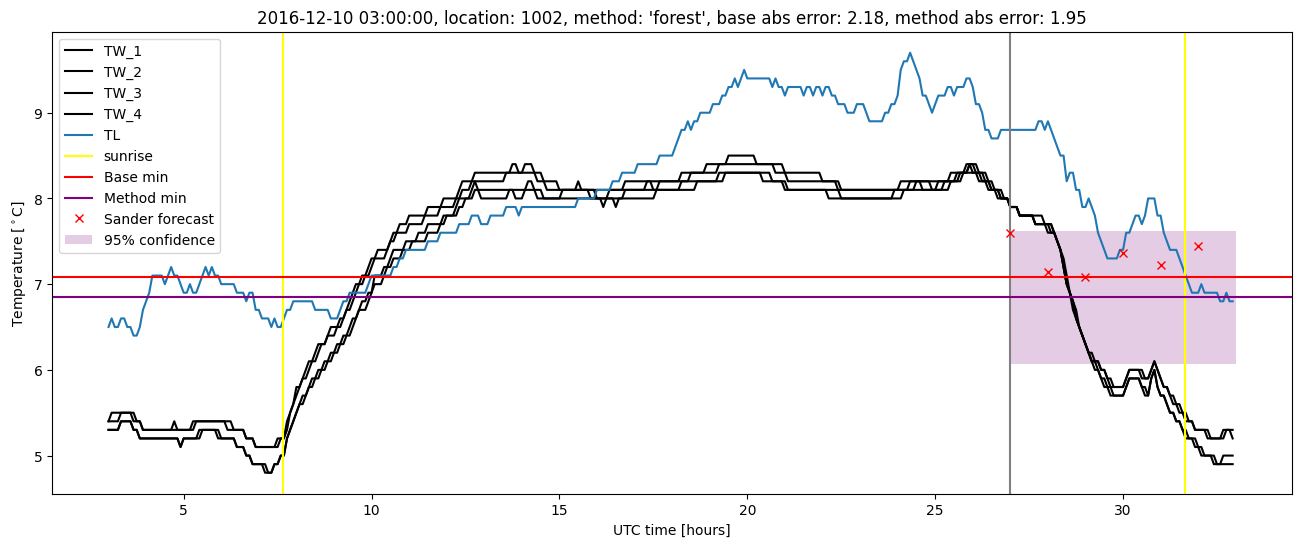
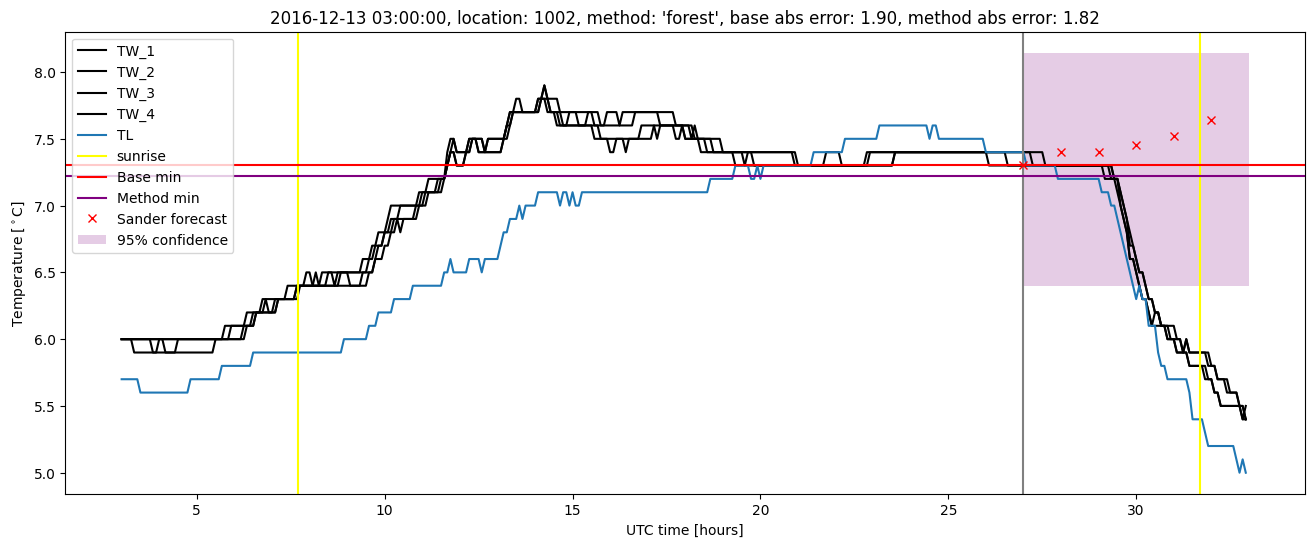
Random forest plots


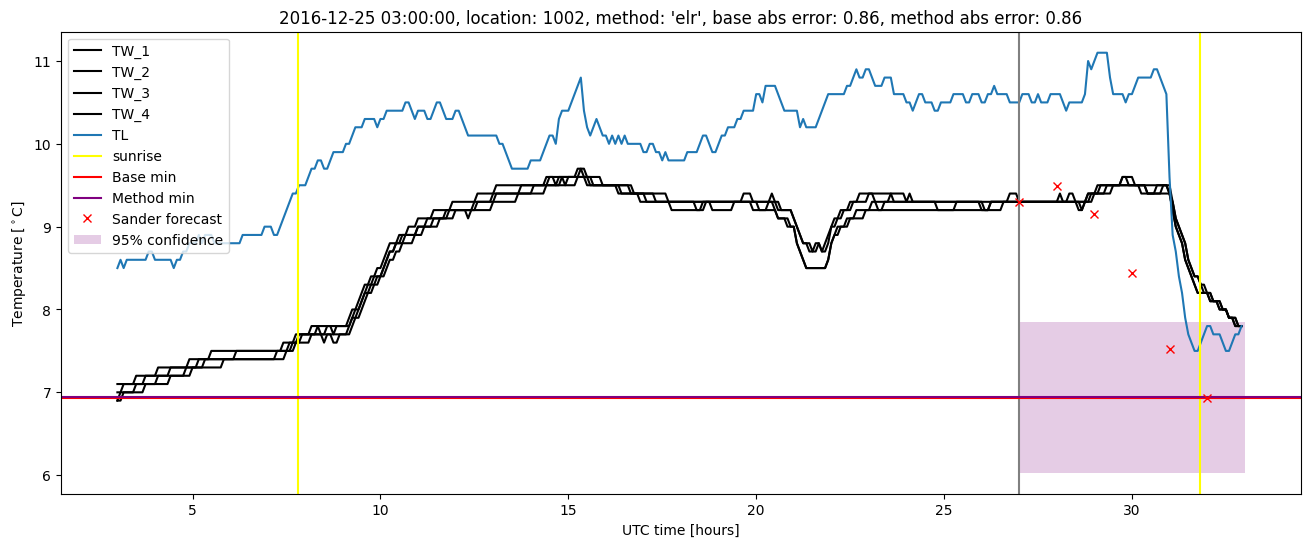
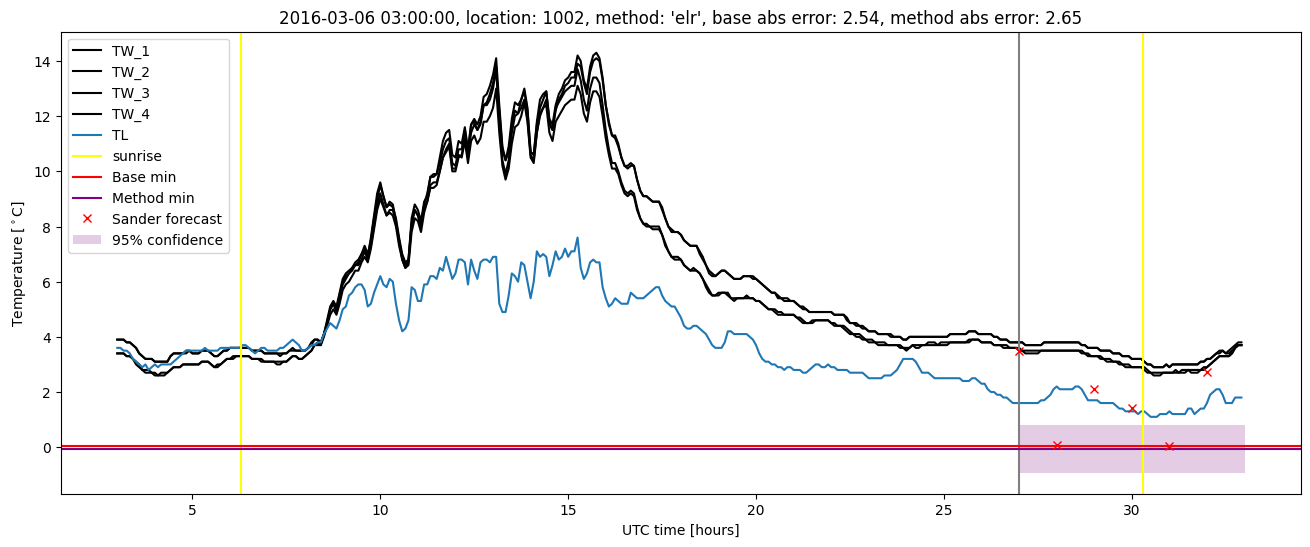
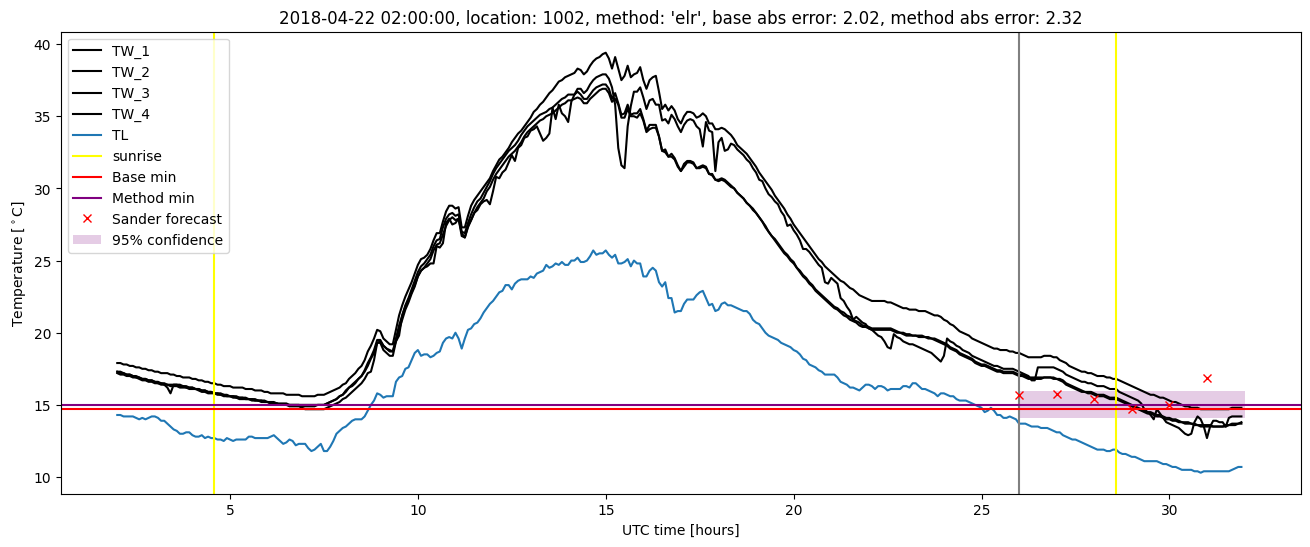
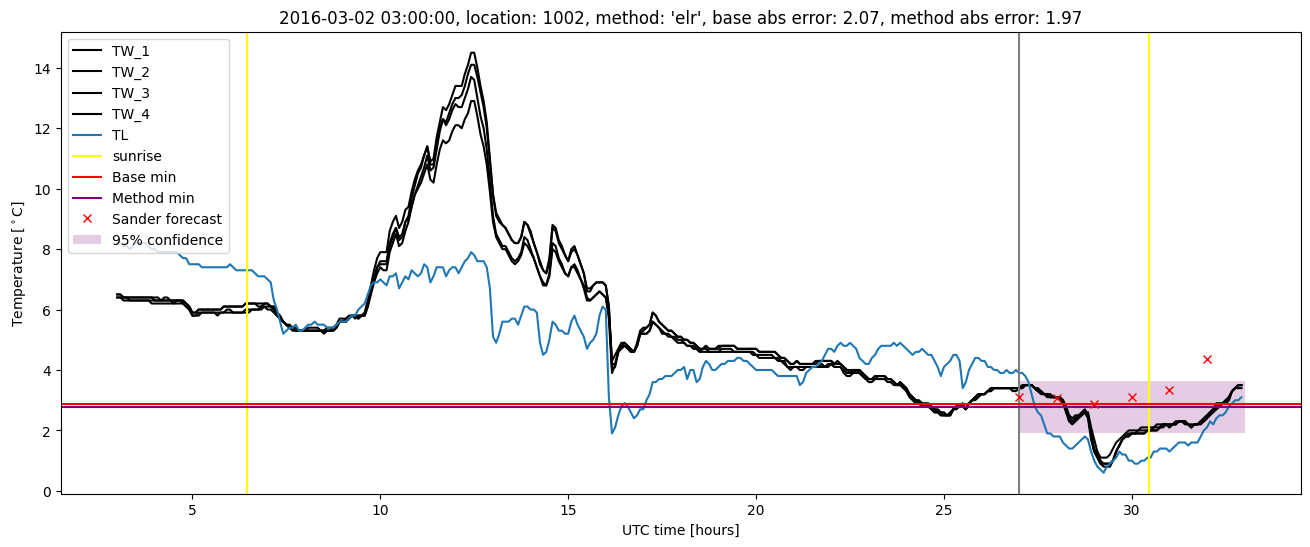
Extended logistic regression results
| names |
period |
power |
significance |
meanSquareError |
absError |
maxError |
CRPS |
IGN |
| baseline |
winter 2016 |
1.000 |
0.154 |
0.333 |
0.404 |
2.541 |
NaN |
NaN |
| elr |
winter 2016 |
0.994 |
0.154 |
0.326 |
0.407 |
2.655 |
0.511 |
4.060 |
| baseline |
winter 2017 |
0.977 |
0.000e+00 |
0.340 |
0.408 |
2.181 |
NaN |
NaN |
| elr |
winter 2017 |
0.985 |
0.087 |
0.349 |
0.448 |
1.898 |
0.502 |
3.391 |
| baseline |
winter 2018 |
0.980 |
0.286 |
0.316 |
0.422 |
2.018 |
NaN |
NaN |
| elr |
winter 2018 |
0.993 |
0.286 |
0.322 |
0.421 |
2.324 |
0.476 |
2.849 |
| baseline |
winter 2019 |
1.000 |
NaN |
0.342 |
0.414 |
1.499 |
NaN |
NaN |
| elr |
winter 2019 |
1.000 |
NaN |
0.263 |
0.383 |
1.272 |
0.442 |
2.609 |
| baseline |
all |
0.987 |
0.120 |
0.330 |
0.411 |
2.541 |
NaN |
NaN |
| elr |
all |
0.992 |
0.160 |
0.329 |
0.423 |
2.655 |
0.495 |
3.432 |
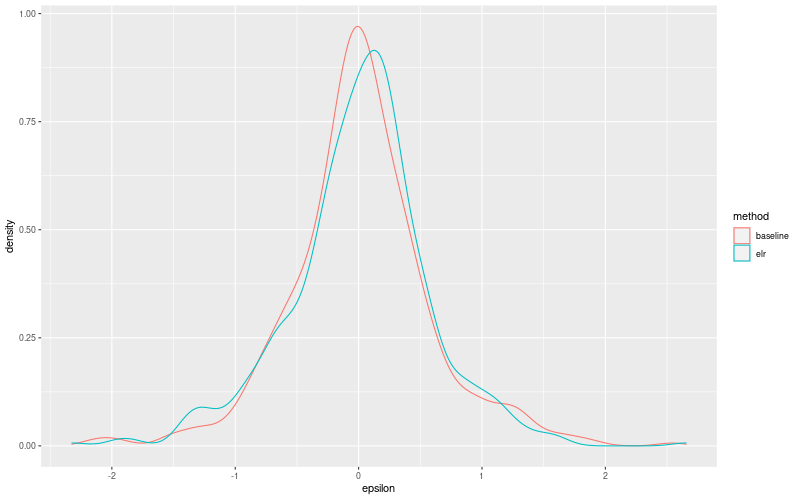
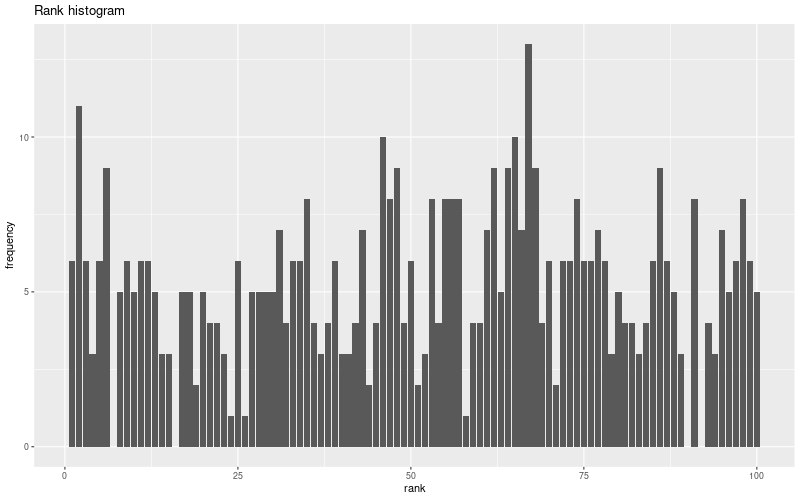
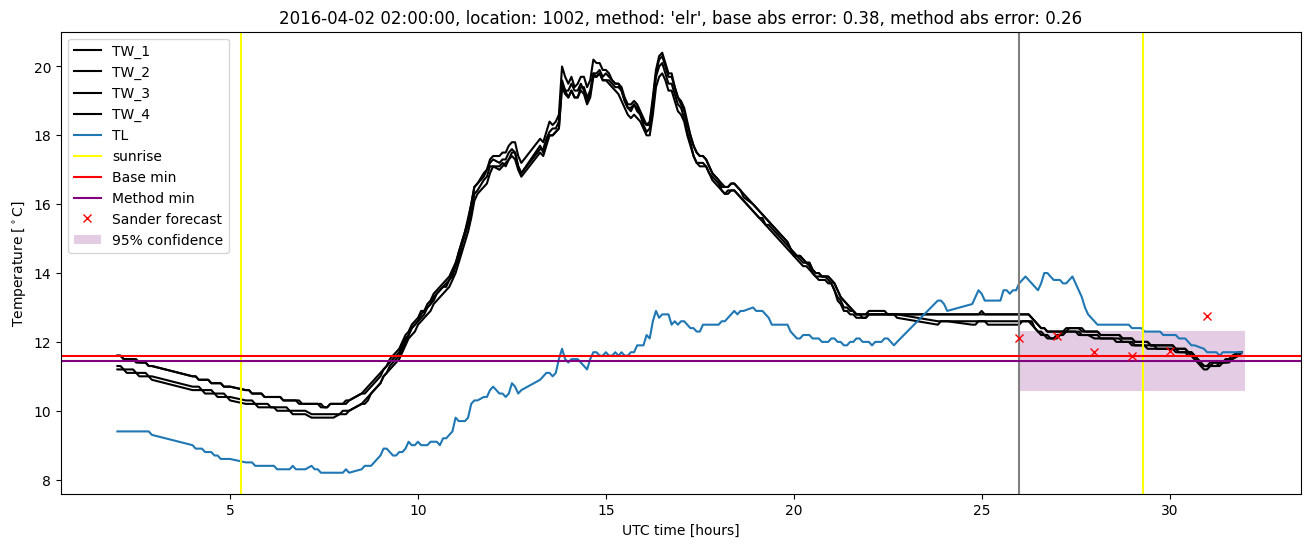
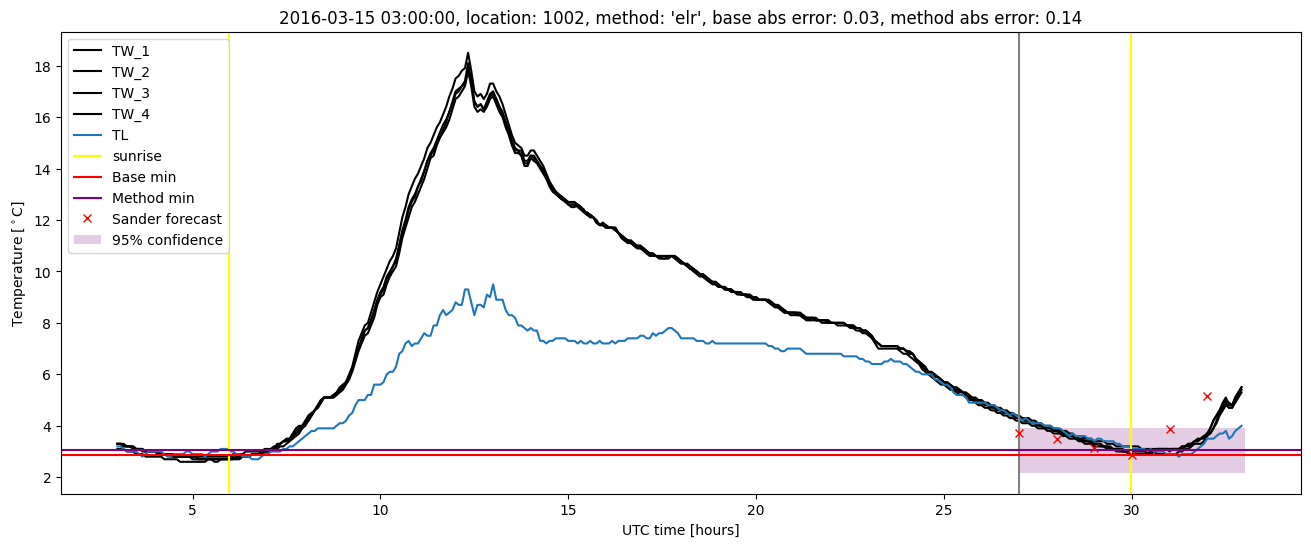
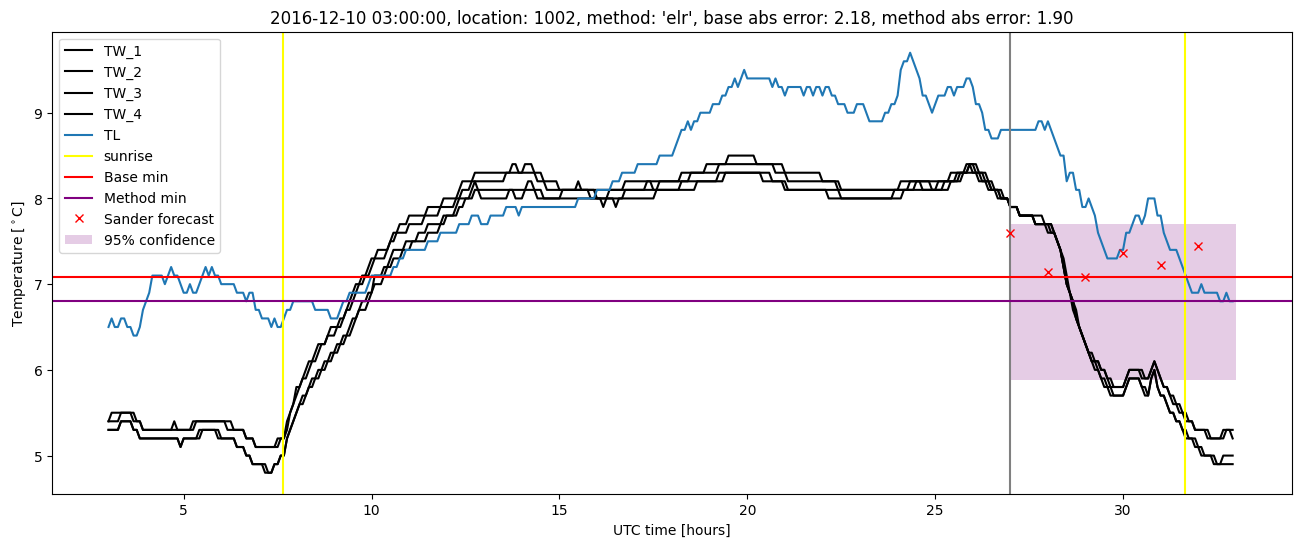
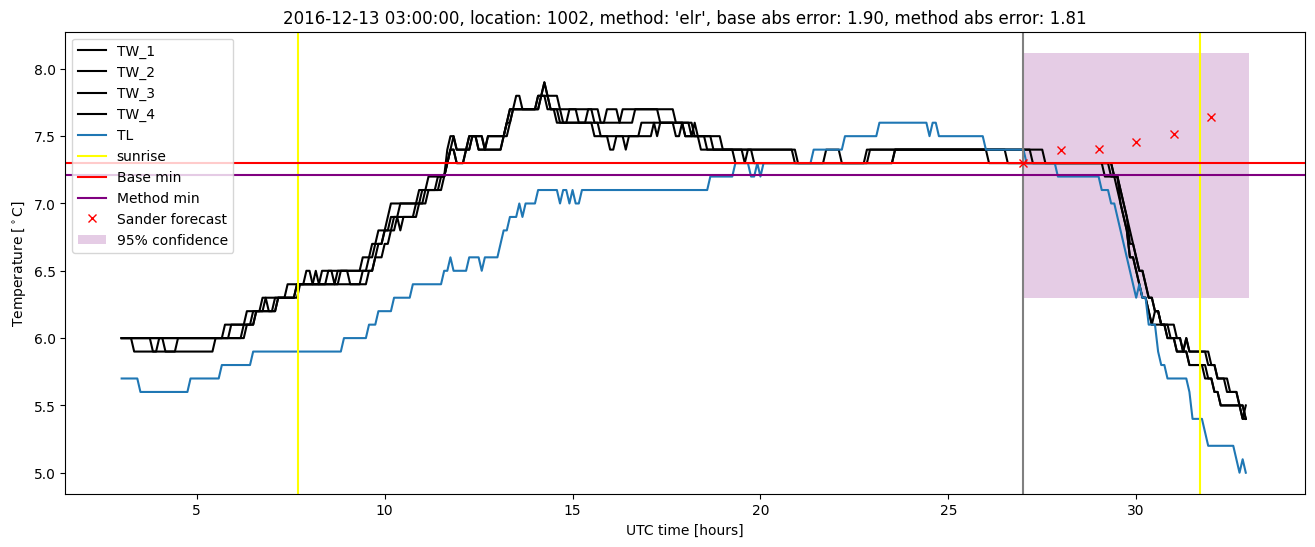
Extended logistic regression plots