GMS location: 1001
Random forest results
| names |
period |
power |
significance |
meanSquareError |
absError |
maxError |
CRPS |
IGN |
| baseline |
winter 2016 |
0.984 |
0.000e+00 |
0.415 |
0.451 |
2.514 |
NaN |
NaN |
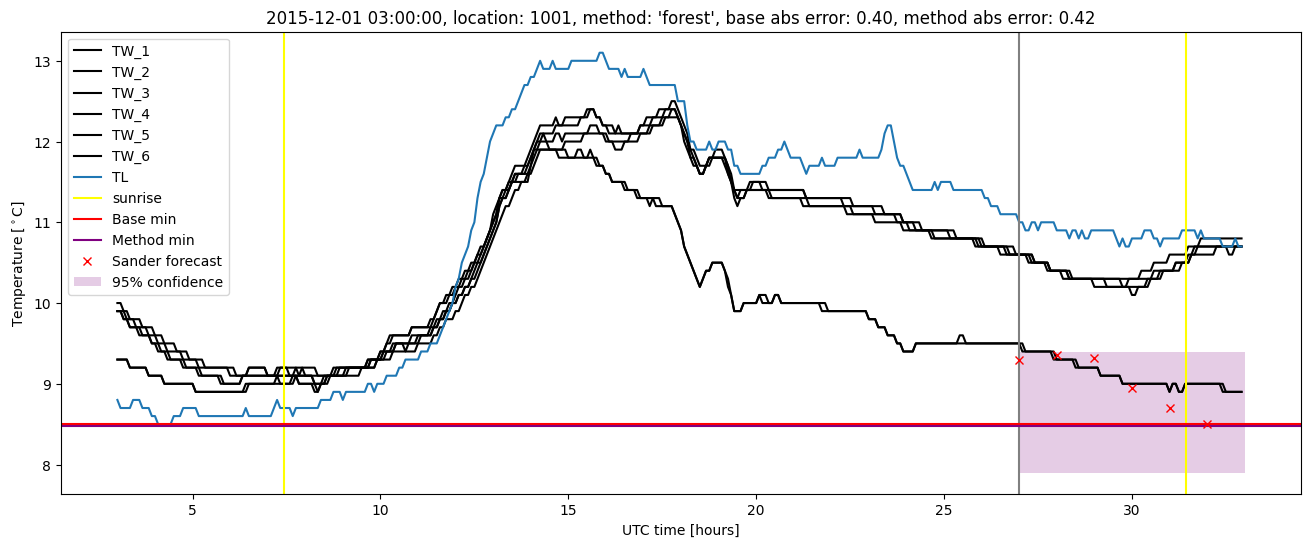
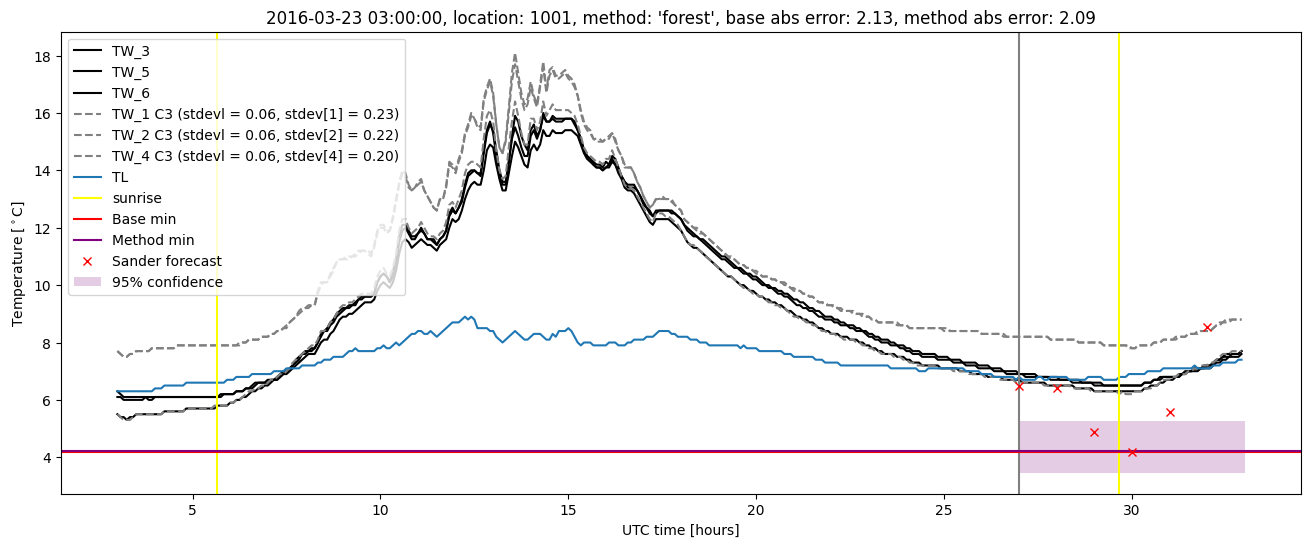
| forest |
winter 2016 |
0.978 |
0.042 |
0.369 |
0.431 |
2.093 |
0.474 |
2.693 |
| baseline |
winter 2017 |
0.964 |
0.062 |
1.191 |
0.558 |
9.933 |
NaN |
NaN |
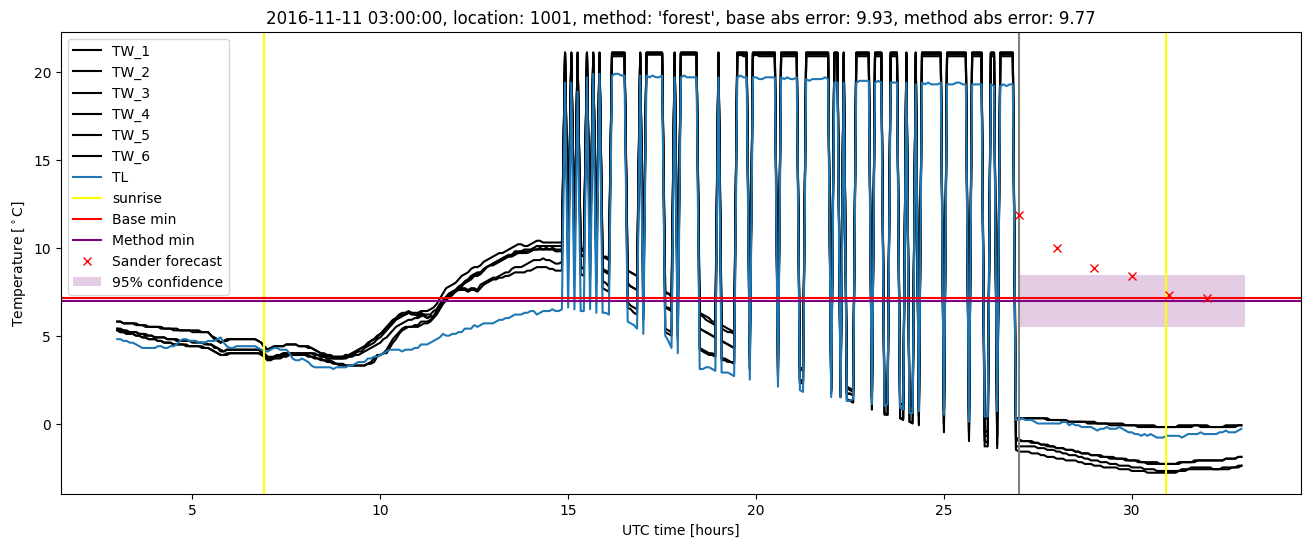
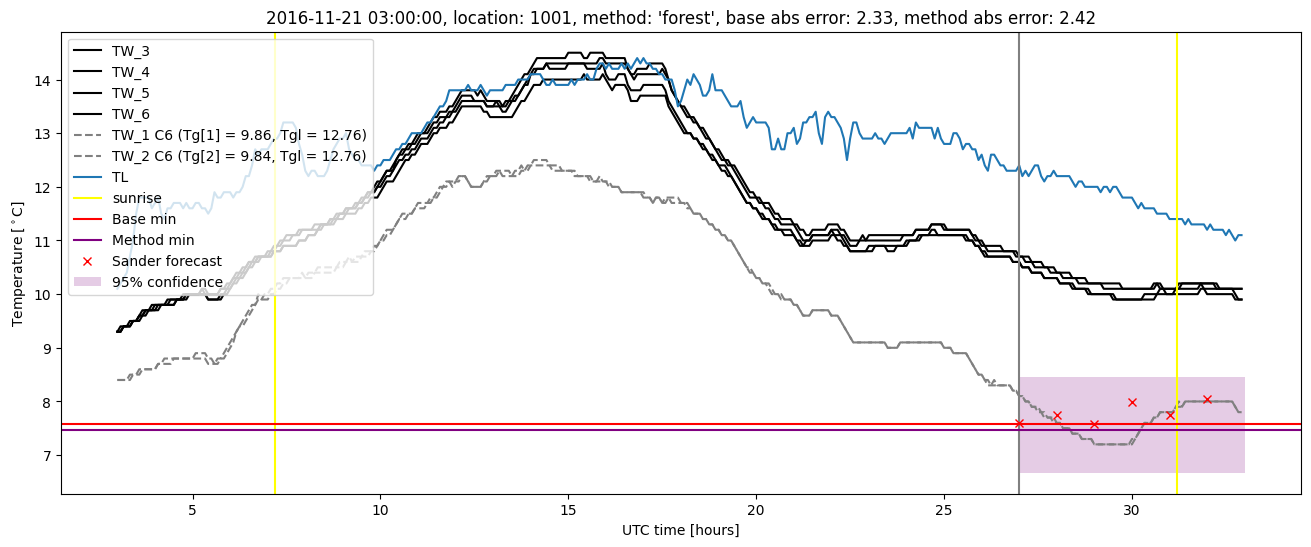
| forest |
winter 2017 |
0.982 |
0.062 |
1.081 |
0.522 |
9.773 |
0.457 |
3.271 |
| baseline |
winter 2018 |
0.987 |
0.133 |
0.330 |
0.430 |
1.832 |
NaN |
NaN |
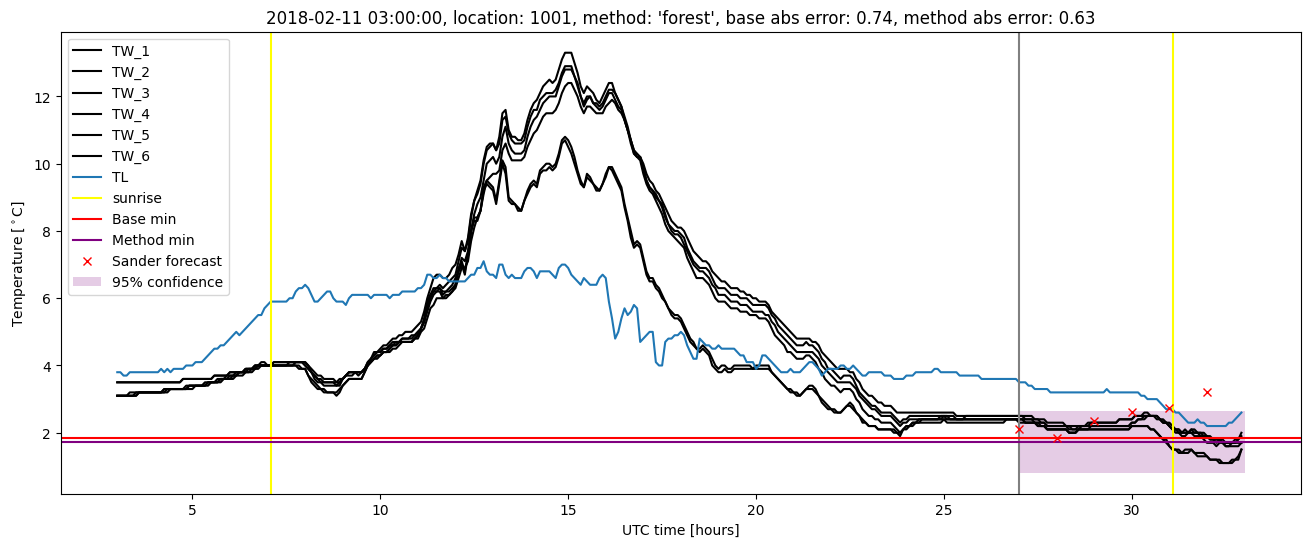
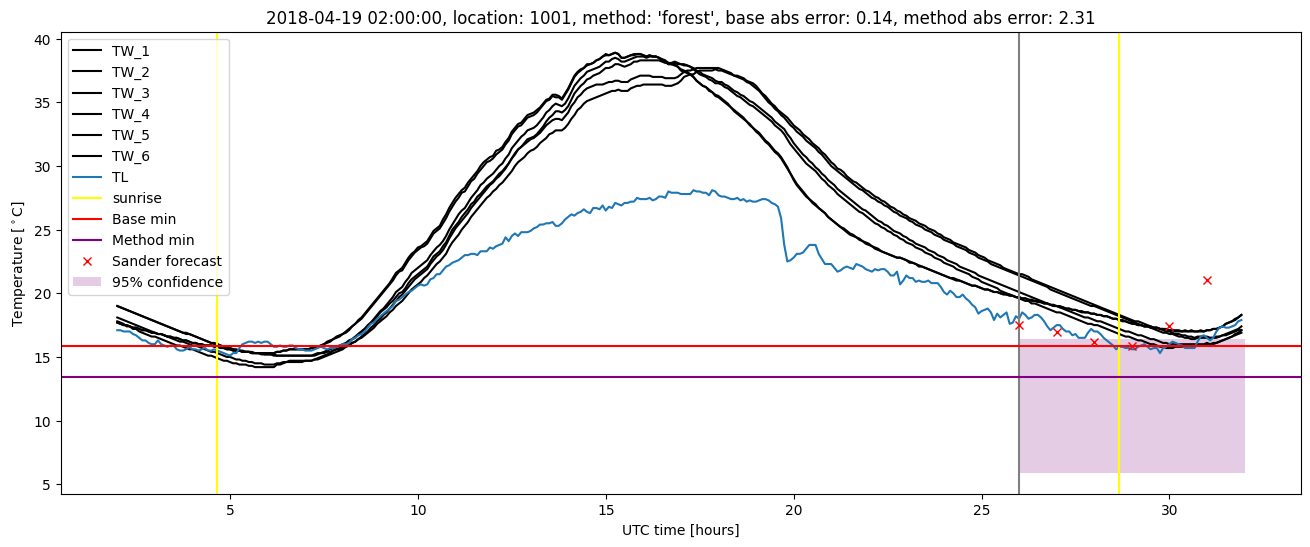
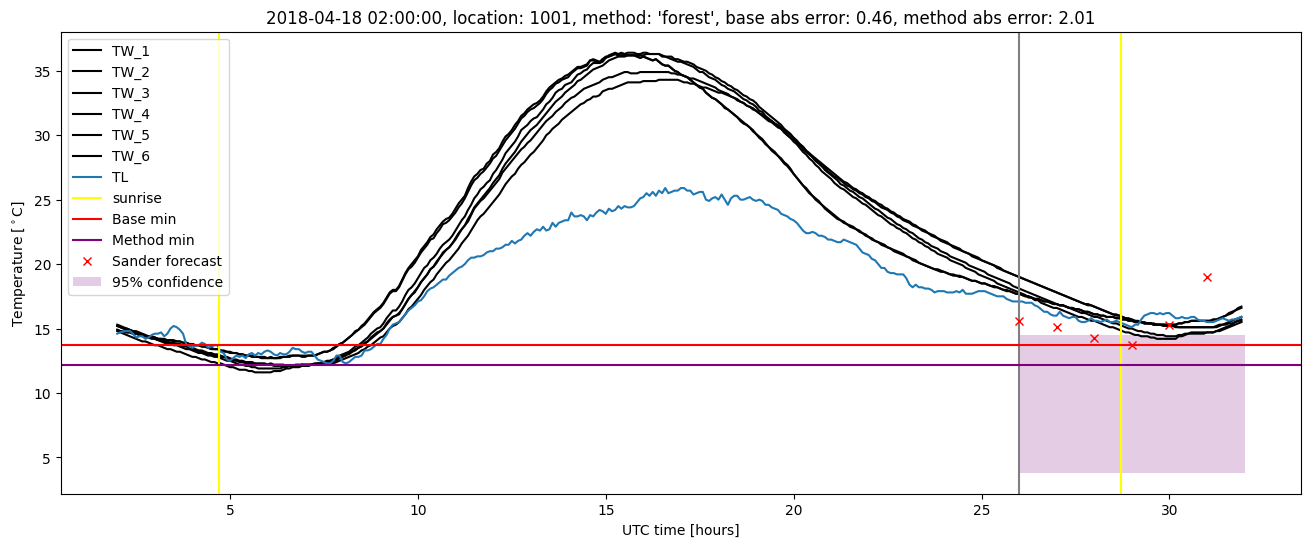
| forest |
winter 2018 |
0.987 |
0.167 |
0.332 |
0.421 |
2.306 |
0.511 |
2.451 |
| baseline |
winter 2019 |
1.000 |
0.000e+00 |
0.361 |
0.433 |
2.214 |
NaN |
NaN |
| forest |
winter 2019 |
1.000 |
0.043 |
0.304 |
0.397 |
1.776 |
0.486 |
2.166 |
| baseline |
all |
0.985 |
0.055 |
0.542 |
0.463 |
9.933 |
NaN |
NaN |
| forest |
all |
0.986 |
0.083 |
0.492 |
0.440 |
9.773 |
0.483 |
2.628 |
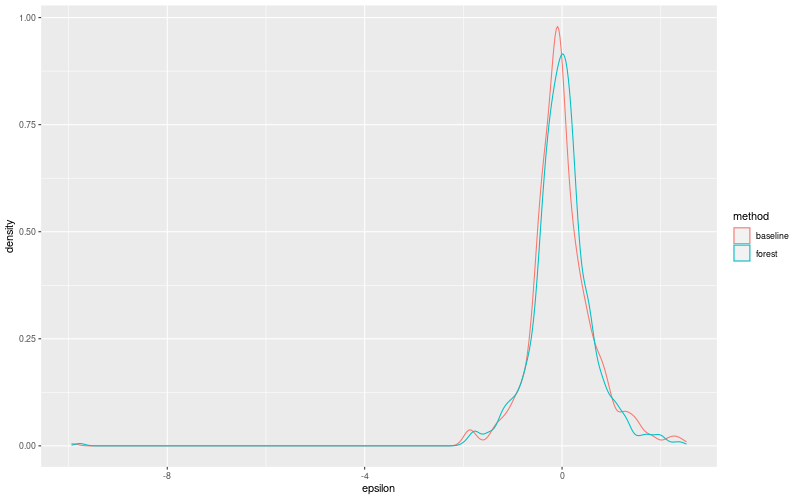
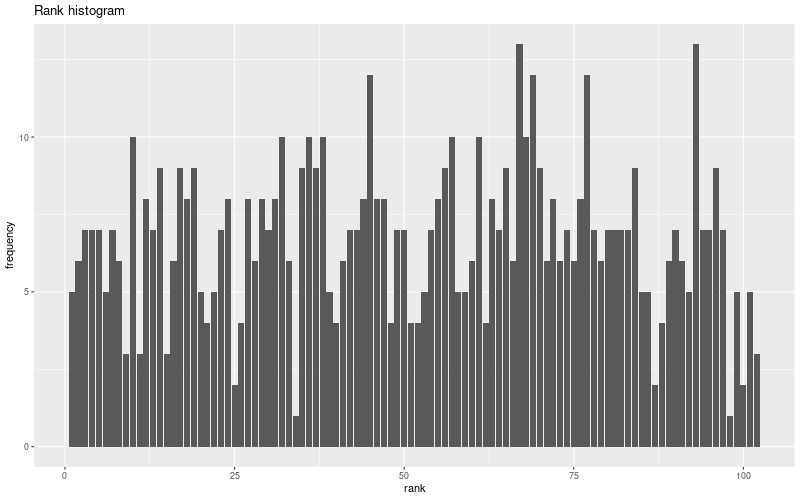
Random forest plots

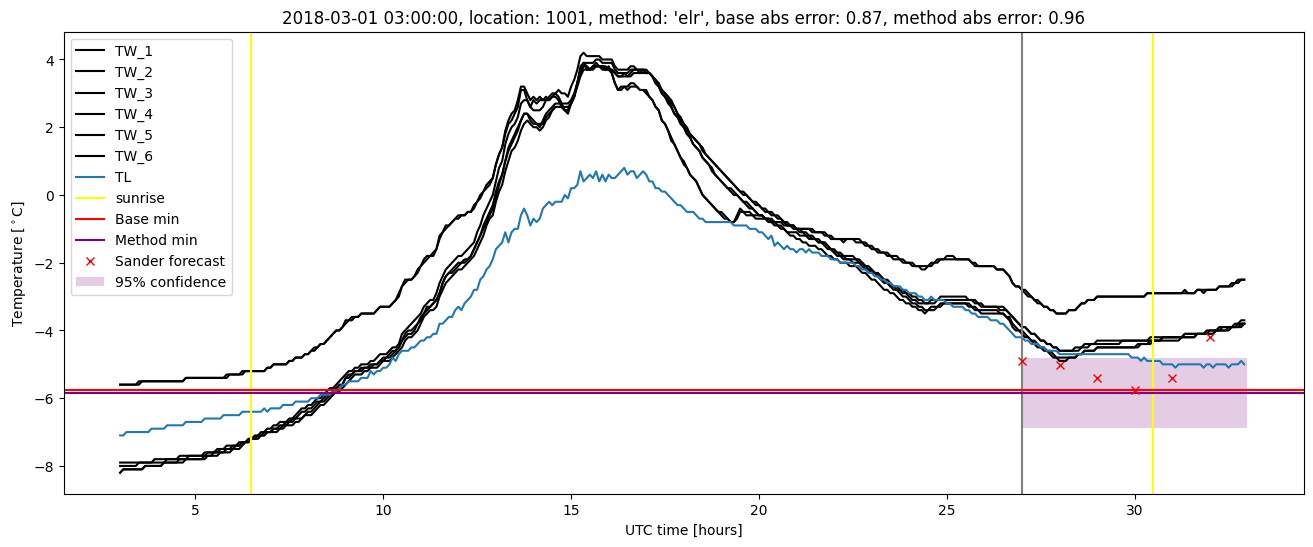
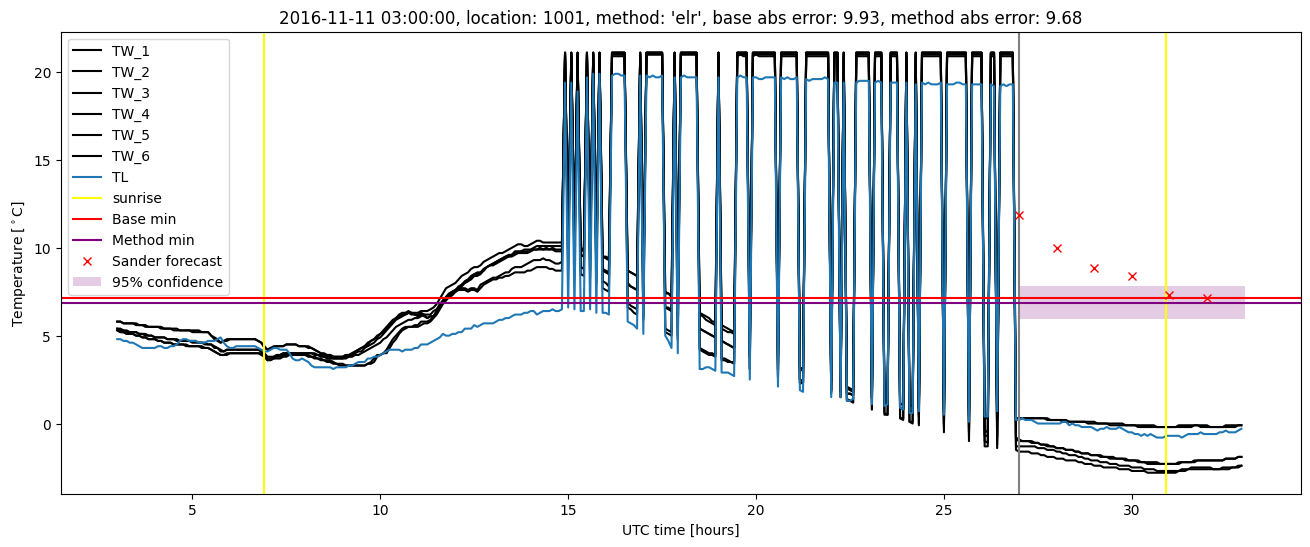
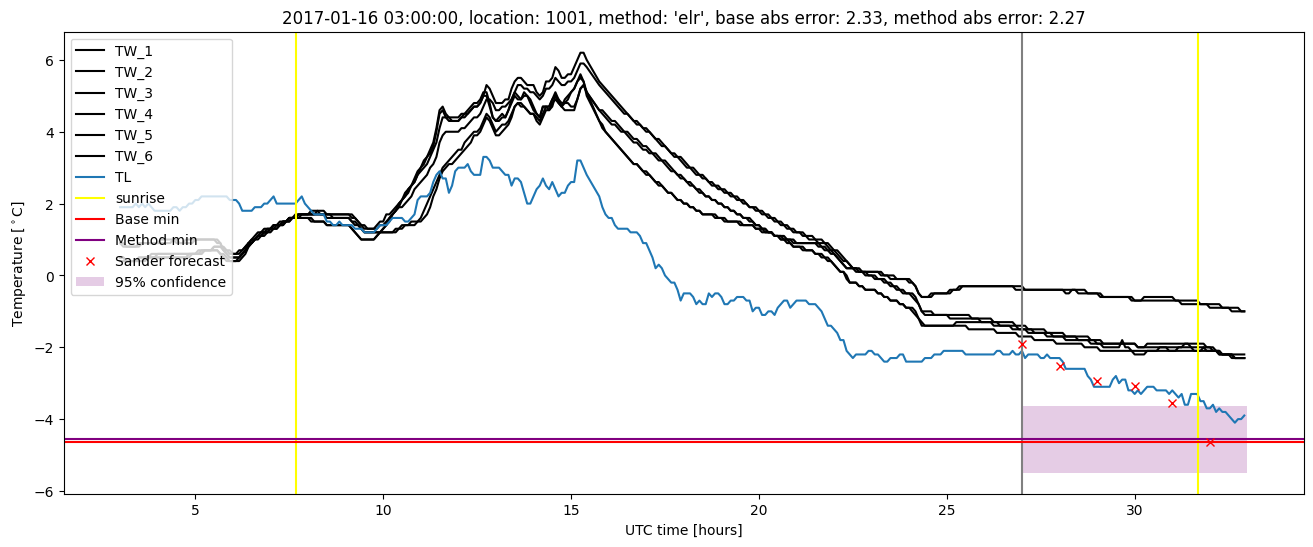
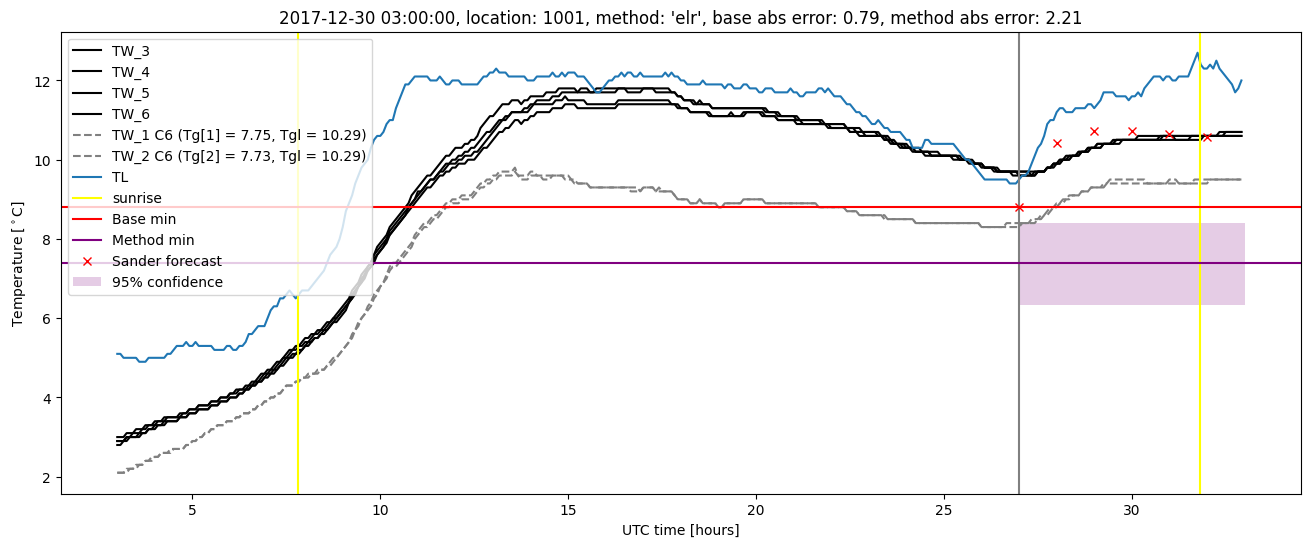
Extended logistic regression results
| names |
period |
power |
significance |
meanSquareError |
absError |
maxError |
CRPS |
IGN |
| baseline |
winter 2016 |
0.984 |
0.000e+00 |
0.415 |
0.451 |
2.514 |
NaN |
NaN |
| elr |
winter 2016 |
0.978 |
0.000e+00 |
0.432 |
0.485 |
2.098 |
0.523 |
3.251 |
| baseline |
winter 2017 |
0.964 |
0.062 |
1.191 |
0.558 |
9.933 |
NaN |
NaN |
| elr |
winter 2017 |
0.964 |
0.031 |
1.093 |
0.545 |
9.682 |
0.534 |
3.573 |
| baseline |
winter 2018 |
0.987 |
0.133 |
0.330 |
0.430 |
1.832 |
NaN |
NaN |
| elr |
winter 2018 |
0.993 |
0.100 |
0.326 |
0.421 |
2.211 |
0.542 |
2.677 |
| baseline |
winter 2019 |
1.000 |
0.000e+00 |
0.361 |
0.433 |
2.214 |
NaN |
NaN |
| elr |
winter 2019 |
1.000 |
0.000e+00 |
0.338 |
0.423 |
1.806 |
0.567 |
2.961 |
| baseline |
all |
0.985 |
0.055 |
0.542 |
0.463 |
9.933 |
NaN |
NaN |
| elr |
all |
0.985 |
0.037 |
0.520 |
0.467 |
9.682 |
0.540 |
3.102 |
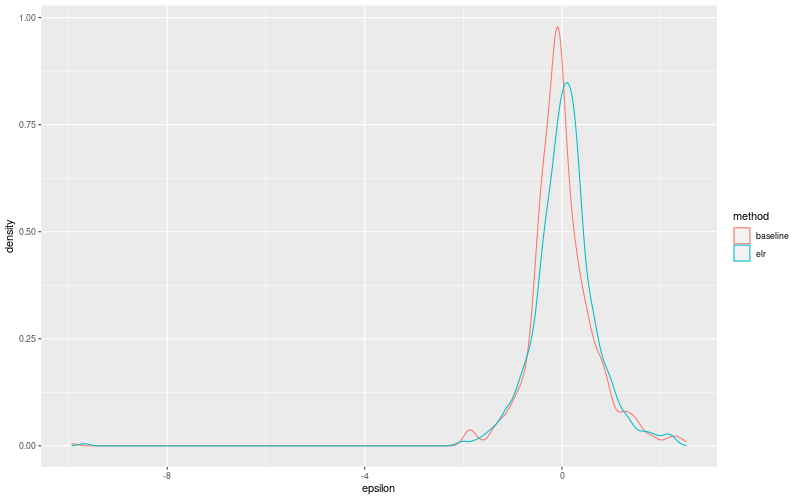
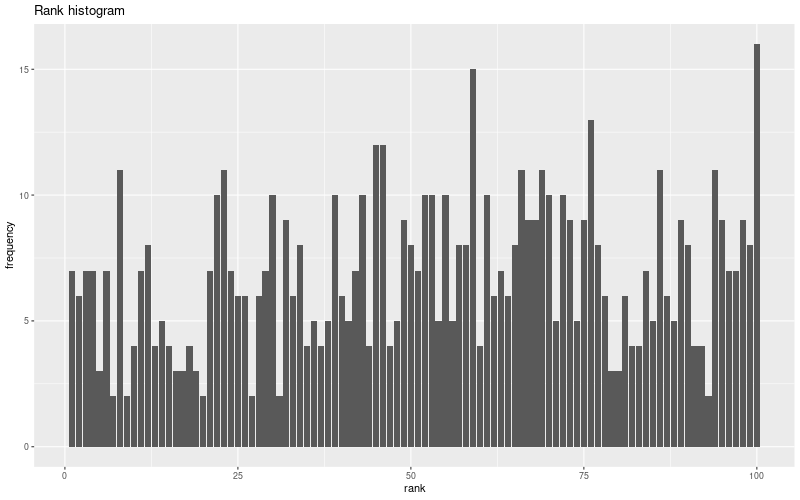
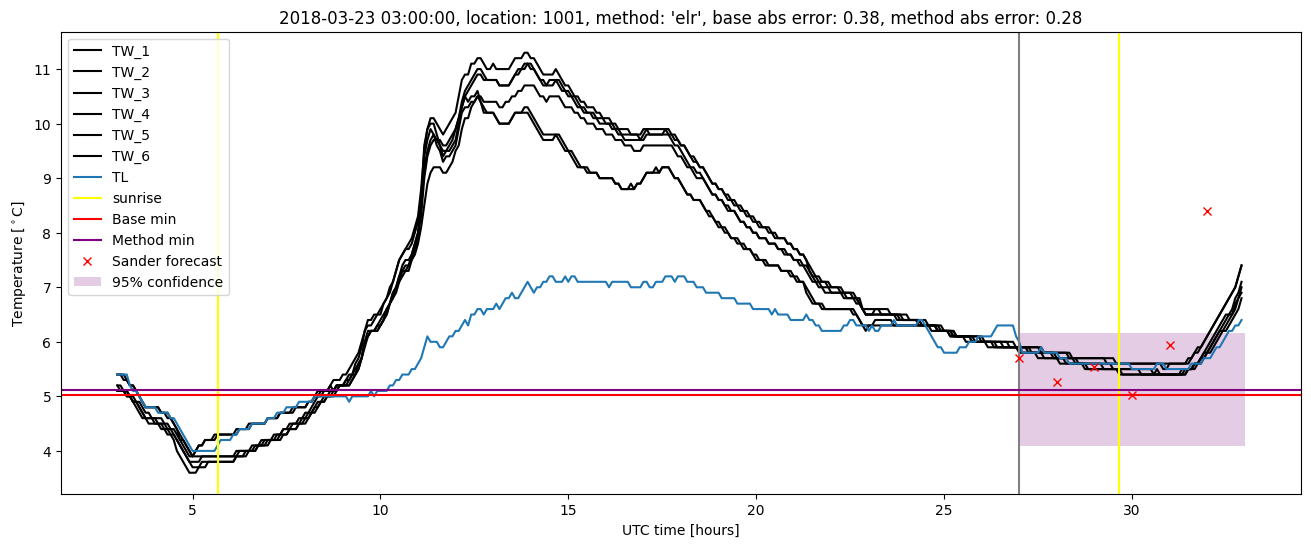
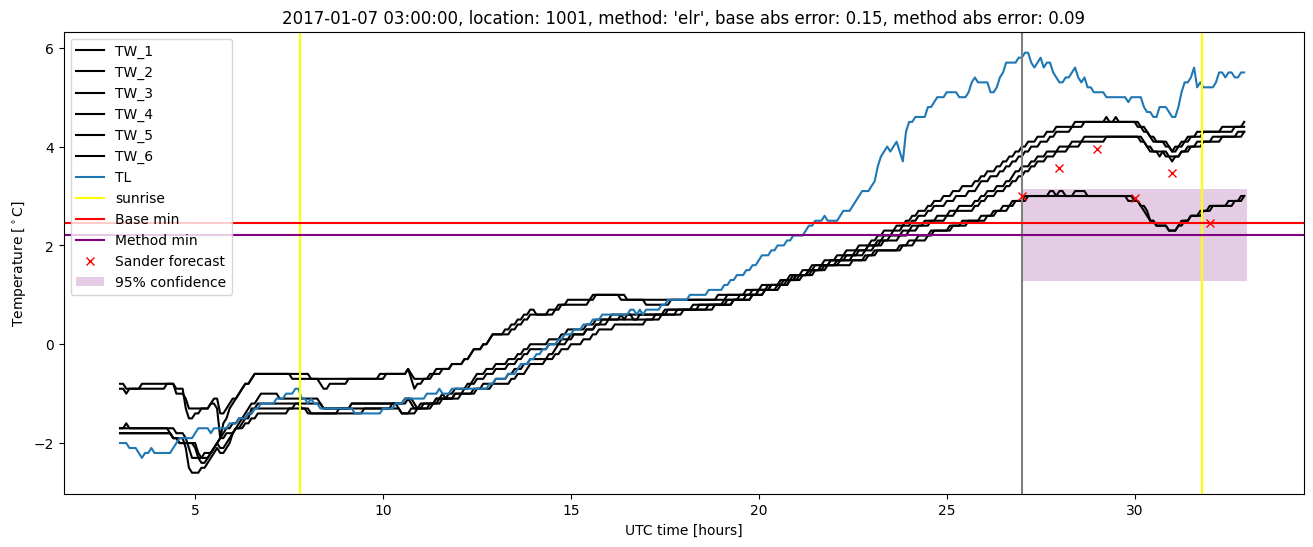
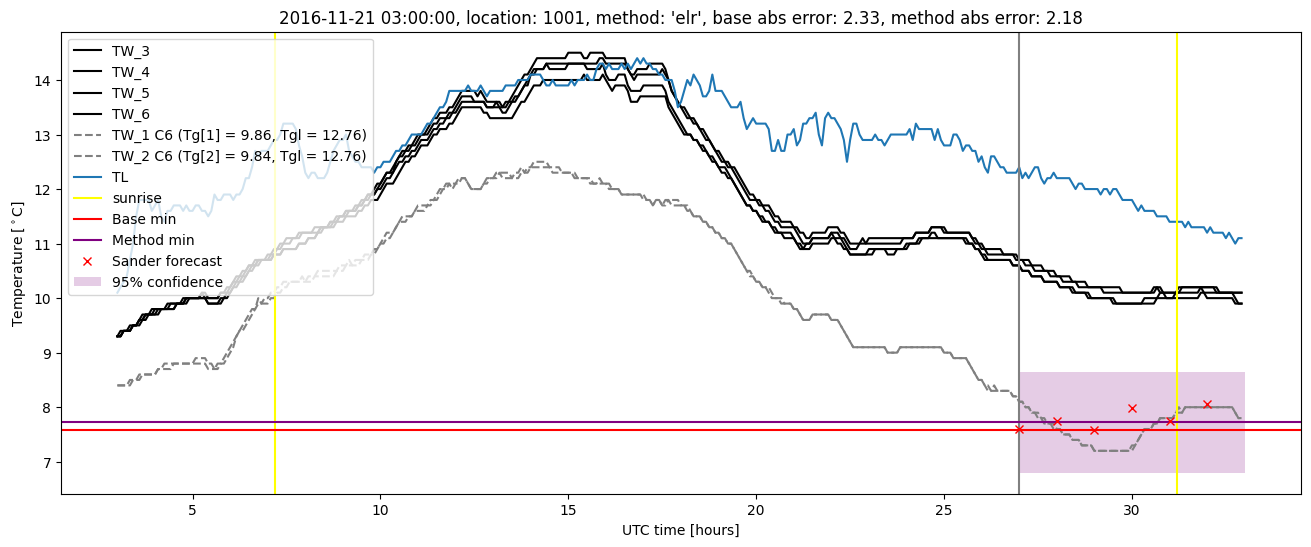
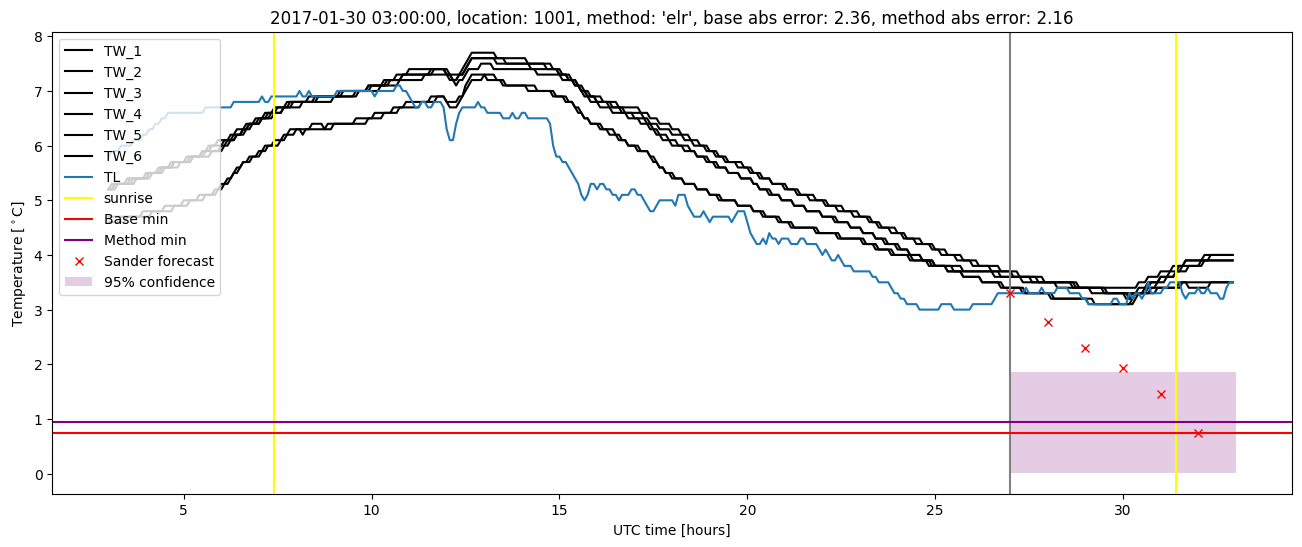
Extended logistic regression plots